Executive summary
Across three Black Friday seasons from 2023 to 2025, we analyzed traffic to a group of retailers protected by F5 Distributed Cloud Bot Defense in three sub-industries: fashion, ecommerce, and quick-service restaurants (QSR).
The season is defined as the window from mid-September to the end of November or the first days of December, covering about 10 weeks before Black Friday and up to a week after it. We set out to establish when automation occurred relative to Black Friday, which parts of a retail site were targeted, and whether those behaviors held steady across seasons.1
Two patterns held across all three seasons. First, the automation rate fell on Black Friday itself, while the weeks before November carried a higher rate than the week from Black Friday onward. Second, automation concentrated on web rather than on mobile APIs.
One widely assumed pattern did not hold. We expected automation against a given flow to climb steadily as Black Friday approached, but it did not do so. The product search, account, and gift-card flows each rose in some seasons and fell in others.
Overall automation rose across the three seasons, from 17.4% of transactions in 2023 to 18.5% in 2024 and 28.6% in 2025. The group of retailers also grew over the same period, and part of that increase reflects a change in who was measured rather than a change in behavior alone. The two steps behaved differently: the movement from 2023 to 2024 is accounted for entirely by the change in the group, defined below, whereas the larger rise from 2024 to 2025 held up among the retailers measured in both seasons.2
Data and method
The analysis covers three observation windows, each beginning in mid-September and ending at the end of November or in the first days of December:
- September 17, 2023 to November 30, 2023
- September 17, 2024 to December 6, 2024
- September 17, 2025 to December 5, 2025
Black Friday fell on November 24, 2023, November 29, 2024, and November 28, 2025, respectively. Where seasons are compared directly, days are realigned to Black Friday.
Two terms carry specific meanings in this analysis. The first is platform, which separates web from mobile API. Web covers traffic reached through a browser, whether on a desktop computer or a phone, whereas the mobile API covers the interfaces that a retailer’s own app calls to fetch data and submit requests.3
The second term is flow, which is a category of endpoints grouped by the function they perform. A single function may be served from one endpoint on one site and from many on another. Every endpoint that authenticates a customer, for example, is assigned to the login flow, regardless of how many such endpoints exist or what each one is called individually. Grouping in this way allows us to compare the same function across retailers that build their sites differently. The flows used here include product search, login, account creation, password reset, adding an item to a cart, and gift-card balance checks.
Sub-industry is our own classification of each retailer’s primary business rather than an industry standard. Fashion covers apparel and footwear retailers, QSR covers quick-service restaurant chains, and ecommerce is the residual category for general and multi-category online retailers. Fashion and QSR retailers sell online too, so ecommerce here describes a retailer’s primary category rather than its sales channel.
In the retailer group, volume is concentrated in a small number of large retailers, so movement between seasons partly reflects changes in the group rather than changes in automation behavior. Restricting each comparison to the retailers present in both of the seasons being compared measures how much of each movement the group accounts for. Across the full three seasons the overall automation rate rose 11.2 percentage points, of which 5.6 percentage points occurred among retailers measured in both 2023 and 2025 and 5.5 percentage points came from the group changing. In this comparison the two contribute in roughly equal measure. Only a minority of retailers appear in all three seasons and the group grew across them, so the rise in the overall automation rate from 17.4% to 28.6% describes this group over these three windows, with its composition changing throughout, rather than a clean measure of increasing automation across retail.4
The two steps that make up that rise behave differently, and the distinction matters more than the three-season total. Between 2023 and 2024 the overall automation rate rose 1.0 percentage point, from 17.4% to 18.5%, but among the retailers present in both seasons it fell, from 21.6% to 18.1%. The apparent increase is therefore accounted for mainly by the retailers present in 2023 but not in 2024, which carried about a fifth of the 2023 volume at an automation rate below 2%. The retailers present in 2024 but not in 2023 ran at close to the rate of those present in both seasons. Between 2024 and 2025 the pattern reverses: the overall automation rate rose 10.1 percentage points while the like-for-like rate rose further still, from 16.7% to 29.8%, so the group changing held that rise down rather than creating it. Read together, the 2024 figure is produced by which retailers were measured, whereas the 2025 rise is not explained by the group changing.5
Findings
Automation rate fell on Black Friday rather than reaching its highest point
In all three seasons, the automation rate dipped on Black Friday itself and recovered over the following days. The automation rate on Black Friday was 11.6% in 2023, 14.8% in 2024, and 14.6% in 2025. In each case, that was below the rate for November as a whole in the same season, which was 15.3%, 17.8%, and 24.5%, respectively.
This dip does not mean that the bots went away. The automation rate is a proportion, so it falls whenever human traffic grows faster than automated traffic. Measured in transactions rather than as a share, automated volume on Black Friday ran 20% above the average of the preceding seven days in 2023 and 17% above it in 2024, while human volume rose far faster, by 61% and 54%. In 2025 the picture differed: automated volume fell 22% against a 43% rise in human volume. The dip in the rate is therefore mostly a denominator effect in the first two seasons, and in the third that effect combined with a genuine fall in automated volume. By Cyber Monday, three days later, the automation rate had climbed back to 13.4% in 2023, 17.1% in 2024, and 17.6% in 2025. In each season, that was above the Black Friday figure, although still below the November rate, so the dip was short-lived rather than a sustained change in behavior. Figure 1 traces the daily automation rate through each season, with the three seasons aligned on Black Friday so that the same point in the shopping calendar lines up.
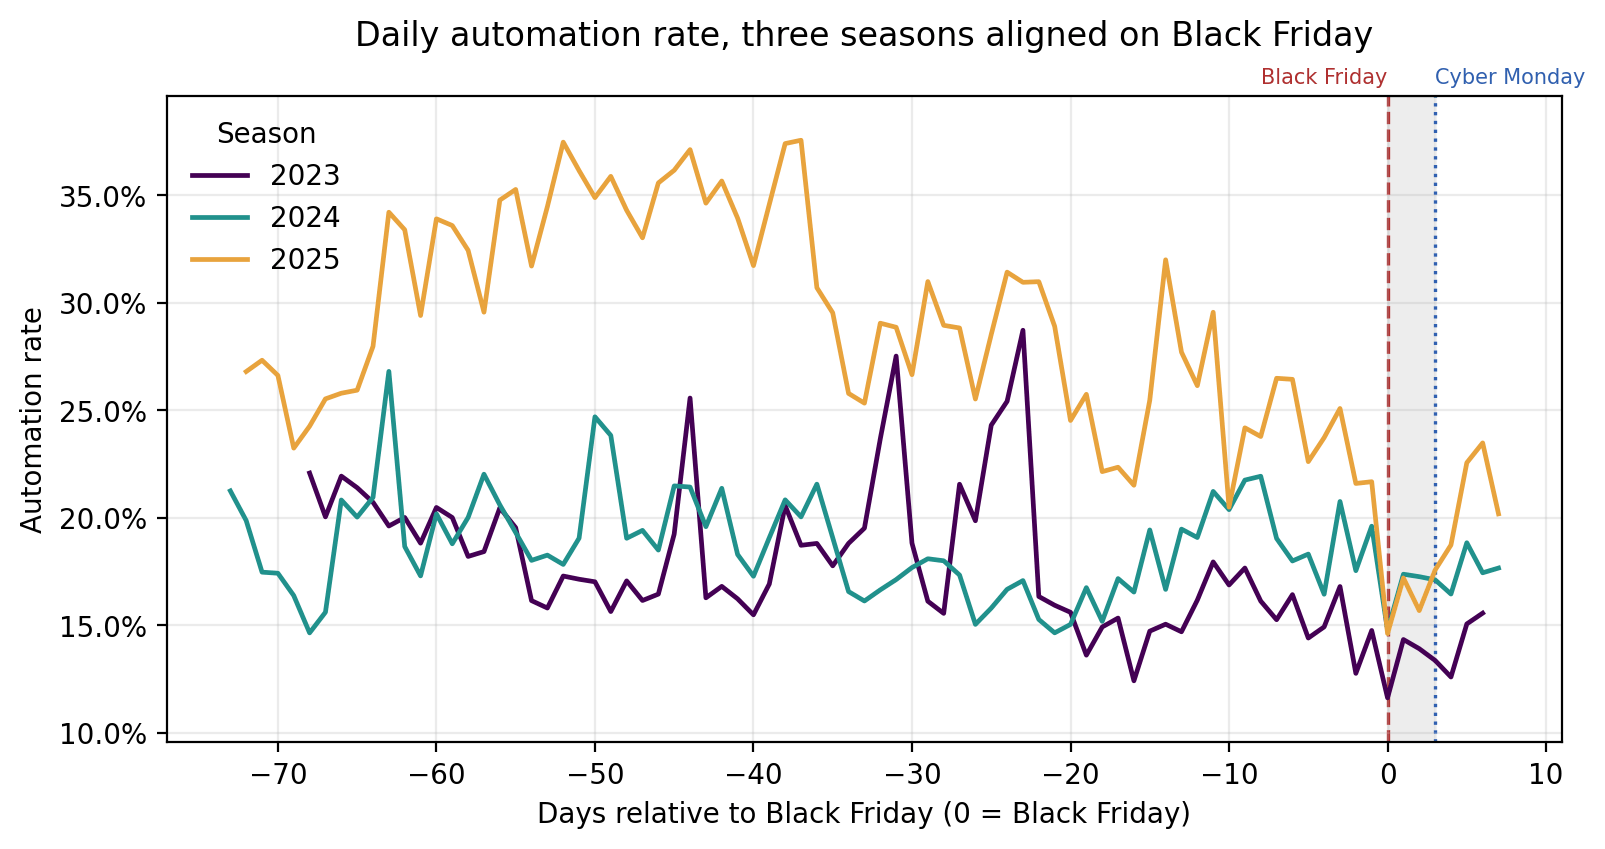
Figure 1 also shows that the dip was brief. Automation rates climbed back from the Black Friday low within a few days, once the busiest human shopping had passed, although in each season they settled below the level of the weeks before. This happened in every season, even though the three seasons ran at very different overall levels.
The automation rate ran highest before November
Splitting each season into three windows shows when automation was most concentrated and how the rate moved across the season. The three windows are the weeks before November, which run from the start of each observation window to October 31st and cover 45 days in every season; November before Black Friday, which runs from November 1st to the day before Black Friday and covers 23 days in 2023, 28 in 2024, and 27 in 2025 because Black Friday falls on a different date each year; and Black Friday week, which starts on Black Friday itself and covers that day and the six that follow. The weeks before November carried a rate of 19.3% in both 2023 and 2024, and 31.9% in 2025. November before Black Friday ran lower, at 16.0%, 18.0%, and 25.8%. Black Friday week itself ran lower still, at 13.6%, 16.9%, and 18.2%.
Figure 2 sets daily transaction volume against the automation rate for each season, which shows why the two move in opposite directions on Black Friday itself.
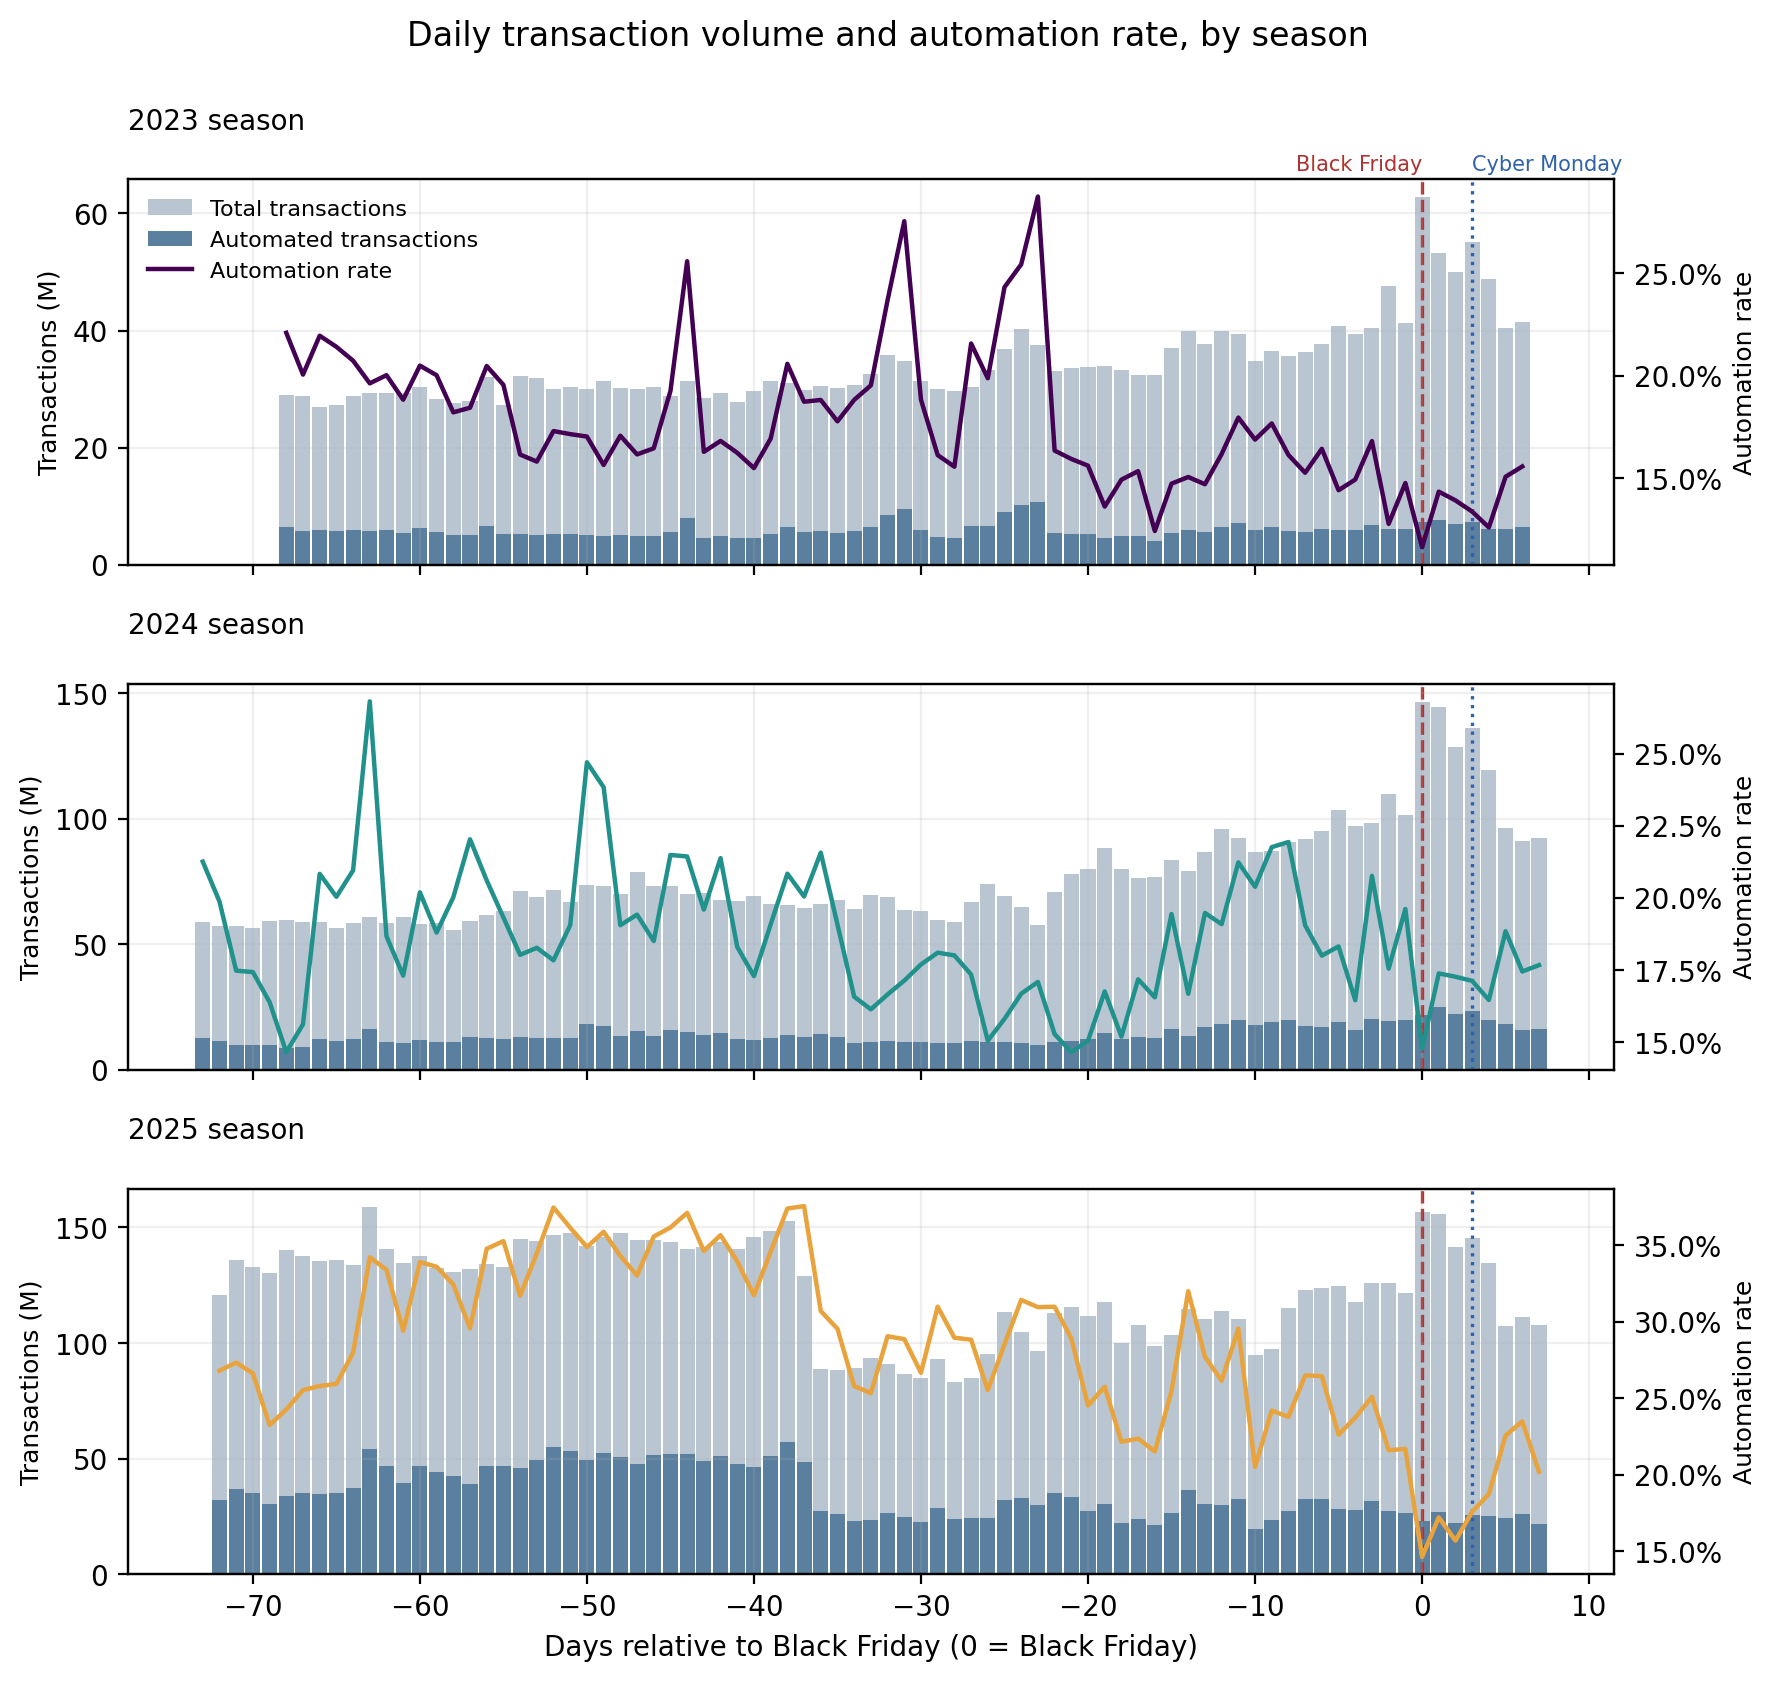
Peak automated volume did not fall on a consistent day. It occurred on November 1, 2023 (BF-23), November 30, 2024 (BF+1), and October 21, 2025 (BF-38), which is 23 days before, one day after, and 38 days before Black Friday, respectively. Three dates this far apart give us no basis for predicting when the busiest day will fall in 2026.
Automation concentrated on web rather than the mobile API
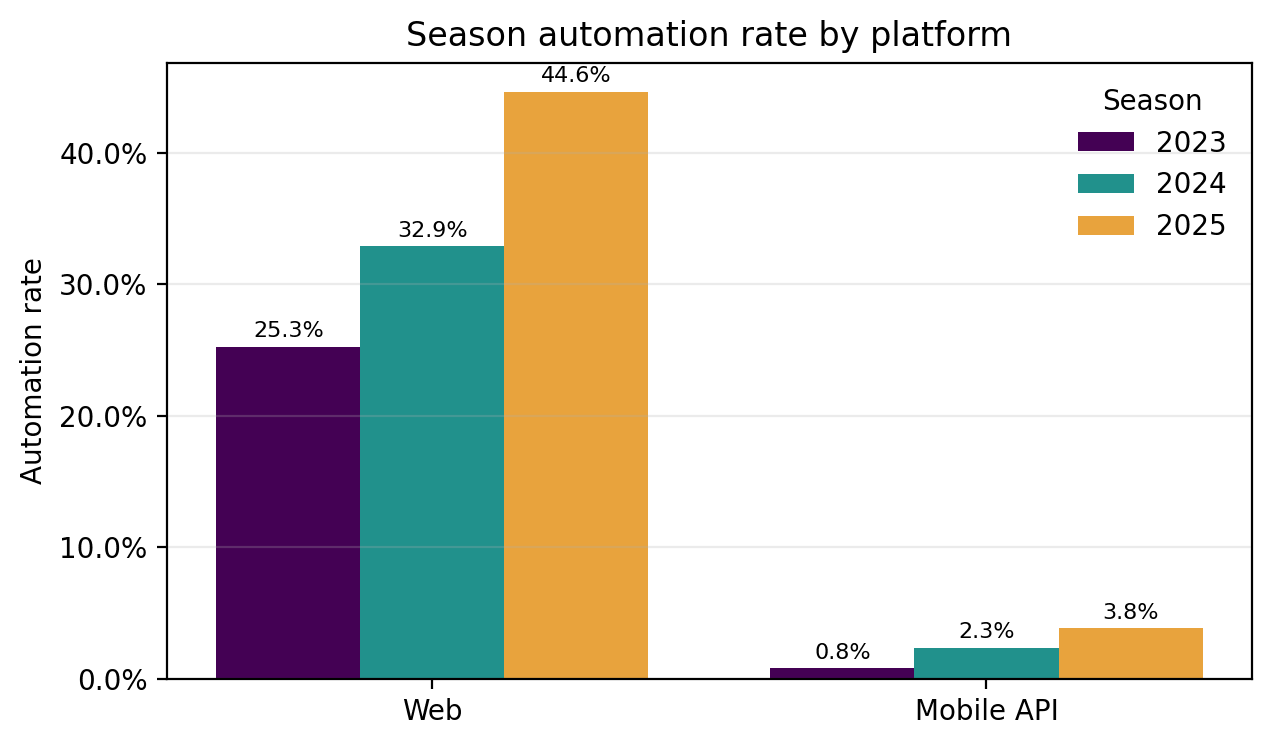
Web automation rates ran at 25.3% in 2023, 32.9% in 2024, and 44.6% in 2025. Mobile API rates over the same seasons were 0.8%, 2.3%, and 3.8%. In other words, a web transaction was about 33 times as likely to be automated as a mobile API one in 2023, 14 times in 2024, and 12 times in 2025.
The gap narrowed across the three seasons, because mobile API rates rose from a very low base while web rates rose from an already high one, so the ratio fell even though web stayed at least 10 times the mobile API rate throughout. The mobile API accounted for roughly a third to a half of all transactions in each season, so both platforms were measured on large volumes. The difference therefore lies in how automation was distributed between the platforms. Figure 3 shows the two platforms side by side for each season.
One caveat matters for interpreting this. Our previous research has found that where web and the mobile API are equally well protected, web attracts higher volumes of automation. Where the mobile API is much less well protected than the website, it usually becomes the main target instead. The pattern above should be read as describing retailers with comparable protection on both platforms, not as a general claim that the mobile API is inherently safer.6
Flow profiles differed by sub-industry
Each sub-industry showed automation concentrated on a different part of the site. A flow profile describes which flows carried the most automation within one sub-industry and platform, and in what order.
The highest automation rate fell on product search in fashion web traffic, on adding items to a cart in ecommerce web traffic, and, in QSR web traffic, on gift-card balance checks in 2024 and 2025 and on password reset in 2023. Profiles are heavily influenced by site design and user journeys across the highest-volume retailers within each sub-industry.
Three related factors offer a plausible account of these differences, although we did not test them against sub-industry as a competing explanation. The first is site design, meaning the pages and functionality a retailer builds. The second is the user journey, meaning the steps a shopper takes to complete a purchase. This is a separate consideration from the design of the site itself: whether a retailer requires an account to complete a purchase or supports guest checkout, whether it operates a loyalty or points program, and whether it offers wish lists or saved product lists all determine which flows exist and which a shopper must pass through. The third is which endpoints the retailer chose to protect, since a flow that is not protected does not appear in this data at all; one retailer may protect adding to cart while another protects product search.
We would expect automation to concentrate on login where a retailer requires login to redeem points or coupons, and on product search where it exposes rich product pages without requiring login. We would also expect automated account creation where promotions are restricted to new accounts. The profiles below are consistent with those expectations, but we did not test them.
This matters for how widely the results apply. The profiles below describe the retailers in this group, whose site designs, user journeys, and protected endpoints happen to correlate with their sub-industries. A fashion retailer that required login for purchase would likely resemble the ecommerce profile more than the fashion profile. We would not expect a retailer outside this group to match these flow profiles on the basis of its sub-industry alone.
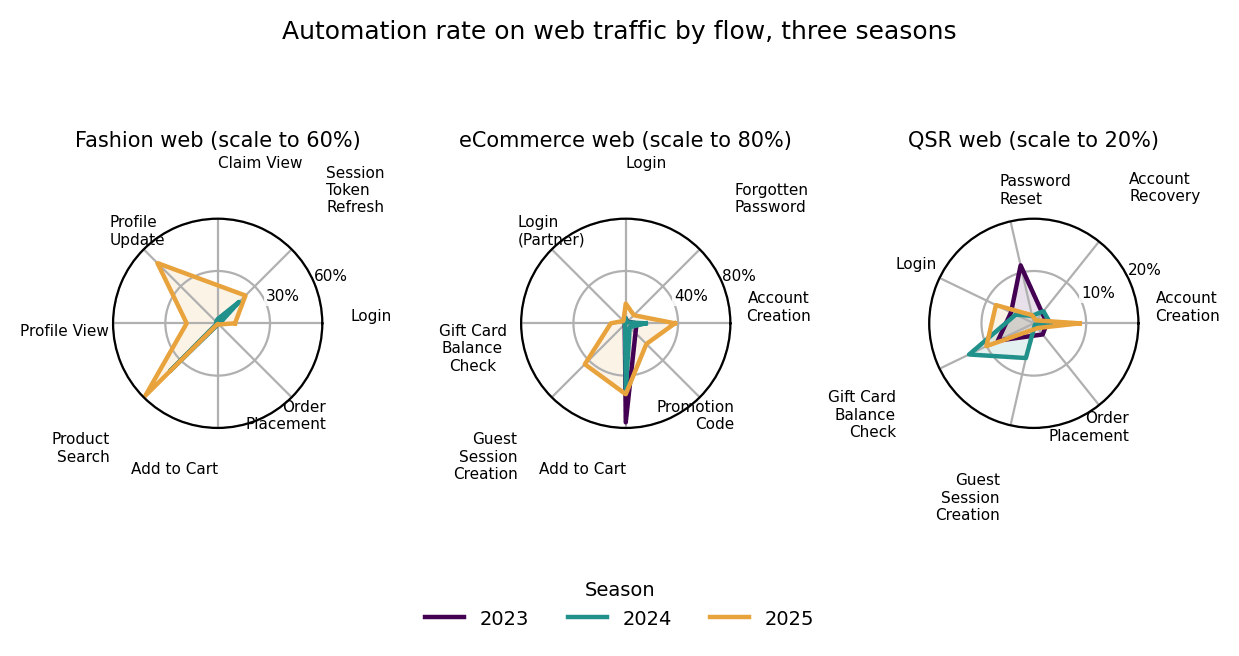
Figure 4 shows that between 2023 and 2025 the automation rate rose on at least one flow in every web sub-industry. In QSR web traffic in 2023 (purple), the highest automation rate fell on password reset, at 11.4%, a flow most often associated with account takeover attacks. In 2024 (teal), the rate on password reset fell to 1.5%, while gift-card balance checking rose to 13.7% and account creation to 3.2%. Automation also appeared on guest session creation at 6.8%, a flow recorded in QSR web traffic in 2024 only. Together, these are consistent with a shift from account takeover toward fake account creation and gift-card fraud. In 2025 (amber), account creation rose further to 8.8% and login to 8.0%, while gift-card balance checking remained high at 10.1%.
Fashion web, 2023 to 2025
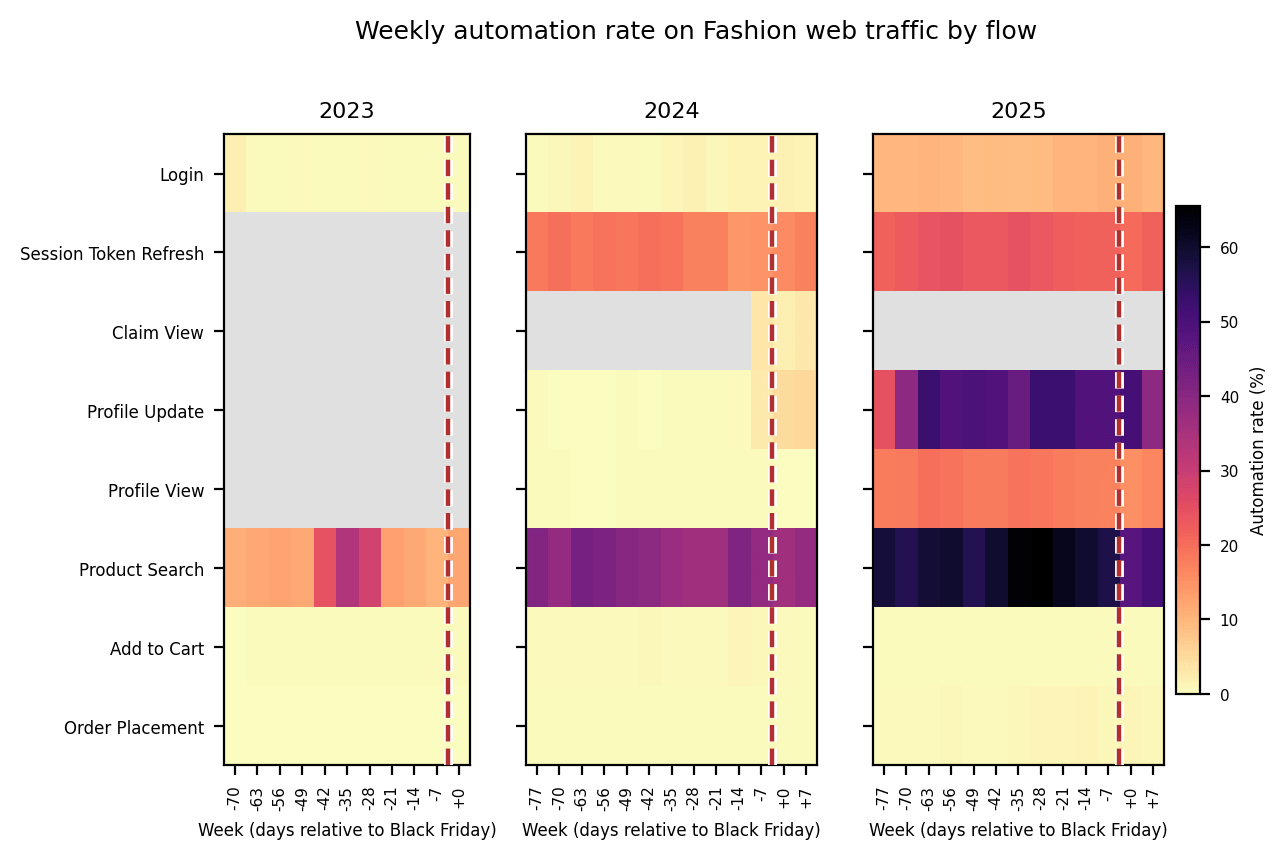
Fashion web automation concentrated on product search throughout. The automation rate on product search rose across the three seasons, from 17.1% in 2023 to 38.7% in 2024 and 58.6% in 2025. This is consistent with scraping of catalog, pricing, and availability data from product pages, and, on high-demand releases, with inventory hoarding. Login automation also rose in each season, from 0.5% to 1.1% and then 9.9%, which is consistent with credential stuffing and with automated access to saved product lists, since a signed-in account is what makes a wish list or a saved size readable. Figure 5 breaks these flows down week by week across the three seasons.
Ecommerce web, 2023 to 2025
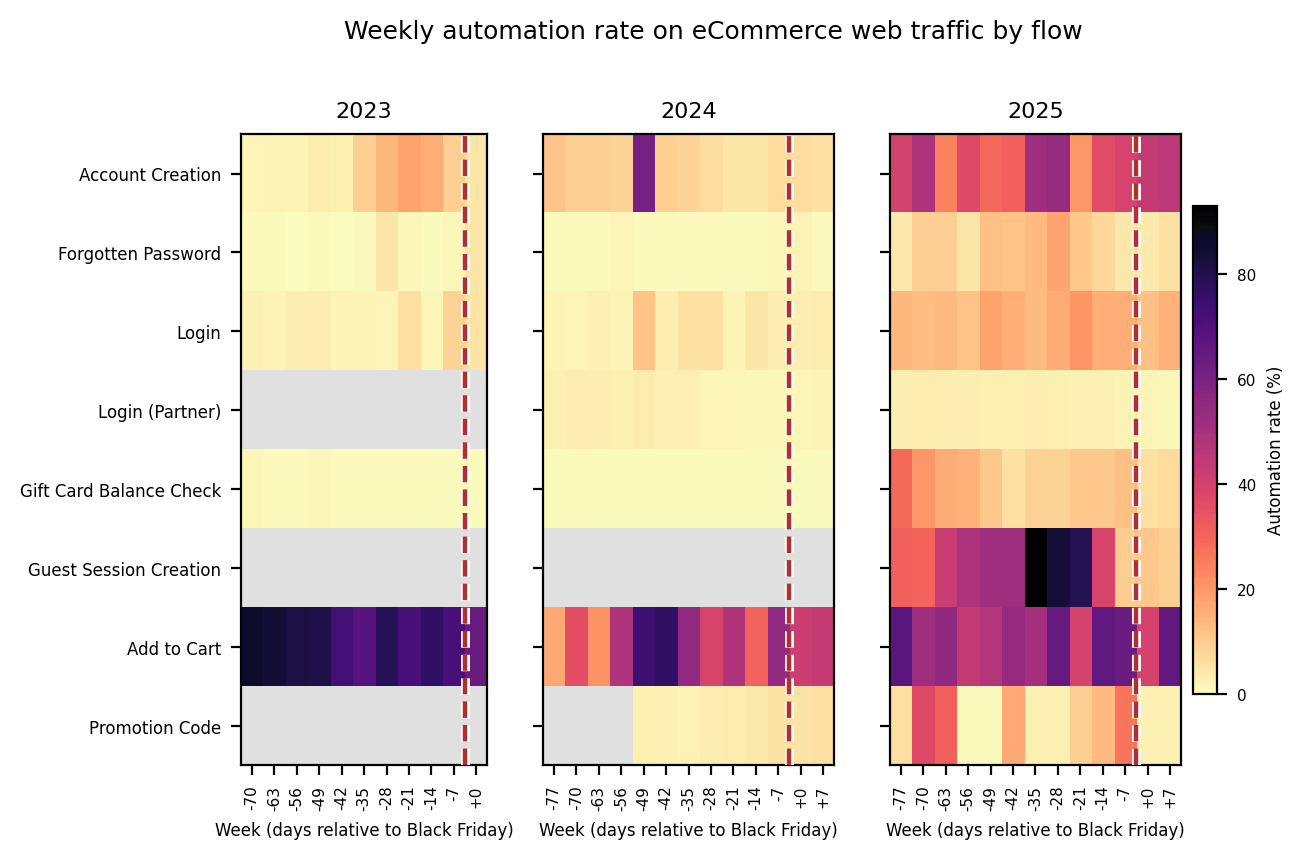
Ecommerce web automation spread across more flows than fashion. Adding items to a cart carried the highest automation rate throughout, at 75.7% in 2023, 51.7% in 2024, and 54.2% in 2025. Account creation rose in each season, from 8.3% to 15.3% and then 37.6%, respectively. Two other flows stayed flat and then jumped in the final season rather than climbing steadily. Login held at 3.9% in both 2023 and 2024, then reached 15.1% in 2025. Gift-card balance checking was 0.8% in 2023 and 0.6% in 2024, then rose to 11.4% in 2025.
These flows map onto familiar forms of abuse. Automation on the cart flow is most often associated with inventory hoarding, in which bots claim scarce or discounted stock before shoppers reach it. Automated account creation is most often associated with fake accounts opened to claim new-customer promotions, automated login with credential stuffing and the account takeover it enables, and automated gift-card balance checks with gift-card cracking, in which bots test numbers to find and drain stored value. That the sharpest increases fell on the account and gift-card flows suggests account-focused abuse was the part of this profile that grew.
The overall ecommerce web automation rate did not move in one direction across the three seasons: it was 41.5% in 2023, 19.4% in 2024, and 39.7% in 2025. Also, this group’s membership changed between seasons. We therefore cannot separate a change in who was measured from a genuine change in behavior. Figure 6 shows the same week-by-week breakdown for ecommerce web traffic.
QSR web, 2023 to 2025
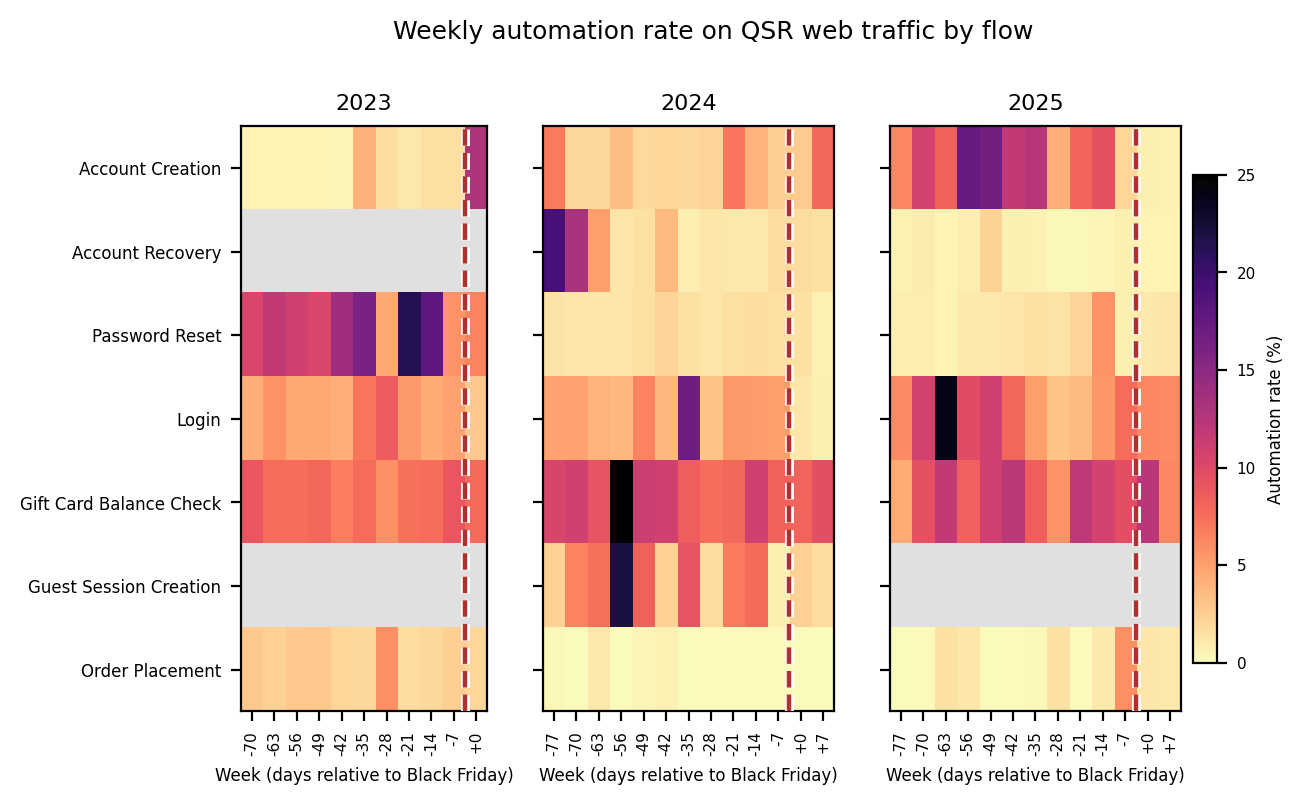
QSR web automation centered on the gift-card and account flows, consistent with loyalty programs and stored-value balances being the assets worth attacking. The automation rate on gift-card balance checking ran at 7.6% in 2023, 13.7% in 2024, and 10.1% in 2025. Account creation rose in each season, from 2.5% to 3.2% and then 8.8%. Login did not rise steadily: it was 4.8% in 2023, 3.8% in 2024, and 8.0% in 2025. The highest automation rate in this sub-industry was not on gift cards in 2023 but on password resets, at 11.4%, which fell to 1.5% in 2024 and stayed near that level at 1.6% in 2025.
Gift-card balance checking is most often targeted for gift-card cracking, account creation for fake account sign-up offer abuse, and login and password reset with credential stuffing and account takeover (loyalty balance theft). The rates were lower than in fashion or ecommerce, but the route from a compromised account to accessing stored value is short. Figure 7 shows the same week-by-week breakdown for QSR web traffic.
Mobile API: totals for 2023 to 2025, flow detail for 2024 and 2025
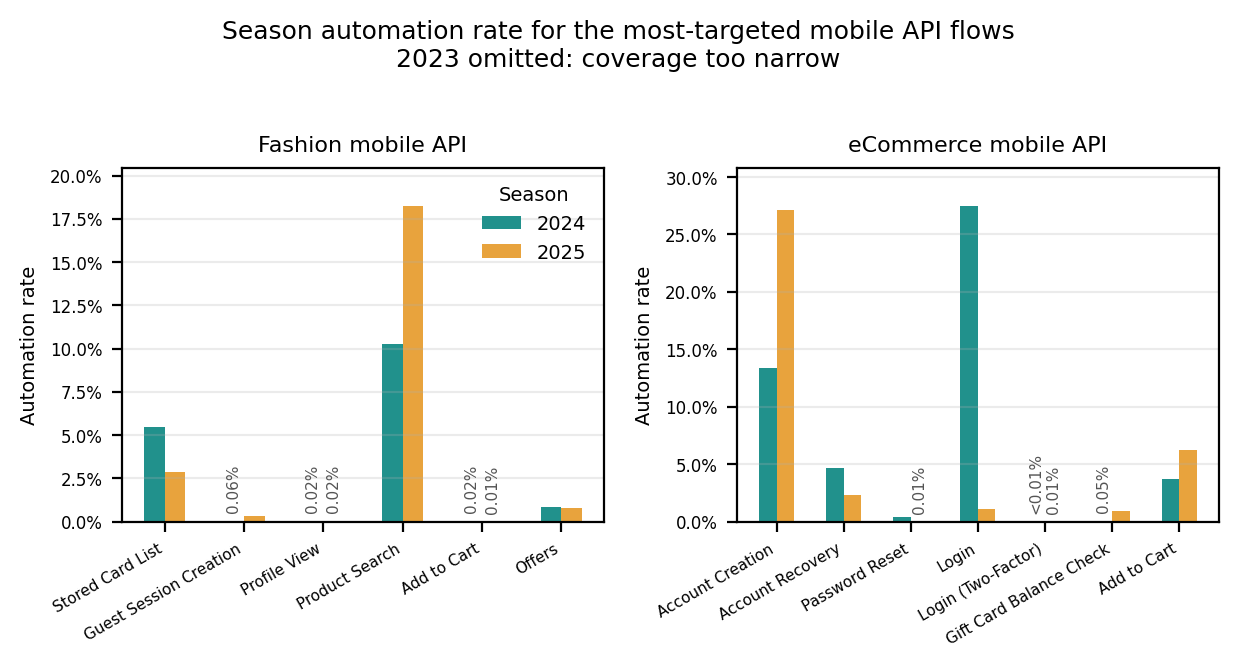
Mobile API automation rates stayed low, but they multiplied faster than web rates did because they started from a much smaller base: they went from 0.8% in 2023 to 2.3% in 2024 and 3.8% in 2025. Within the mobile API, the automation rate on ecommerce account creation rose from 13.4% in 2024 to 27.1% in 2025. In 2023 the mobile API data covered each sub-industry too narrowly to break down, so we report the total for that season but not its sub-industry breakdown; 2023 is therefore omitted from the mobile API sub-industry figures.7 Figure 8 compares the most-targeted mobile API flows for 2024 and 2025.
Mobile automation trends varied across seasons
A reasonable expectation is that automation against a given flow climbs steadily as Black Friday approaches. Across three seasons, the data does not support that as a general rule.
Fashion web product search illustrates the point. For each season we measured how much its daily automation rate changed per day over the six weeks before Black Friday. A positive figure means the rate was climbing as Black Friday approached; a negative figure means it was falling. The rate changed by -0.51 percentage points per day in 2023, +0.04 in 2024, and -0.14 in 2025. In other words, it fell toward Black Friday in 2023 and 2025 and rose slightly in 2024. This flow carried the highest automation rate in its sub-industry in every season, but it did not build toward Black Friday in a consistent direction.
Account-related and gift-card flows behaved the same way.8 We tracked 14 combinations of sub-industry and flow on web traffic with enough data to assess across all three seasons, such as product search on fashion web traffic. The mobile API is left out because its 2023 data was too narrow to describe a sub-industry. Of those 14, 13 switched between rising and falling in the weeks before Black Friday. The only one that moved in the same direction in all three seasons changed so slowly that it was effectively flat. We looked for a steady buildup and found that it was not there. The gift-card flows showed no consistent build either: on QSR web traffic the rate rose ahead of Black Friday in 2023 and 2025 but fell in 2024, and on ecommerce web traffic it rose clearly only in 2025.
Sophistication varied more by sub-industry and platform than by season
Sophistication here means how much effort a bot made to look like a real person. We group automated transactions into three levels, based on the reason each one was detected. Low sophistication covers bots that could not run the telemetry session tokens at all, which makes them straightforward to spot. Medium covers bots that tampered with or reused the telemetry session tokens a browser is expected to present. High covers bots identified through deployed threat intelligence packages, including those imitating human behavior in order to avoid detection. These broadly correspond to the basic, intermediate, and advanced levels defined in our 2025 Advanced Persistent Bots Report.9
One detection cause is excluded from this comparison: cases where the request was served a challenge response rather than being graded on the behavior of the client. It is heavily concentrated, accounting for 23.9% of automated transactions in 2023, 79.5% in 2024, and 41.3% in 2025, and in each season it came almost entirely from fashion web traffic at a very small number of retailers. Including it would have made fashion web appear predominantly medium sophistication due to active verification challenges (like CAPTCHAs or interstitial challenges) deployed on specific high-traffic pages, rather than because of anything the bots did. The mix below is therefore computed on the remaining automated transactions, and the excluded share is reported separately.10 Figure 9 shows the resulting mix for each sub-industry and platform across the three seasons.
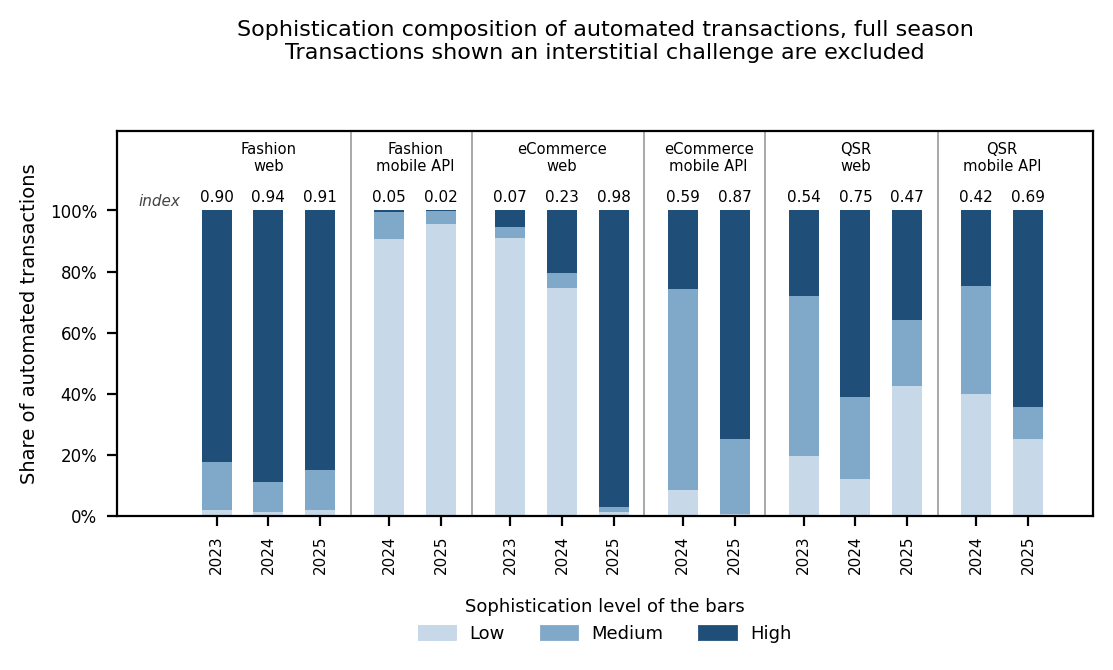
Different sub-industries moved in opposite directions. Ecommerce web moved toward high sophistication in each season: the proportion of its automated transactions rated high sophistication was 5.5% in 2023, 20.4% in 2024, and 97.0% in 2025. The fashion mobile API moved the other way, further toward low sophistication: the proportion rated low sophistication was 90.8% in 2024 and 95.6% in 2025.
The clearest comparison is the three web sub-industries, the only ones measured in all three seasons. To compare them we score each on a scale from 0 to 1, where 0 means every automated transaction was low sophistication and 1 means every one was high. Fashion web scored 0.90, 0.94, and 0.91 across the three seasons; QSR web scored 0.54, 0.75, and 0.47; ecommerce web scored 0.07, 0.23, and 0.98. Two of the three rose and then fell back between 2024 and 2025; only ecommerce web rose in both steps.
Sophistication therefore varied more by sub-industry and platform than by season. We see no sign of automation becoming generally more sophisticated across seasons.
Conclusions and what we expect in 2026
Three seasons of data support a small number of firm conclusions. We set those out first, then the questions the data cannot settle.
The automation rate ran higher in the weeks before Black Friday than on the day, in every season. In 2023 and 2024 the automation rate on Black Friday was held down by the rise in human shopping rather than by any reduction in automation, whereas in 2025 automated volume fell on the day as well. We expect the same pattern in 2026: a higher automation rate in the weeks before November than in the week from Black Friday onward, a visible dip in the rate on the day itself, and recovery within a few days. On Black Friday the rate fell while automated volume rose in 2023 and 2024, so a lower rate on the day did not indicate less automation.
Automation concentrated on web rather than the mobile API in all three seasons, though the gap narrowed as mobile API automation rates grew from a very low base. We expect web to remain the dominant target in 2026 among retailers whose web and mobile API protection are comparable. Three seasons is too short a record to treat the narrowing gap between web and mobile API automation as an established trend. The relationship also reverses where mobile API protection is much weaker, so the two platforms are best read separately.
Flow profiles remained recognizable within each sub-industry. Site design offers a plausible account of them, which we did not test, and in this group it is closely tied to sub-industry, because a retailer’s sub-industry largely sets which flows its site has. On that reading we expect these profiles to persist in 2026 for retailers whose site design does not change, and to shift where it does.
What should retailers expect in 2026?
Reading the three season outlines in Figure 4 against each other answers a practical question: does a sub-industry keep being attacked in the same places in every season? The answer is yes.
In every season each sub-industry was attacked on the flows its sites expose, and for fashion and ecommerce web traffic the same flow carried the highest rate every time. QSR web traffic moved around more between seasons, but it was still attacked on the same small set of account and gift-card flows throughout. Which of those flows came out on top in a given season matters less than it might appear, because the volume of automated traffic reflects pressure on a flow rather than a count of the people behind it: more bot traffic does not necessarily mean more attackers. Table 1 sets out, for each sub-industry and platform, the flow we expect to be targeted the most in 2026 and how much weight that expectation carries.
| Sub-industry and platform | Expected flow to be targeted the most in 2026 | 2025 automation rate | Sophistication to expect | Confidence |
|---|---|---|---|---|
| Fashion Web | Product search | 58.6% | High (85%) | High |
| Fashion Mobile API | Product search | 18.2% | Low (96%) | Low |
| Ecommerce Web | Add to cart | 54.2% | High (97%) | High |
| Ecommerce Mobile API | Account creation | 27.1% | High (75%) | Low |
| QSR Web | Gift card balance check | 10.1% | Low (43%) | Low |
Table 1. Expected most-targeted flow for 2026 by sub-industry and platform, with the sophistication level that accounted for the largest proportion of that combination's graded automation in 2025, shown with that proportion. Grading excludes transactions served a challenge response. Confidence is marked High where the same flow was the most targeted in all three seasons and Low where it was not.
That distinction matters for how far the results carry forward. Where the same flow leads in every season, last season is a reasonable guide to the next one, and the flows that have consistently carried the highest rates are the ones most likely to be targeted again. Where the leading flow changes between seasons, as in QSR, the previous season is a weak guide, and the account and gift-card flows are better read as a group than as any single flow within it. A stable leading flow is consistent with site design and user journey being the stronger influence; a changing one suggests that whoever runs the automation is still testing where the weaknesses are.
Table 1 selects each flow by its automation rate. Selecting instead by the number of automated transactions gives a different answer in three of the five combinations, because a flow can carry a modest rate on an enormous volume. In ecommerce web traffic, for example, guest session creation accounted for 85% of all automated transactions in 2025, and in QSR web traffic login accounted for 77%. The two measures answer different questions: the rate describes how much of a flow’s own traffic was automated, whereas the volume share describes how much of the automated load that flow carried.
The sophistication column carries a caution. The level shown is the one with the largest share in 2025, and it is stable only where the underlying target is stable. Graded fashion web automation, which excludes the challenge responses that made up most of it, was predominantly high sophistication in all three seasons, so we expect that to continue. Ecommerce web moved from predominantly low to predominantly high across the three seasons, so the high reading is recent rather than established. QSR web moved in the opposite direction between 2024 and 2025. Where the sophistication mix has been unstable, the most recent level is a poor guide on its own, and both simple and advanced automation appeared within the three seasons.
Mobile API expectations are less certain than the web ones. The 2023 mobile API data covered each sub-industry too narrowly to break down, so only 2024 and 2025 can be compared. Over those two seasons the fashion mobile API kept the same most-targeted flow while the ecommerce mobile API did not. Two seasons is too short a run to settle the question, so these rows carry less weight than the web ones. The QSR mobile API is left out of Table 1 altogether. No QSR mobile API flow exceeded 0.3% automation in any season and the sub-industry as a whole ran at 0.14% in 2025, which is why it is also absent from Figure 8.
Two things the data does not support are worth stating plainly. First, automation against individual flows did not build steadily toward Black Friday: nothing in these three seasons supports an expectation of the automation rate climbing as the day approaches, and automated volume behaved no more consistently over the six weeks before it, being broadly flat in 2023, rising in 2024, and in 2025 falling entirely within the first of those weeks before a change in recorded volume and then rising slightly. Second, sophistication did not rise in each season across sub-industries and platforms. Both varied by sub-industry and platform instead. We would rather report these absences plainly than present season-specific movement as a trend.
So what should a retailer take from three seasons of this? Not a date to defend. The automation rate was lower on Black Friday than in the quiet weeks before it in all three seasons, the busiest day for automated traffic landed 23 days before Black Friday in one season and the day after it in another, and no flow built toward the day in a consistent direction. Across the three seasons, what held steady instead was where automation went: web far more than the mobile API, and, within each sub-industry, the same small set of flows the site exposes. That is the thing worth watching, and it is in place long before the end of November.
About the author

Adeolu Ogunnoiki
Data Scientist | F5
Adeolu Ogunnoiki is a Data Scientist on F5’s Threat Analytics and Reporting team. He holds a bachelor’s degree with distinction in Computer Science, and a certificate of specialization in Data Science. His role includes creating and presenting customized threat briefings & reports, contributing to and writing articles, and creating tools to aid his data analysis.
More research by Adeolu Ogunnoiki