Introduction
Welcome to the 2021 Application Protection Report. Now in its fourth year, this is the latest installment in F5’s effort to summarize the application security risk landscape into perspectives and recommendations that put the initiative back into the hands of defenders.
The information security professional’s mission has gradually become extraordinarily complex. At times, this mission borders on contradiction. Quite often, responsibility for the various components that form an enterprise environment is spread not only among multiple teams within the enterprise but also among vendors, partners, and service providers. With this diffusion of responsibility comes added challenges in visibility and incident response. The threat intelligence that the industry consumes is nearly always tactical in nature and often lacks the context necessary to place new intelligence into a coherent picture alongside existing intelligence. Large epochal events, such as the UNC 2452 state-sponsored supply-chain attack campaign against SolarWinds systems, punctuate the landscape and take up our attention for long periods.
The result is that it can be extraordinarily difficult for a given defender to know what to prioritize. Of course, the answer is that “it depends,” but on what, precisely? How do the different determinants of that dependency interact over time, space, and variance across environments? We admit that we don’t have concise or definitive answers to these questions. What we do have is diverse and complementary data, paired with the experience and perspectives of industry veterans. With these in hand, we endeavor to provide a framework for everyone to prioritize their work, based on where they sit in the field of targets, which we all are to our adversaries.
As we’ve done for the last three years, this report begins with an analysis of several hundred data breaches that occurred in the United States in the previous year. However, this year we changed our methodology a little to look at these breaches as a series of attacker techniques, as opposed to a single event type, such as phishing.
The Attack Details section provides a detailed breakdown of several prominent attack types and how they are evolving, including various forms of access attacks, the predominant web attack against ecommerce organizations known as formjacking, cloud incidents, and API attacks. We explore the outcomes of these attacks in the “Impacts” section as well as the 2020 explosion in ransomware. Finally, we conclude with recommendations for controls based on the quantitative analyses throughout the report.
Executive Summary
- Ransomware grew enormously over 2020. In 2019, malware was responsible for roughly 6% of U.S. breaches. In 2020, ransomware alone was a factor in roughly 30% of U.S. breaches.
- Ransomware attacks are prevalent against targets with data that are difficult to monetize, suggesting that new popularity of ransomware among attackers is due to its monetization strategy, rather than its characteristics as malware.
- In 2018 and 2019, retail was by far the most heavily targeted sector. In 2020, four sectors—finance/insurance, education, health care, and professional/technical services—experienced a greater number of breaches than retail, partly driven by the growth in ransomware.
- Organizations that take payment cards are heavily targeted by web-injection attacks, known as formjacking. Formjacking accounted for more than half of breaches in the retail sector, but also targeted any organization that took payment information over the web, whether it was selling a product or only taking payments.
- Business email compromise (BEC) accounted for 27% of breaches. Many of these incidents lacked any other information but are suspected to be credential stuffing attacks.
- The Blackbaud cloud ransomware breach caused hundreds of organizations to mail out breach notifications, illustrating that the risk of supply-chain attacks is not limited to network infrastructure like SolarWinds.17
- Essentially all cloud incidents and breaches about which we have information were attributable to misconfiguration; the inconsistency of responsibility boundaries in cloud systems makes the chances of misconfiguration unacceptably high.
- Two-thirds of API incidents in 2020 were attributable to either no authentication, no authorization, or failed authentication and authorization.
- The simplicity of API attacks and the poor state of API security indicate that the attack surface ramifications of API-first architectures are still not widely understood.
- Analyzing breaches as attack chains illustrates the importance of an overarching security strategy that implements defense in depth and a coordinated security architecture (as opposed to a series of unrelated point controls).
- Based on the breach analyses, the most important controls for dealing with the threat landscape are privileged account management, network segmentation, restricting web-based content, data backup, and exploit protection (in the form of a web application firewall [WAF]).
- The nature of cloud and API incidents in 2020 also illustrates the importance of inventory, configuration management, and change control.
2020 Data Breach Analysis
One of our most illuminative sources for data comes from a surprisingly simple and obvious source. Starting in 2018, we began harvesting public breach notification letters from U.S. state attorneys general. Individually, these letters often lack important details about tactics, techniques, and procedures (TTPs). Figure 1 shows a sample breach notification from this year. Note the details about remote desktop protocol, the strain of ransomware, and using stolen credentials to attack the VPN. This was actually the single most detailed breach notification of 2020. While we wish they were all this good, many contain information only about the impact (such as email compromise), and some contain no useable information at all. Collectively, however, they still represent a useful data source, for several reasons. All of these notifications represent events in which the defenders knew, or had to assume, that the attackers gained access to sensitive information. In other words, these were successful attacks, not just exploits of a vulnerability with an unknown impact. This makes these incidents particularly instructive because we know the impact; these are the events that result in losses for companies.
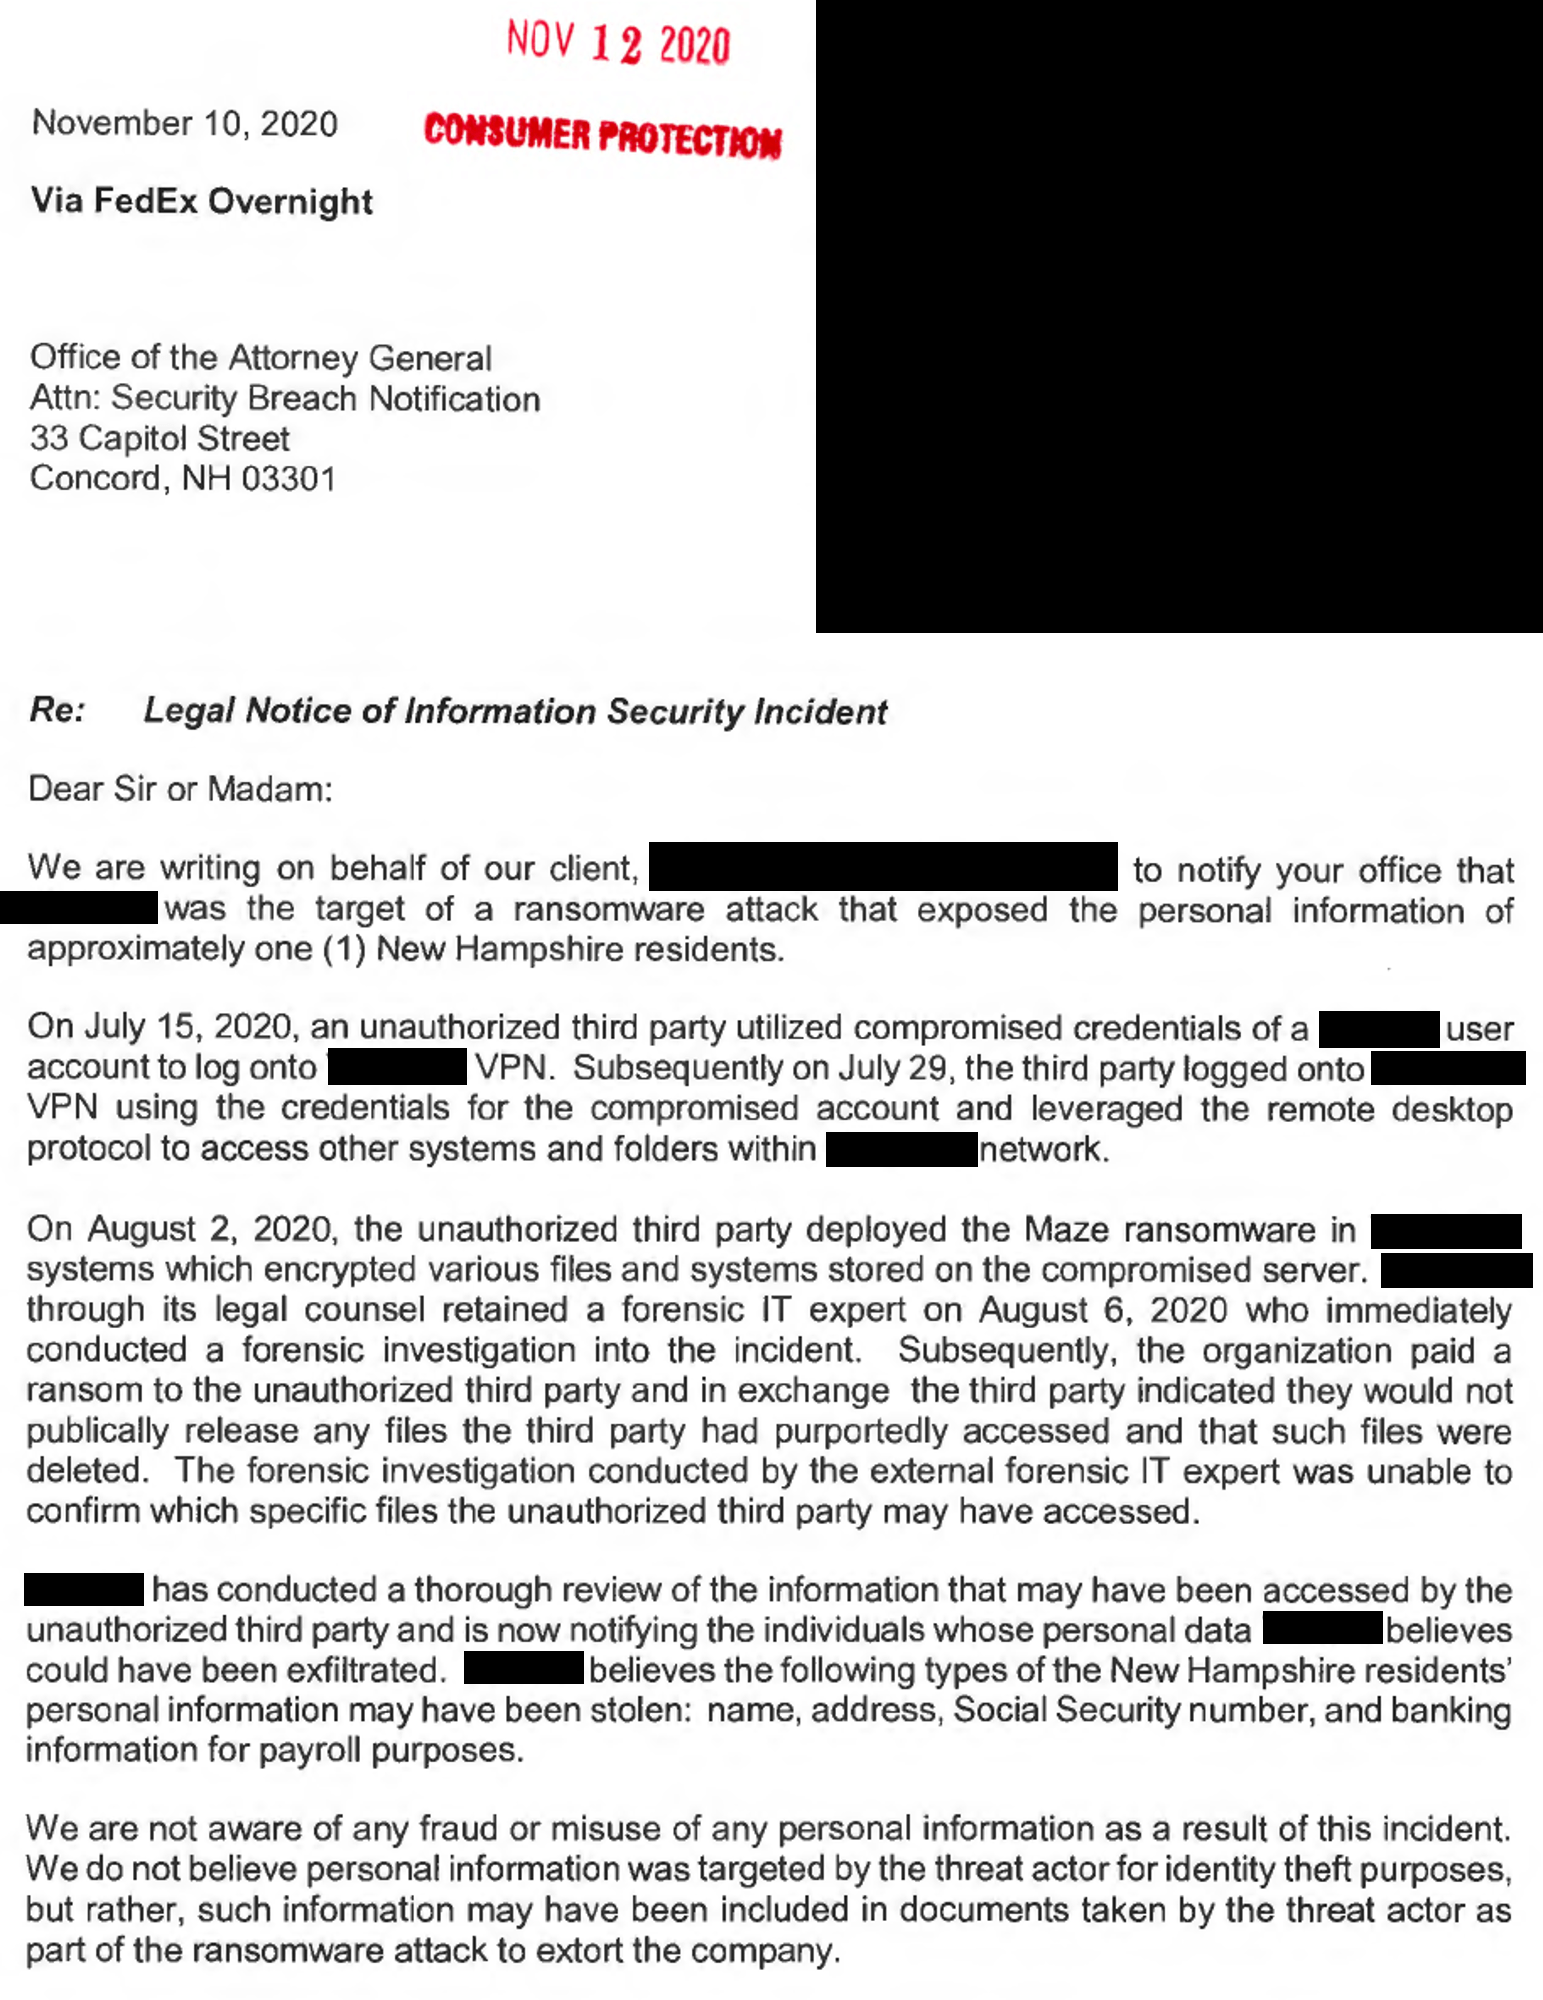
Figure 1. An example data breach notification letter, including details about the use of compromised VPN credentials, remote desktop protocol, and Maze ransomware.
Another strength about this data set is the nature of the sampling. Because we gathered these notifications at the state level, they are less likely to reflect any kind of bias in terms of target or vector, and provide some degree of random sampling with respect to target organizations and technology stacks.
Finally, in aggregate, these notifications also offer us a decent, if not amazing, sample size. We do not, unfortunately, have access to the tens of thousands of detailed incident reports that some in our field have, but the breach notifications provide a large enough sample that we can draw some meaningful conclusions and make some recommendations based on the information they contain. In 2019, we analyzed 762 distinct breaches from 2018; in 2020 we analyzed 1,025 distinct incidents from 2019. This year, due to external constraints that cut short our research time, we captured information for 729 incidents from 2020, primarily from the states of California and New Hampshire. These two states have comparatively strong reporting requirements and therefore some of the larger sets of breach notifications.
Methodology
This year, we changed our analysis methodology. In the past, we relied on an internally-developed model for application risk assessment that focused on growing complexity of modern applications, and the effect this complexity has on attack vectors. However, this year we decided to change the model, for two reasons. We wanted the ability to capture and re-create breaches as attack chains instead of as single-point failures. This is partly due to the surge in malware, specifically ransomware (discussed later), because malware is increasingly important but always relies on some kind of delivery vector. Capturing and communicating the reality of what we saw demanded a different model.
The other reason we changed models was to make it easier for us to communicate findings with other researchers and security operators using a shared lexicon. F5 Labs often laments the lack of cooperation and transparency in our field, so to put our money where our mouth is, we structured our work to be more immediately digestible by our peers.
The upshot was that we settled on the MITRE ATT&CK® framework.1 The ATT&CK framework can be bewildering at first and requires some familiarity before it can become useful, but what it lacks in intuitiveness it makes up for with rigor. It is the model that does the best job of expressing how procedures ladder up to techniques, techniques to tactics, and tactics to goals.2 This taxonomy between what an attacker is trying to accomplish (tactic) and how they accomplish it (technique) is important for taking advantage of ATT&CK’s strengths, and this distinction will feature prominently in our attack chain analysis.
Also of note is that, for this year’s report, we shifted our sector model to match the U.S. Census Bureau’s North American Industry Classification System (NAICS).3 While this made it more difficult to compare trends with the previous years, it minimized judgment calls on our part in terms of how to categorize organizations.
Initial Findings
Before we launch into the attack chain analysis, let’s review some of the basic contours of the breach data we collected. Twenty-seven percent of the incidents we looked at involved some kind of BEC. Most of the time, the notification contained little additional information about these events, so all we know is that email is a big target—not how it’s being targeted. Phishing was less frequent than in the 2019 breaches, at 8% of incidents. Sixteen percent of incidents involved a web exploit, and 24% involved data loss by a third party (almost all of which came from one incident—more on that later). Interestingly, ransomware events shot up to 31% of incidents, up from 6% for all malware in 2019. This is a huge change in a short period of time. The explosion of ransomware in 2020, as shown in Figure 2, is discussed later in this report.
Cloud events were quite common, but not necessarily because a lot of cloud breaches occurred. In reality, of the 729 events we looked at in the data set, only 11 were cloud breaches, but several of them were third-party breaches, which generated a large number of notifications. Finally, mobile breaches were quite rare in our data; only one incident we looked at was a mobile breach (0.1% of total).
We also captured the breach causes using the previous application tiers model so that we could compare findings with previous years (see Figure 3). Here we started to see a transformation in terms of attacker techniques. Between 2006 and 2017, web exploits were the predominant cause of data breaches, followed by access breaches (credential stuffing, brute force, phishing, and other social engineering). From 2018 to 2019, access breaches were by far the most prevalent breach cause we encountered, and web exploits became less common. By 2020, access breaches remained the most prevalent, at 34%, but were less dominant than in the previous two years. Web exploits constituted roughly the same proportion of known breach causes, but both malware events and third-party compromises exploded in frequency. In fact, the vast majority of third-party compromises in this data set came from a single ransomware event at Blackbaud, a third-party cloud-storage provider, which resulted in all of its customers sending out notifications to all of their customers. In other words, between the third-party ransomware and the regular kind, ransomware went from being a relatively uncommon tactic to the single most common type of event in one year, at 30% of incidents. Of course, the ransomware needs to be deployed inside an environment, which raises questions about how it got there in the first place. We explore this further in the “Attack Chain Analysis” section.
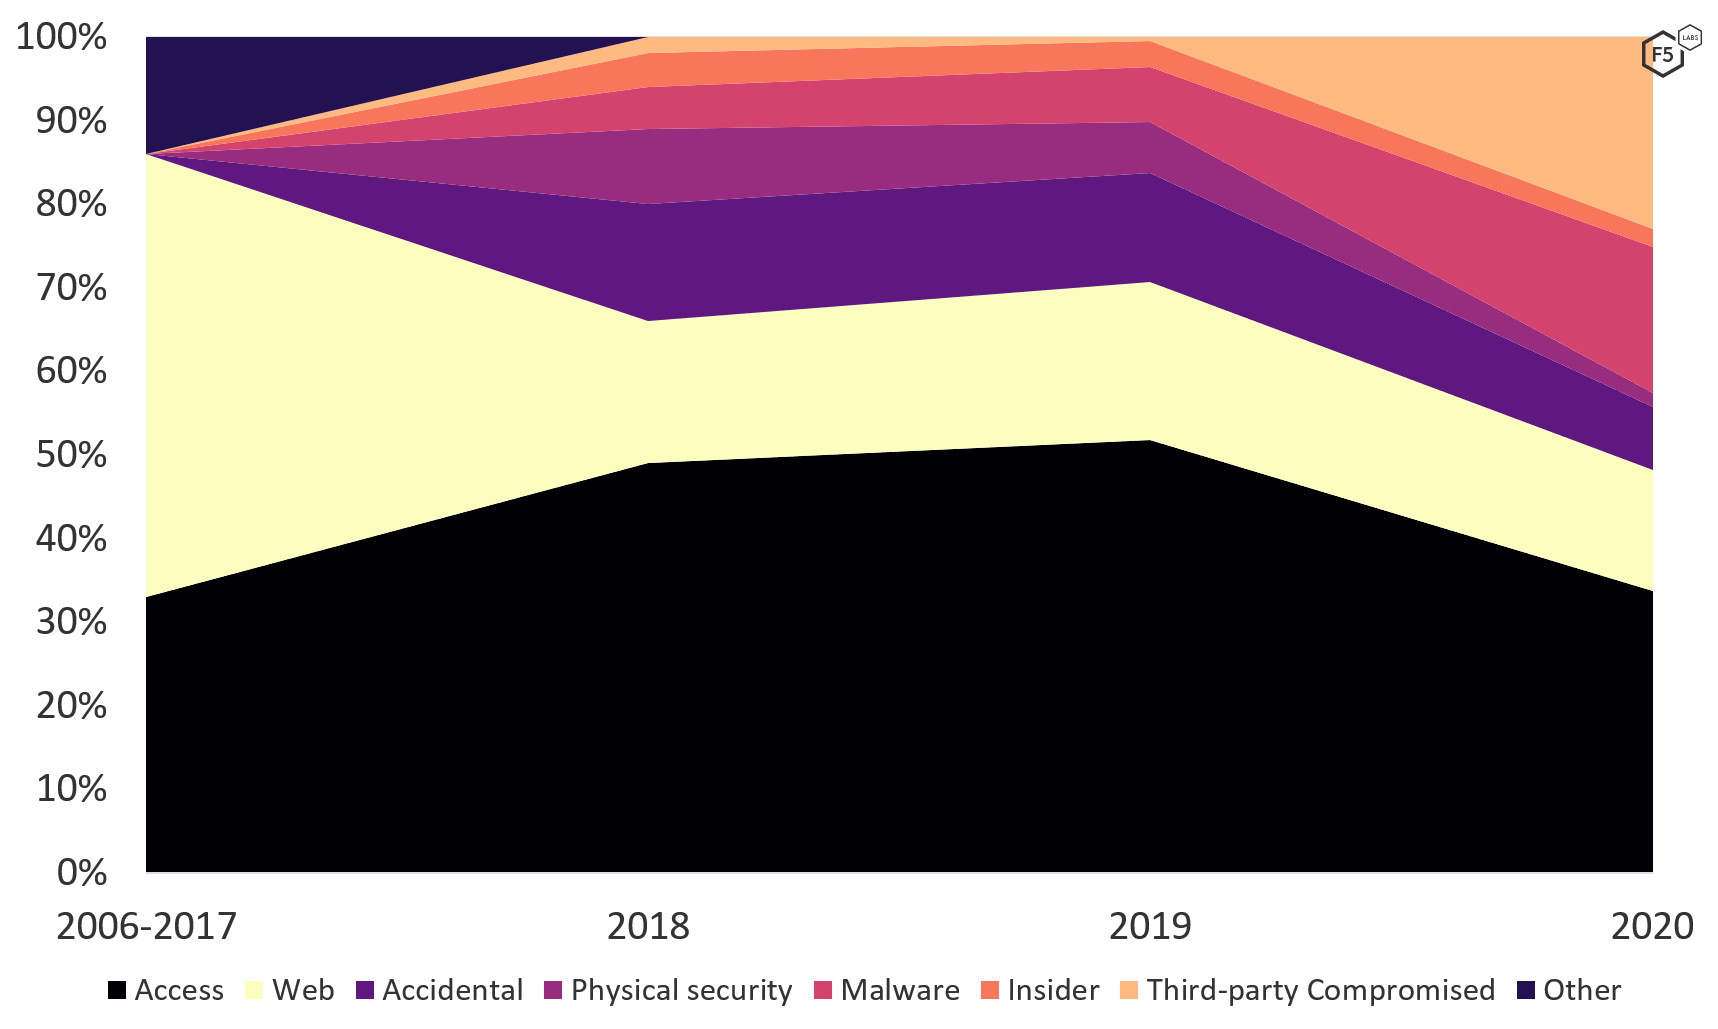
Figure 3. Data breaches by cause, 2006-2020 (unknowns removed). In 2020, ransomware surged into the most prominent single-point breach cause.
Findings by Sector
Sector analyses are a standard in the cybersecurity community. Over the last several years, however, we have gradually come to the position that sectors are no longer a good predictor of information risk, except where they map tightly to regulatory risk, as in the case of the Payment Card Industry Data Security Standard (PCI DSS). The 2020 Application Protection Report, as well as research from other organizations, has demonstrated that what attackers care about is target parameters, that is, the kind of system running and the kind of data stored on that system. At one time, sectors may have been a good predictor of these target parameters, but as digital transformation drives enterprise environments to look similar, and simultaneously, more organizations that might have considered themselves manufacturers or wholesale merchants look to implement ecommerce platforms and sell direct to consumers, this is no longer the case. This is the basis for our growing sense that that if you act like retail, you’ll get attacked like retail.
Nevertheless, it is still valuable to look at sectors when we analyze data breaches, both to look for new patterns and to observe changes in patterns we already understand. Sometimes, transformations in old patterns—such as the prevalence of web exploits against ecommerce platforms—can indicate changes in tech stacks or architectural trends that we might not otherwise detect.
As noted in the “Methodology” section, we changed our model for sectors this year, so comparing with previous years isn’t straightforward. It is clear, however, that a transformation has occurred in terms of attacker targeting, as shown in Figure 4. From 2018 to 2019, the retail sector was by far the most heavily targeted sector, constituting more than 60% of the breaches in 2019 and just under 50% in 2018. In 2020, three sectors that had historically experienced a lot of breaches—finance and insurance, educational services, and health care and social assistance—were hit harder than retail, as was the sector that represents a bit of a hodgepodge, professional, scientific, and technical services. This sector includes law firms, accountants, and consultants of all stripes as well as a range of other organizations, such as technical services for heavy industry, that we might not instinctively lump together.
The growth in breaches in these sectors became a little clearer when we examined the causes of breaches by sector (see Figure 5).4 The three most prevalent sectors all had a significant number of notifications that were actually breaches of third-party vendors, and the vast majority of the notifications that fit this category all boiled down to that same single Blackbaud ransomware event. In contrast, the large number of ransomware attacks represented in the malware category were more or less evenly distributed across sectors. The implication here is that the Blackbaud event that made up the huge number of third-party data breach notifications was masking the fact that ransomware had become a risk to essentially any organization. We’ll discuss the impact of ransomware and what this trend represents in greater detail in the “Ransomware Comes of Age” section.
Looking past the third-party ransomware notifications and the explosive growth in ransomware, the pattern that emerged over the last two years has morphed slightly. In 2018, data breaches bifurcated into two clusters of correlated targets and vectors: in one cluster, any organization that participated in ecommerce operations and took payment cards over the Internet, irrespective of declared sector, was subject to a specific subtype of web-injection attack known as formjacking. The other pattern we observed was that nearly all non-ecommerce organizations were targeted primarily with access attacks, particularly credential stuffing and phishing. This pattern reflects the fact that the most valuable information for non-ecommerce organizations isn’t constantly traversing the perimeter but sits either in hardened databases or in decidedly unhardened email inboxes.
This bifurcation of breaches into two modes, determined by the kind of data the target has rather than by industry, became even clearer in 2019. The massively successful campaign in 2019 against the specialized university ecommerce platform PrismRBS exemplified the trend, as at least 201 universities had customer payment cards compromised in this way.5 In fact, in 2019, 82% of the breaches in the retail sector came from web exploits, and 87% of those web exploits were formjacking attacks. At the same time, subsectors like accounting and law firms were disproportionately targeted through access attacks.
For breaches in 2020, this bifurcation still holds, but with some modifications and caveats. The first is that formjacking attacks have continued to spread to include other niches that take payment cards. The best example of this was the trend of professional organizations and trade unions being hit with formjacking in their membership renewal systems which, predictably, accept payment cards. This niche is represented in the number of web exploits represented in the Other Services sector. At the same time, the retail industry was less exclusively targeted by formjacking compared with previous years. Access attacks and ransomware also hit the retail sector.
A heavily exploited vulnerability was seen in an e-learning platform, the Aeries Student Information System, that contributed to a large number of web breaches in the education sector, mostly from California secondary schools. This campaign, which contradicts the overall trend of web exploits targeting financial information, illustrates the importance of vulnerability management and software testing across the board—no matter how strong a targeting pattern might seem, if we present easy targets, they will be attacked sooner rather than later.
Overall, it appears that access breaches constitute a smaller proportion of the breach landscape than they have in the past, but this is partly so only because of the limitations of reducing a breach to a single event such as ransomware; the small amount of information about any given attack adds uncertainty as well. To understand how the growth in ransomware tactics relates to existing entrenched tactics, we have to understand attacks as a sequence of steps and not as single-point events.
Attack Chain Analysis
As noted in the “Methodology” section, in re-creating the attack chains based on information from the breach disclosures, we had to adapt the ATT&CK methodology a bit (see Figure 6). We expanded the model, adding nontechnical events like misconfigurations, physical theft, and third-party data loss to capture the full spectrum of what came from the disclosures.
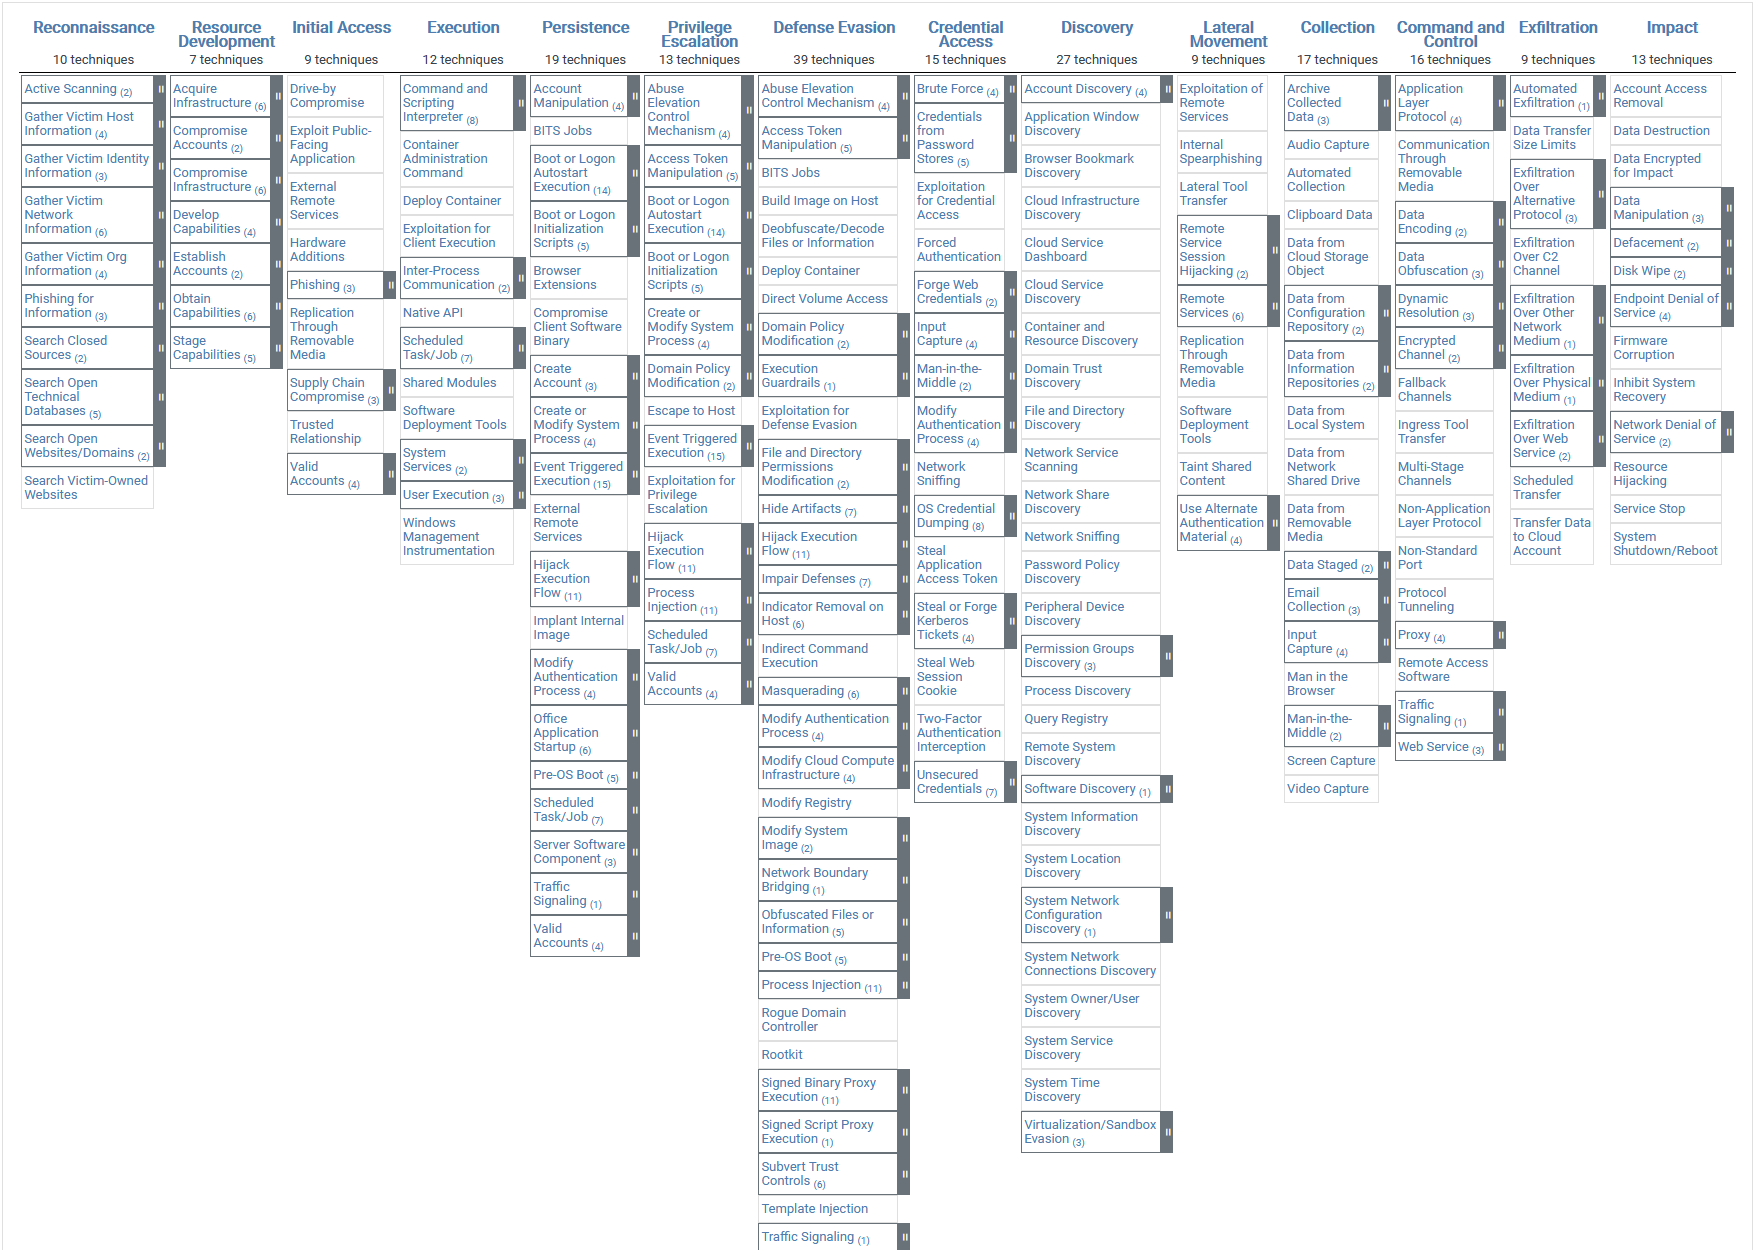
Figure 6. The (unmodified) ATT&CK framework. The categories across the top are tactics, the entries in the columns are techniques to achieve those tactics.
We also had to leave specific stages empty when we knew that an attacker had accomplished a tactic (such as initial access or credential access) but didn’t know what the subordinate technique was. Finally, for some events we only had information for one or two stages in the attack chain. In these cases, we mapped the flow of tactics to the End of the chain, even though there were probably other actions that either the forensic analysts couldn’t re-create or the organizations didn’t reveal.
These compromises mean that our model was not as strong as the core ATT&CK framework for tracing a single event from start to finish, but in return we gained the ability to map the entire breach landscape in a single form, as shown in Figure 7.
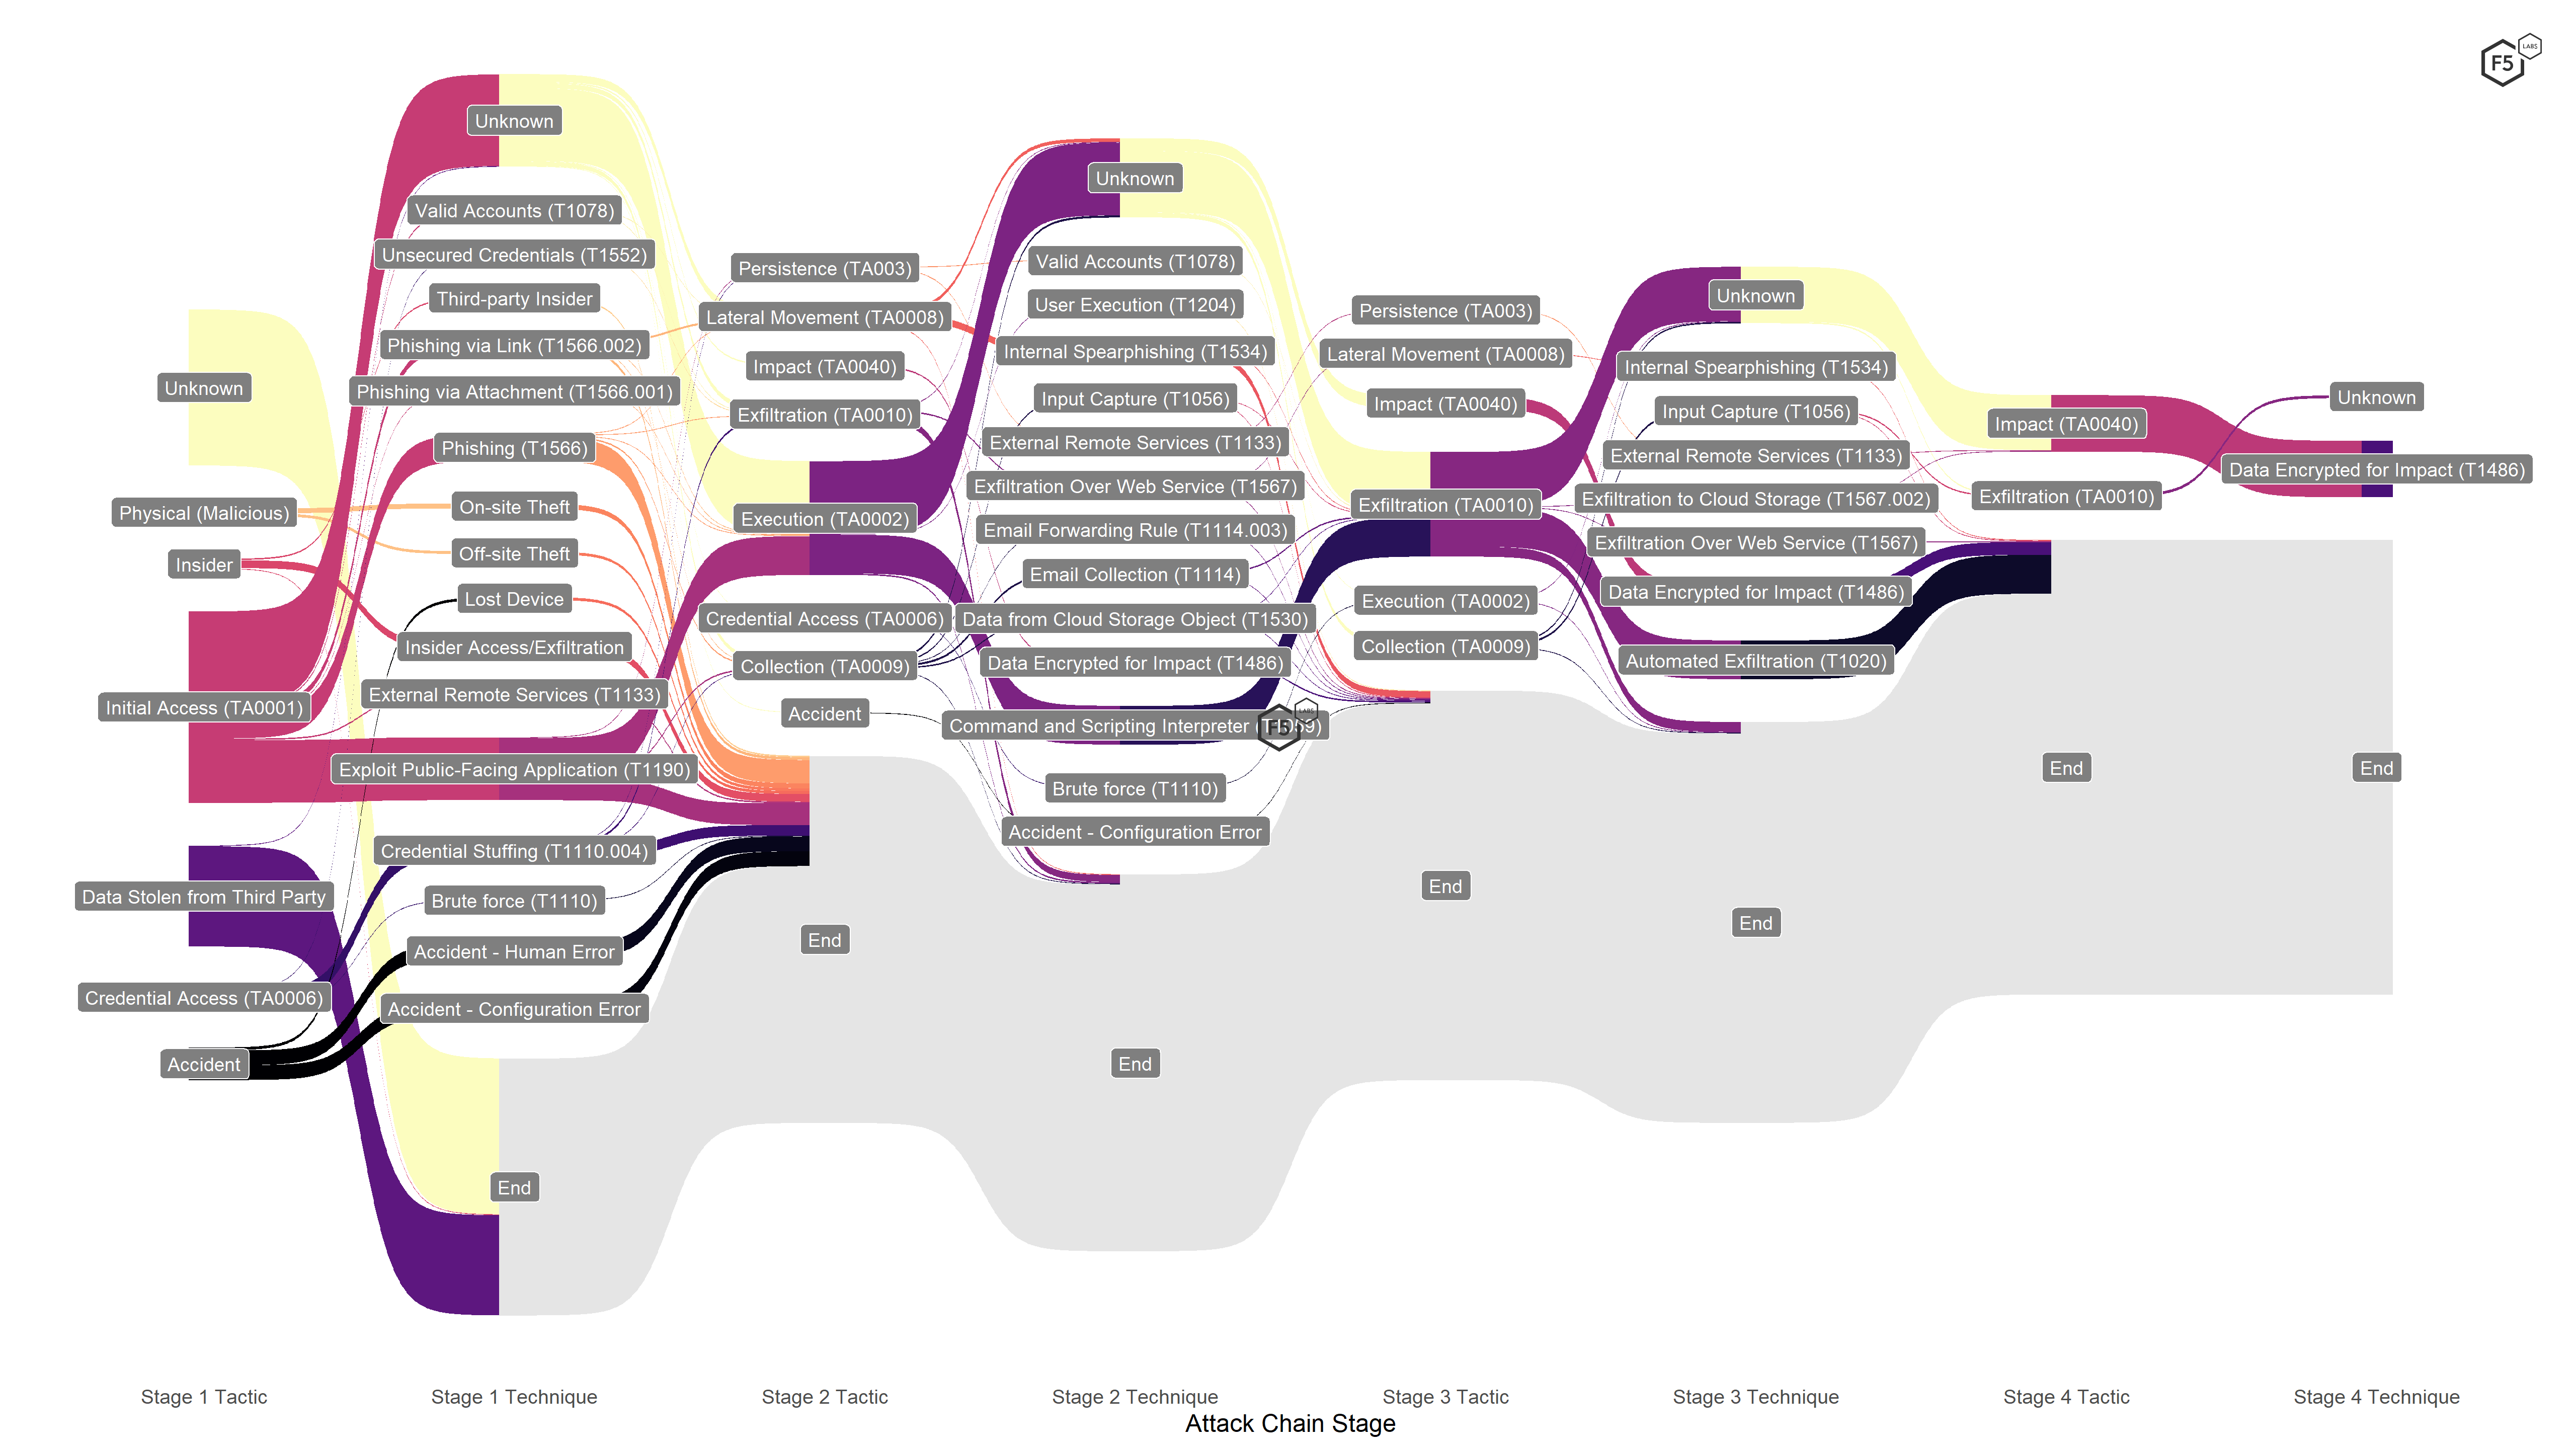
Figure 7. Attack chain visualization for the entire data set.
Note the large number of events that start with Unknown or terminate in End. At this level, it was difficult to draw significant conclusions from the visualization unless we pared some noise back. The most obvious thing we could conclude from this view was that the breach notifications often lacked substantive information. We already knew that, but visualizing the volume of events that either terminated for lack of information or had unknown techniques connecting tactics (such as between Initial Access and Execution) also showed how much further we can go as an industry in terms of sharing information in a way that might not be harmful to the victim but still be helpful to other defenders.
There were also 142 events whose primary cause was Data Stolen from Third Party, after which the attack chain terminated. These entries signify events in which the platform housing the data and associated controls was under the control of a vendor, but the data was still the responsibility of the entity doing the notifying. Out of the 142 events like this, 117 were associated with the Blackbaud ransomware event, which we explore in the “Blackbaud” sidebar. The remainder of third-party data-loss events in our data set came from a compromise of Equifax’s PaperlessPay payroll outsourcing solution, a number of outsourced storage solutions, and one event in which a vendor had an insider breach, with an employee exfiltrating sensitive information about its customers’ customers.
The point of this report, of course, is to understand the risk landscape around web applications in particular, though, so if we filter out attack chains that are unknown from start to finish, the third-party events, and those that have nothing to do with applications (that is, Accidents, Physical breaches, and Insiders), we get a subset of data about application-specific attacks, as shown in Figure 8. With this focused view, we can pick out the recurring tactics and techniques for each stage.
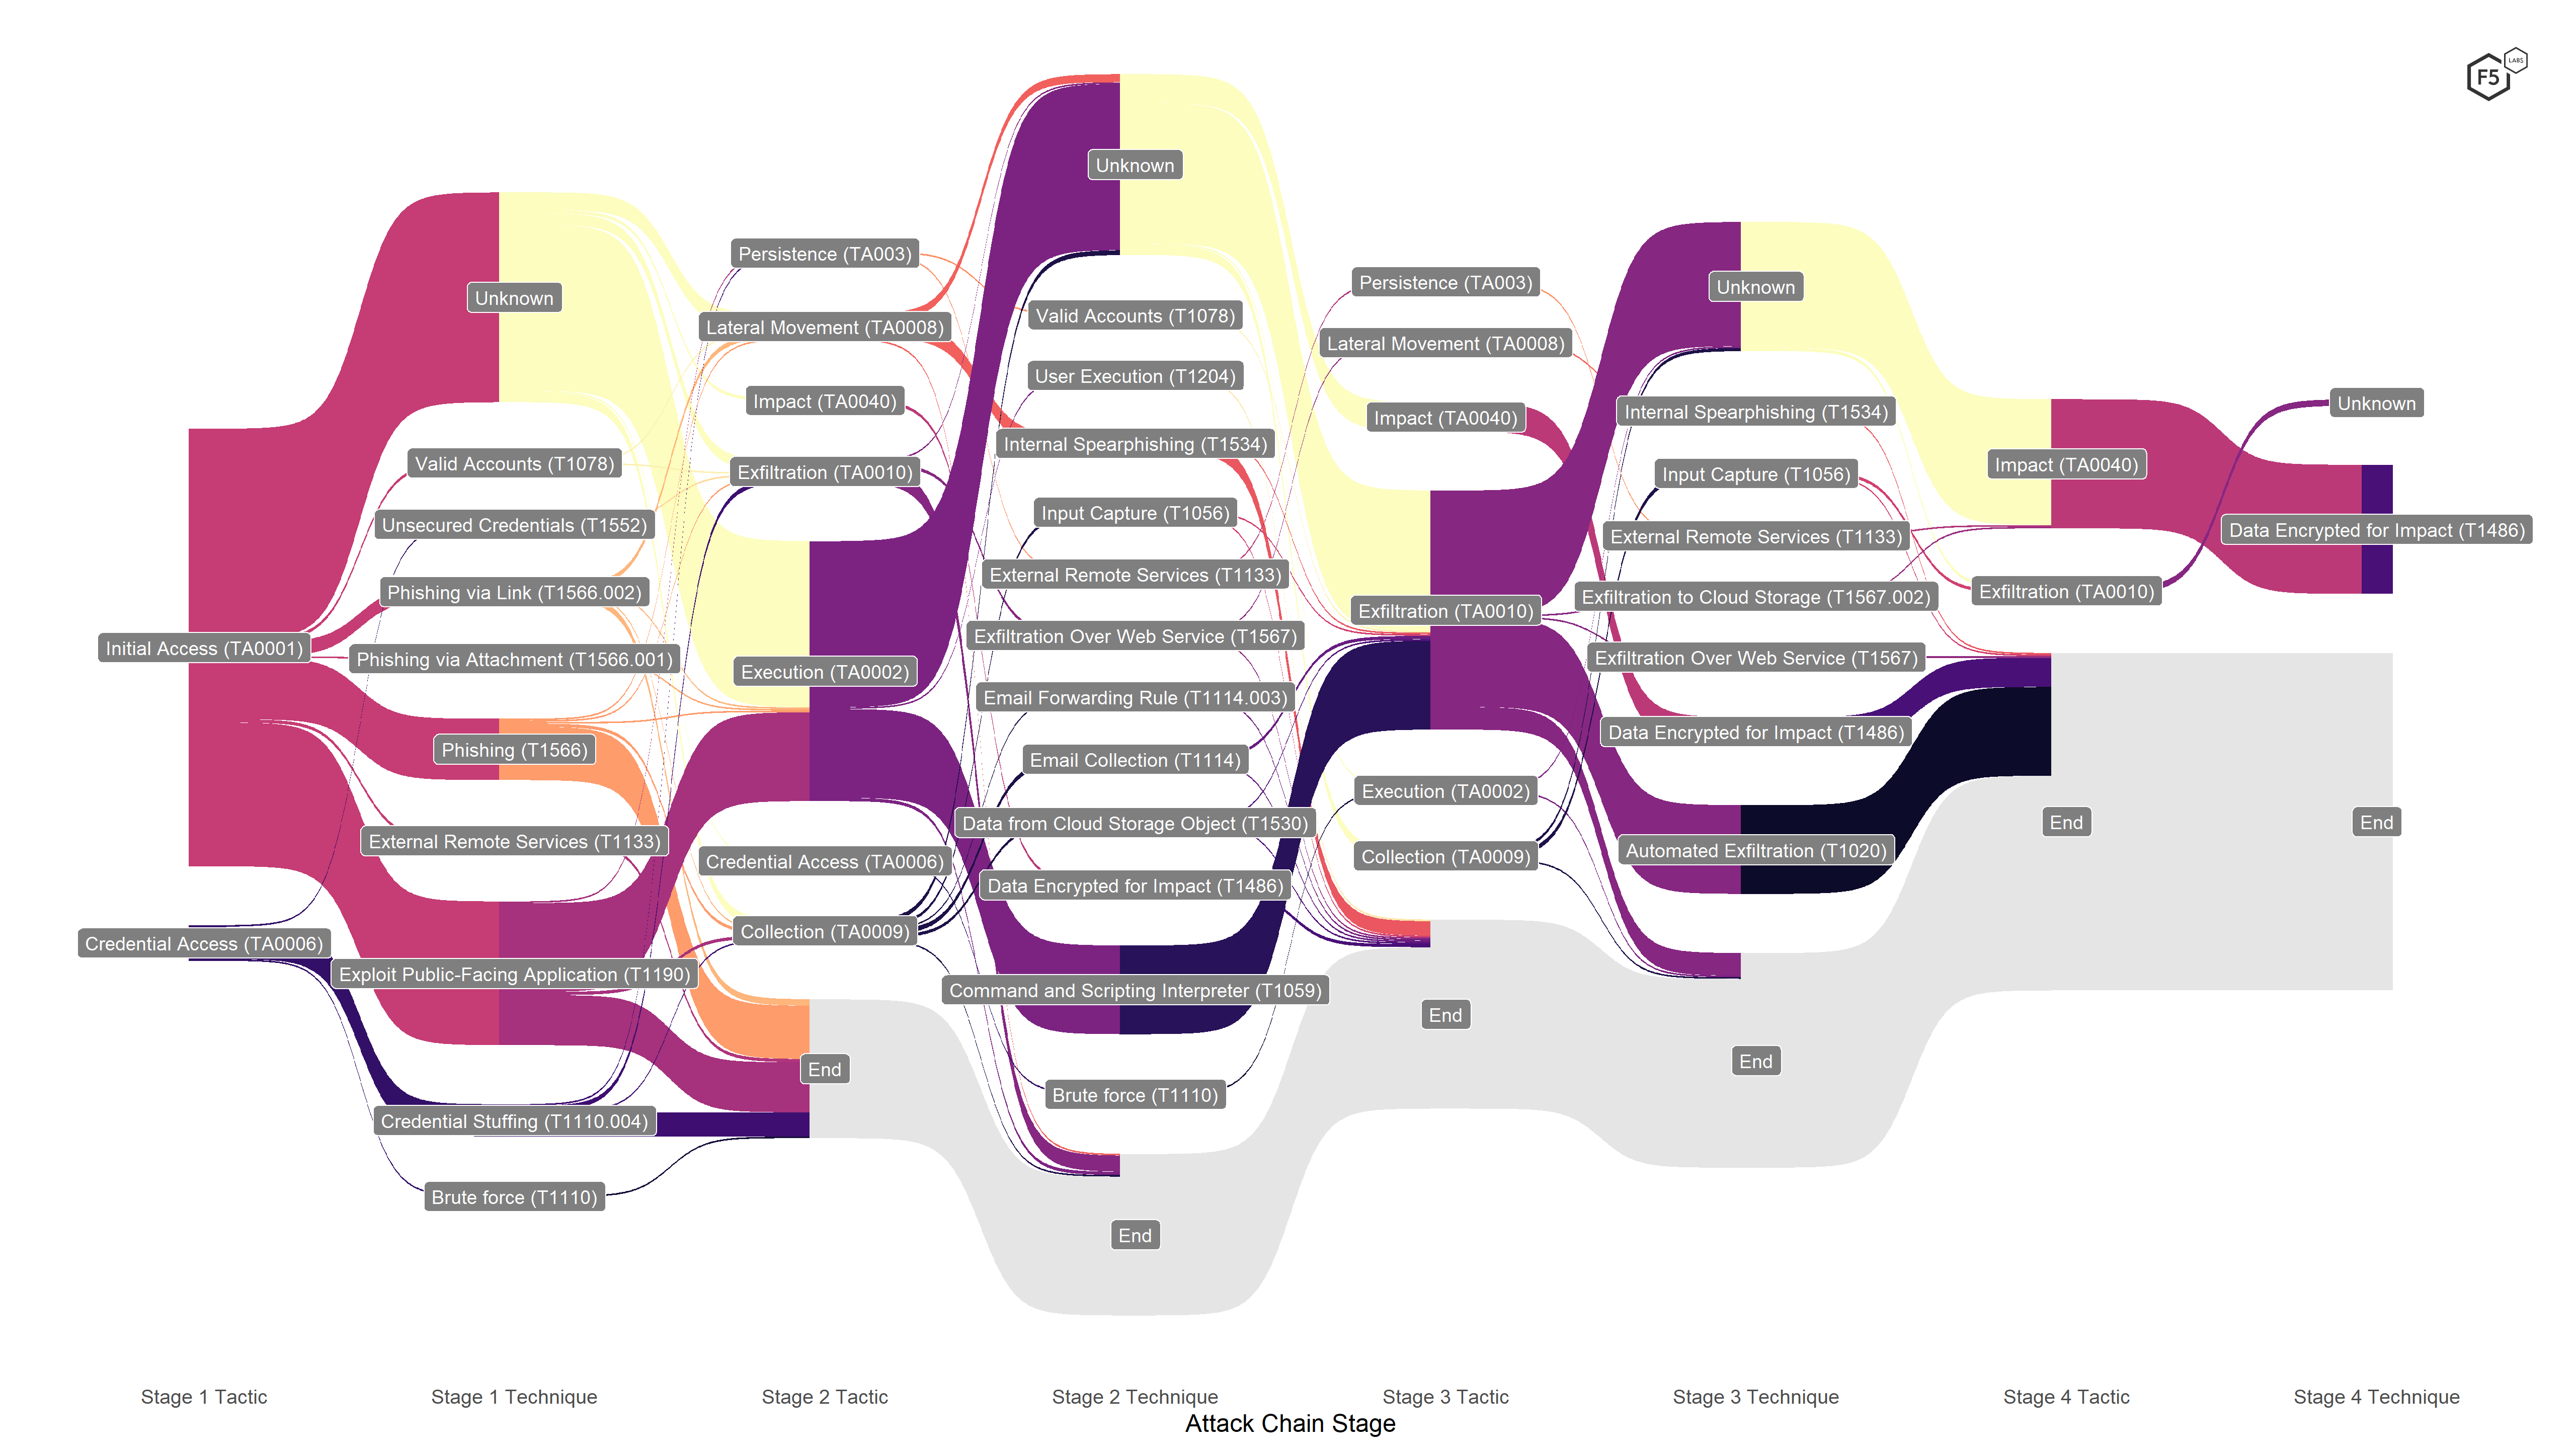
Figure 8. Focused attack chain visualization showing only attacks against applications. With this view, it becomes possible to pick out tactics and techniques that occur often, such as executing scripts or malware, encrypting data (that is, ransomware), and phishing.
Stage 1 Analysis
Looking at the first stage of the application attacks, we noticed that the vast majority of successful breaches started with some kind of initial access to the environment, which is rather obvious. We knew that a small number of events began with credential stuffing, brute force attacks, or unsecured credentials (7.8% of the application attack subset), but the remaining 271 began with some form of intrusion into the environment. Of the attacks that began with this tactic, the largest subset employed an unknown technique, but the most prominent known stage 1 technique was web exploits, almost all of which were either formjacking attacks against retail and retail-like organizations or compromises of the Aeries Student Information System. Roughly 30% of the application attacks we examined exploited a web vulnerability. After that, phishing was the most prominent stage 1 technique, figuring in 16% of all application attacks, between undifferentiated phishing, phishing with a link, and phishing with an attachment. We also found that internal spear phishing was a prominent technique for lateral movement in later stages of attacks but was not common in earlier stages.
We should note at this stage that, based on what we know about the frequency of credential stuffing, a handful of techniques were used here, such as valid accounts, access to external remote services, and the large proportion of unknown initial-access techniques, which we suspect are undetected credential stuffing attacks. Between the constraints of the ATT&CK framework and the limited information available to us to reconstruct these attacks, defenders should use these numbers to scope attacks in but probably not to scope common attacks out. On that basis, we are inclined to say that credential stuffing was probably underrepresented in this analysis. We explore credential stuffing techniques, along with other authentication attacks, in the “Attack Details” section.
Stage 2 Analysis
Among the attacks that we could reconstruct, stage 2 tactics were dominated by the Execution tactic, either to run malicious scripts that had been injected into web applications (after successfully exploiting a web vulnerability in the previous stage) or to execute malware, almost all of which was ransomware, as mentioned earlier. In a handful of cases, we knew that the ransomware was inadvertently executed by a user after a successful phishing attack, but in the vast majority of ransomware cases, we didn’t know how (or when) the ransomware was triggered.
A handful of other tactics showed up a few times—data collection through input capture or email forwarding, for instance, and exfiltration using existing web services. In 16 instances (5.5% of application attacks), attackers attempted to move laterally using internal spear phishing.
The large number of formjacking attacks that accomplished initial access in stage 1 using web exploits went on to execute their injected scripts by using command and scripting interpreters. We explore formjacking attacks in greater detail in the “Attack Details” section.
Stage 3 Analysis
Stage 3 tactics were dominated by a single goal: exfiltrating data. After gaining initial access and executing in the prior stages, the vast majority of ransomware attacks exfiltrated data in this stage prior to encrypting data in stage 4. We also noted many notifications that could neither confirm nor deny that exfiltration had occurred in ransomware events, and so sent out notifications on the assumption that it had. Most formjacking attacks began automated exfiltration at this stage, moving payment card information collected by malicious scripts out of the victim environment and onto a drop server under the attacker’s control. Some attacks used this stage for collecting data using external remote services and input capture; there was one instance of lateral movement through spear phishing again.
Stage 4 Analysis
Most of the events we captured didn’t provide enough information to reconstruct a fourth attack stage, but for those that did, almost all were ransomware events in which attackers triggering the encryption after exfiltrating information . This reflects a growing tendency among attackers to try to ensure victim compliance by posting small amounts of sensitive information to the dark web for greater leverage.
Other than the ransomware events, stage 4 tactics and techniques included a small number of events with alternate attack chains: a handful in which the exfiltration occurred prior to encryption, and another handful in which other techniques from stage 3, such as lateral movement through remote services, culminated in exfiltration.
Tactic and Technique Frequency Analysis
One of the features of the ATT&CK model that makes it so useful is that it helps to analyze cyberattacks not only in terms of how attackers work but why they work the way they do at any given time. In other words, it helps us differentiate objectives and means, which can be challenging in cybersecurity.
When we look at attacker tactics or their objectives, it is clear that, at least based on this partially complete data, attackers are motivated by a small number of goals, as shown in Figure 9.
We saw a little more variance among attacker techniques than tactics, but a small number of behaviors still accounted for the vast majority of confirmed breaches, as shown in Figure 10.
The most prevalent technique in the application attacks was, predictably, ransomware. Considering that a significant number of the ransomware notifications were removed from this analysis because of the third party, this illustrates the degree to which ransomware has exploded in popularity. After this, the next three techniques—web exploits, executing malicious scripts, and automated exfiltration—are all features of the formjacking attack chain, and the extra bump in the number of web exploits was attributable to the 27 notifications in our data set stemming from the campaign against the Aeries Student Information System discussed earlier. After that, we saw several techniques associated with access breaches, such as phishing and credential stuffing, along with a number of techniques that laddered up to the collection and exfiltration tactics.
Attack Chain Conclusions
The predominant conclusion from analyzing attack chains is the importance of defense in depth. This is not a controversial conclusion and is in line with the existing principle of assume breach as well as the growing consensus around the importance of Zero Trust.6 However, the convergence of disparate attack types in one stage into the same tactic or technique in a subsequent stage also illustrates how defense in depth can also provide a greater amount of coverage.
The second thing that emerged is the importance of building controls into a comprehensive security architecture as opposed to bolting on single-point controls. This is also noncontroversial in theory but unfortunately rare in practice, as organizations seldom have the time or advance notice to rethink security architecture in the face of changing environments.
It is interesting to note, from the tactic perspective (that is, the ends of a particular attack as opposed to the means), the similarities between two vectors that can appear very different, such as a web exploit and a credential stuffing attack to execute ransomware. In each case, the attack chain was composed of network intrusion, execution, and exfiltration. In other words, the tactical similarities between malware-focused attacks and web exploits were not as dramatic as they may appear in more niche discussions of attacker TTPs.
Based on these observations about common goals and points of efficiency in controls, we share conclusions and recommendations at the end of the report, with particular emphasis on controls (or control objectives) that offer particularly broad coverage against high-frequency tactics and techniques.
Attack Details
Because of their prevalence and impact, we broke down the trends and characteristics of four specific types of attacks: authentication attacks, web exploits (with a focus on formjacking), cloud incidents, and API incidents. These last two are based on open-source information we’ve collected, rather than from the public breach disclosures. We included them here because, as you’ll see, both cloud and API breaches represent a trend of security incidents that seem puzzlingly simple and avoidable on the surface but simply won’t go away. As both of these architectural trends are also simultaneously growing, we felt it was important to understand how these architectural shifts are driving risks in ways that might not be clear to many.
Authentication Attacks
At this point in the game, if you have a login accessible on the Internet, you should assume that it’s under attack from both humans and bots. That means that you’ll see credential stuffing, brute forcing, dictionary attacks, and password spraying all trying to weasel their way in. You’ll observe the full range of human endeavor, from stupid login attempts that seem to make no sense, like admin/admin combinations, to freshly stolen spear-phished credentials from your own organization. Web login pages, especially for retail or finance-related websites are heavily hit for direct fraud. Email logins are popular for strip mining confidential information, contacts, and password resets. Finally, VPN/remote access logins are targeted to deliver ransomware and other malware. Therefore, every login you expose online is a target and should be monitored and protected.
A note on sources: for this section, in addition to the U.S. public breach disclosures, we analyzed incident data from the F5 Security Incident Response Team (F5 SIRT) from the beginning of 2018 to the end of 2020. The F5 SIRT helps customers tackle security incidents in real time. To protect customer confidentiality, we do not mention specific organizations’ numbers but instead compare relative increases in incident reports.
Summary
- For the past three years, authentication attacks such as brute force and credential stuffing made up 32% of all reported security incidents to the F5 SIRT.
- Financial services organizations had the highest percentage (46%) of reported authentication attack incidents, followed by public sector organizations at 39%.
- U.S. and Canadian organizations had the highest percentage (45%) of reported authentication attack incidents.
Regional Trends
Different parts of the world report different magnitudes of authentication attacks. There are many factors behind this, although likely a major one is the proliferation of services available online via a consumer-focused password login.
Between 2018 and 2020, authentication attacks were the most reported type of incident in the United States and Canada, at 45% of all reported incidents. Second is Europe, the Middle East, and Africa (EMEA), with 29%, followed by the Asian Pacific region at 10%. Latin America did not have enough incidents to properly assess trending data.
Authentication Attacks Year by Year
Overall, reported attacks on password logins are growing at 15% per year. As of 2020, they averaged 32% of all reported incidents, but if trending holds, they’ll creep up closer to 40%.
F5 SIRT Incidents by Industry Sector
Breaking this data out by industry sector revealed some interesting differences. Looking first at authentication attacks shows the top sectors hit (see Figure 11).
Authentication Attacks at Financial Services Organizations
Financial services organizations experienced the highest proportion of password login security incidents, at 46%. Breaking these out, 4% of these attacks targeted email web gateways, 5% were reported against APIs for mobile apps, and 4% hit Open Financial Exchange (OFX) interfaces. Out of all reported financial organizations reporting password attacks, 3% reported system slowdowns due to the load.
The public breach data showed a similar story for banking, financial services, and insurance. Out of the 123 publicly disclosed incidents we examined in the sector, only seven (5.7%) were explicitly called out as credential stuffing attacks, and 11 (8.9%) as phishing attacks, but 41 breaches (33%) were some sort of BEC. Given the higher frequency of phishing being called out in disclosures, and the general prevalence of credential stuffing, we’re inclined to say that most of those 41 BECs were probably, but not definitively, credential stuffing.
Authentication Attacks at the Government and Public Sector
Government and public sector organizations reported the second-highest proportion (39%) of authentication attacks. These ran the gamut of incidents involving web logins, email web gateways, email servers, and even SFTP sites. Several credential stuffing attacks were noted against payment card gateways.
The public sector had so few data breaches in our data set—only 12 across all causes—and only one event that was a confirmed authentication attack: a phishing attack against a local municipal government. In this case, we know that the phishing attack used a malicious link to harvest credentials.
Authentication Attacks at Telecommunications and Service Providers
The third-highest proportion of reported password login incidents in the SIRT data was from telecommunications service providers, at 28%. Nearly all these attacks were against web logins but a few were reported against Secure Shell (SSH) network logins.
It is difficult to differentiate telephone and telecommunications service providers from the rest of the Information sector in the breach data. This sector includes publishing companies, a variety of software companies, and managed service providers, among others. Of the 53 known breaches in the Information sector, nine were some form of BEC and three were phishing attacks (there were no confirmed credential stuffing events).
Web Exploits
Despite the fact that other kinds of attacks, like credential stuffing, have higher prevalence and success rates, web exploits like cross-site scripting (XSS) or injection are the attacks that most of us think of when we think about hacking or cybersecurity. It is obvious that these kinds of attacks can be extraordinarily impactful—if any of us had forgotten how bad web vulnerabilities could be, CVE-2021-26855 (the vulnerability that provided the initial foothold for the Microsoft Exchange Server attacks in spring 2021) provided an emphatic reminder.7
Simultaneously, web exploits have some fundamental differences from the “inherent vulnerabilities” we associate with access-tier attacks because web attacks are particularly context specific. Sometimes web vulnerabilities are really bad. Most of the time, they don’t apply to most people. The local, instantaneous risk of a specific exploit waxes and wanes according to the ongoing efficacy of vulnerability management programs, both at customer and vendor organizations. Assessing the overall magnitude of this vector as a category and not a series of one-offs is therefore difficult. This contributes to the overall roller-coaster experience of many security professionals, as they consume industry alerts about new exploits and try to assess their applicability. With that in mind, we determined what we can about web exploits, based on the data available to us, and tried to pin down how to frame these vectors in comparison to others.
A note on sources for this section: some of the other detailed explorations of specific attacks incorporates data from the F5 SIRT or open-source intelligence from other organizations. For this section, the only data we have is from the U.S. public breaches, so while we unfortunately don’t have comparisons from other countries, we have the space here to explore the breach trends in a little more detail than we do in the “2020 Date Breach Analysis” section.
Summary
- Web attacks contributed to about 15% of confirmed U.S. breaches in 2020.
- Formjacking, the predominant category of web attack over the last few years, declined in prevalence, making up 61% of web breaches in 2020 as opposed to 87% in 2019.
- Formjacking has spread past ecommerce and online retail to target any organization that takes payment cards.
- The majority of non-formjacking web breaches came from a systematic campaign against a student information management system that compromised 27 California secondary schools.
- Formjacking techniques vary by threat actor and target software, but masquerading as a legitimate service or file is common for all stages of the attack chain.
Trends Over Time
In the “2020 Data Breach Analysis” section, we briefly allude to the transformation in attacker tactics. The transformation is best understood as the sum of two distinct trends:
- The proportion of web exploits among successful attacks against U.S. targets has trended downward from the high point of 53% it had in our initial data breach analysis, and has hovered between 15% and 20% of breaches since.
- Attackers seem to be gaining greater consensus about which kinds of exploits work, as evidenced by the growing use of formjacking attacks in web breaches. Like all exploits, formjacking exploits are specific in the sense that they need to attack a specific piece of software, often a specific version of the software. But formjacking is also particularly specific in terms of the kind of asset it provides attackers, which is payment card data.
Our interpretation of these two trends is that financially motivated attackers have landed upon a combination of target data, target software, and TTPs that yields fruitful outcomes. Most of the time (that is, in the absence of a known vulnerability), it makes more sense to use other tactics against other kinds of targets.
This is a nice, neat narrative: web exploits against ecommerce, credential stuffing or phishing for everyone else. This was the clear pattern in 2018 and 2019. In 2020, however, a significant number of notifications went out for other platforms and other reasons. While formjacking made up 87% of web breaches in 2019, it only accounted for 61% in 2020.
The remainder of web breaches broke down as follows. Eight web breaches at a variety of organizations were apparently one-off web exploits: A transportation logistics company lost customer financial information after attackers compromised two of its web applications, and a periodical aimed at tertiary educators was compromised through a web exploit, after which the attackers achieved persistence using administrator credentials before exfiltrating customer data. But the big cluster of non-formjacking web breaches came from the 27 schools whose student information portal was compromised. Our neat narrative about attacker consensus in targeting ecommerce organizations doesn’t really hold anymore, since these weren’t formjacking attacks and the stolen data wasn’t financial in nature.
Rather than throw out our targeting pattern, however, we think it makes sense to interpret this as an example of a hierarchy of indicators for predicting attack. In the presence of a weaponized exploit and a target-rich environment, bigger trends are less important. For some set of attackers, the secondary schools were evidently a bird in the hand, even if they didn’t fit the ecommerce profile for web attacks. Thinking about target parameters in a hierarchy like this allows us to use the data we have at any given moment but to narrow our focus to more technical indicators when that information is available. Which brings us to the next indicator of great abundance and moderate usefulness: sector.
Web Breaches by Sector
With all of those caveats about the non-formjacking exploits out of the way, we can look at how the 2020 web breaches broke down by sector, as shown in Figure 12.
Those school information system breaches are responsible for the educational services sector taking the top share of web breaches. However, at the risk of being repetitive, the sector boundaries can mask the truth of the data, partly because, as we’ve noted, retail-like behavior is more important than actually being in the retail sector. The clearest examples of this come from the nine incidents in the Other Services sector, all of which were formjacking attacks against professional organizations, including a physicians’ association, several prominent bar associations, and the Society for Industrial and Applied Mathematics. In other words, lots of organizations that accept payment over the web are being hit this way, even if they aren’t selling anything concrete.
Anatomy of a Formjack
Much of our 2019 Application Protection Report focused on how the decentralization of application architecture provided new opportunities for attackers. As part of that inquiry, we examined how formjacking works, as shown in Figure 13. At the time, we focused on the third-party aspect that made formjacking into a supply-chain attack as well. While the supply-chain compromise isn’t the only way to load and serve a malicious script with the main application, this approach usually has the strong advantage of receiving less scrutiny but the same runtime permissions.8
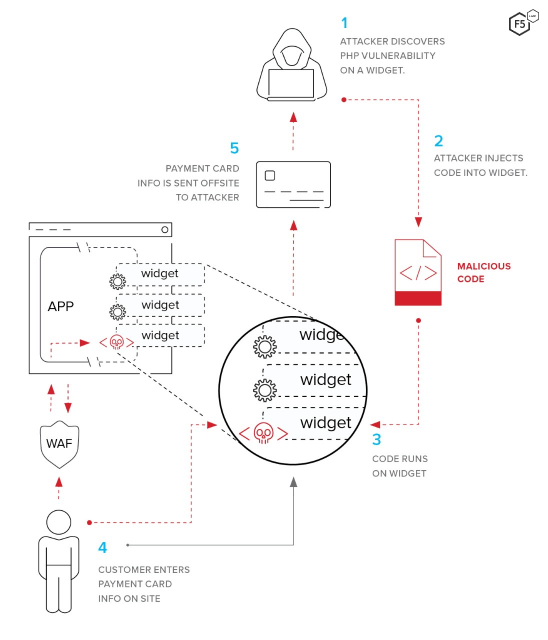
Figure 13. Lifecycle of a typical formjacking attack using a software supply chain compromise to deliver the malicious script.
The point is that the original vulnerability is merely the opportunity to add the skimming script to a part of the application that will get served to the user’s clients at runtime. This is not that different from many kinds of keylogger scripts or malware, although there are a few interesting things to note about various formjacking attacks:
- As with many attacks designed to persist and harvest information for as long as possible, formjacking attackers often go to great lengths to evade detection. One technique is masquerading as a legitimate service. Malicious scripts and requests in certain formjacking attacks have been observed masquerading as Google Analytics scripts, commonplace libraries such as js-cookie, and look-alike domains that mirror the target vendor to evade detection.9
- After encrypting the skimmed information, some attackers use different techniques for exfiltration. In some cases, the script creates an HTML image element, then passes the encrypted information through as part of the query for that image location. The drop server strips the payload off the image request, decrypts, and stores for later use.
- Some Magecart-style formjacking attacks use several scripts in tandem to execute the actual skimmer. The first script creates another script element within the site, which calls out to a malicious server masquerading as a legitimate service to download the second part of the script.
- The FIN6 threat actor behind the widespread formjacking campaign against the Volusion ecommerce platform also stores stolen, encrypted data in the browser’s sessionStorage. When the page immediately after the submission of information is loaded, the original malicious script (which is reloaded as one of the scripts in that subsequent page) detects the presence of data in sessionStorage and exfiltrates it.18
Putting Vulnerabilities and Exploits in Context
The implication about web exploits is that this risk manifests in a qualitatively different way than authentication or API attacks. The threat of authentication attacks is essentially continuous. The only questions are about tooling, the nature of the latest set of stolen credentials, and the success rate. In contrast, web attacks don’t really matter, right up until they are the only thing that does. When they apply to you, they apply completely, and you’re going to have a few bad days. When they don’t, you breathe a sigh of relief and spare a thought for the poor people to whom they do apply. For each vulnerability, the risk is either instantaneously grave or instantaneously minimal, depending on the hour. For a chief information security officer (CISO) who needs to think about an organization’s entire risk profile, it can be difficult to compare these qualitatively different vectors.
Cloud Breaches and Incidents
Cloud breaches are unusual in many respects. After years of hesitation on the part of large enterprises to outsource in such a committing way, it has since become clear that the economies of scale and standardization advantages outweigh the risks of the cloud in almost all respects. We say almost, because the one form through which cloud risk consistently manifests is misconfiguration.
A note on sources for this section: the data for this section comes from open-source, public information about cloud breaches that we collected, normalized, and enriched to understand the when, how, and why of cloud attacks. The data for 2020 contains only 13 distinct cloud incidents, but as noted later, attacker activities have revealed many more insecure cloud instances than that number indicates.
Summary
- With the exception of the Blackbaud ransomware event discussed earlier, misconfiguration accounted for all of the cloud breaches we know of in 2020.
- Twelve instances of specific clouds being compromised were due to a lack of access control.
- Nearly 20,000 unsecured cloud databases were wiped by malicious or vigilante actors using scripts.
- The dynamic boundary of responsibility between cloud provider and customer is a source of confusion that contributes to the likelihood of misconfiguration.
Our Own Worst Enemies
This section covers three distinct types of cloud incidents from 2020. The briefest to discuss is the one cloud breach that (as far as we can tell) wasn’t due to misconfiguration. This turned out to be the same Blackbaud ransomware attack discussed in the “2020 Data Breach Analysis” section that was responsible for so many of the third-party ransomware notifications in the breach data. (We don’t actually know the root cause of the incident, so it is certainly possible that it was a misconfiguration too!)
We know for sure that misconfiguration was the root cause of 12 other cloud breaches. In each case, organizations left large, sensitive data stores available to the public with no authentication. We don’t know how many of these were attributable to organizations that intended to put access control in place and failed, and how many were not aware that their data was available on the web at all.
These 12 breaches included offerings from all three large cloud providers (Google Cloud Project, Amazon Web Services, and Microsoft Azure), and also involved Elasticsearch instances, MongoDB data stores, Amazon S3 buckets, a Docker administration API, and a Microsoft Bing database, so these kinds of incidents are notably product- and vendor-independent.
The third kind of cloud breach is also ultimately due to access control misconfigurations but is slightly more complex. In a few distinct episodes in the spring and summer of 2020, attackers used scripts to automatically detect cloud databases and delete their contents. The first one apparently wiped out more than 15,000 Elasticsearch instances, and left behind the name of an information security organization in an apparent attempt to frame them.10 The second episode in these kinds of attacks became known as the “meow attack” or “getting meowed” because the script overwrites the files or database indices with the word meow. The meowing campaign is known to have compromised at least 4,000 databases of many types, not just Elasticsearch.11
We don’t know if these campaigns are malicious attempts to derail operations at organizations that made themselves easy targets, or if they are “tough-love” attempts by security researchers to prove a point about insecure data storage practices. Either way, they make their position clear: there is apparently only one failure mode for cloud computing—access control misconfiguration.
Explaining the Inexplicable
It is evidently extraordinarily hard for organizations to ensure data they store in the cloud has the correct permissions, and we wanted to understand why. To be sure, the pressure to bring services to market quickly is enormous, and we know that many organizations remove access controls during development and testing to make things faster and easier. Even so, there has to be a structural reason why we see so many misconfigurations in the cloud.
One potential explanation is that it is increasingly unclear what we mean when we talk about something being “in the cloud.” When the cloud was still somewhat new, there was a lot of discussion about security in the cloud versus security of the cloud. In other words, there was an understanding that some aspects of this new operating model were the responsibility of the cloud customers (in the cloud) and some aspects were the responsibility of the cloud providers (of the cloud).
Time has shown that security of the cloud, the fundamental security of the cloud as a platform, is actually quite good. Security in the cloud, on the other hand, is not merely hard to do right, but hard to even get the basics right. How is this possible? It’s not as though the only good security people in the world are at Amazon or Microsoft.
One clue to this puzzling imbalance of outcomes lies in the fact that the boundary between these two aspects, between the security in the cloud and of the cloud, changes often. It doesn’t merely shift from customer to customer, but from cloud service to cloud service. This means that the boundary of responsibility moves whether the customer is using Amazon EC2, Amazon S3, AWS Lambda, or Amazon Aurora.12
The point is that this extraordinarily simple outcome (huge stores of data left unsecured on the Internet) belies the fact that cloud management has become quite complex. Of course we can’t isolate either human error or speed to market from this phenomenon, and they surely both play a role here, but it also appears that much of the management effort and cost that cloud computing was supposed to solve for us has reappeared in a new form. It doesn’t even matter whether we’re talking about organizations that tried to implement access control and failed, or those that didn’t even realize their database was facing the web. Both would have been solved with proper application of process; it just depends whether the process in question was inventory or change control.
Viewed in this way, cloud computing starts to have more in common with the architectural decentralization trends we discussed last year, that is, the trend toward API-centric architecture, serverless computing, containerization, and heavy reliance on third-party (or fourth- or fifth-party) services. In all of these cases, it is tempting but ultimately erroneous to conclude that the responsibility of security is lessened; it merely morphs into another form. These kinds of misconfigurations could be prevented or detected with commonplace practices that, ironically, stem from the on-premises days. We discuss these approaches more in the “Tactical Recommendations” section.
API Incidents
APIs form the chassis for modern applications. They are increasingly becoming the focal point for application developers and architectures because they represent a rapid, flexible way to compose an application out of a disparate set of parts. F5’s State of Application Strategy in 2021 report found that 58% of participants have added or are working to add a layer of APIs to enable a modern user interface.
However, this shift to API-centric architecture has also brought greater attention to APIs as an attack surface. Both malicious attackers and security researchers have recently found success identifying security holes in APIs, some of them glaring. This combination of newfound importance and stalling security progress is what impels us to look for patterns in API vulnerabilities and incidents, so that organizations can continue to reap the benefits of these architectures without losing their valuables in the process.
A note on sources for this section: the data and observations come from open-source reports and vulnerability disclosures that we enriched with additional information as possible. Many of these incidents were, thankfully, reported by security researchers instead of actual breaches, which is why we use the word incidents here. In 2020, we collected roughly 100 API incidents and categorized them as best we could.
When compared with network intrusions like those in the ransomware events discussed earlier, API data incidents tend to have short attack chains, often amounting to nothing more than a well-crafted HTTP request. Rather than apply the ATT&CK framework to these events, we narrowed the incidents down to a number of broad categories that, we feel, better capture what is going on and what to do about APIs:
- Bad authentication: No authentication, or failed authentication controls.
- Bad authorization: No authorization, or failed authorization controls.
- Misconfiguration: Lack of enforcing rate limits, insufficient logging and monitoring.
- Excessive data exposure: Additional data in the response that the API does not need.
- Unsanitized input: Blindly trusting user input.
- Unknown: Reasons not disclosed in breach notification.
Figure 14 shows the causes of the API incidents. As in previous studies of API incidents, authentication and authorization collectively contributed to the largest number of API incidents. Security misconfigurations, such as lack of rate limits and insufficient logging and monitoring, are also a significant subset of the incidents.
API Case Studies (What Does “Bad Authentication” Mean?)
Because APIs represent such a departure from the traditional concept of an application, it is illustrative to explore these incidents to understand what lies behind these failure modes. We highlight a few incidents from the last year that capture the lag in security that accompanies this innovative architecture.
APIs and Sectors
As more APIs are published, both by large enterprises who want to make their data more available (such as Google) and by smaller, industry-specific organizations hoping to generate value, some interesting industry patterns are also emerging. Of the organizations for which we had sector information, social networking organizations made up the largest subset, followed by organizations in the technology sector and ecommerce. All other sectors had only a few incidents each.
However, parallel to the limitations of sector analysis in the data breaches, thinking about APIs in terms of sectors can obscure their advantage, which is to connect and link sectors in ways that weren’t possible or obvious when we were dealing with entire applications instead of subcomponents and data feeds. When we think about APIs and industries, we should really be thinking about them as a connection between a data source and a data sink, as in company A in the tech sector publishes an API for consumption by company B in the finance sector.
Controlling API Risk
The main point about APIs is not that they represent such an enormous risk, but that they represent such an avoidable risk. Some vulnerabilities or attack scenarios are subtle and difficult to defend against, like cross-site scripting. There are also risks, like ransomware, that organizations choose to simply accept, transferring the risk to another venue, such as with cyberinsurance. In contrast, we argue that these kinds of API bugs are not acceptable; no CISO or architect would look at behavior like that in the case studies and choose to bring it to market.
This indicates that the people who make the decisions about APIs do not yet sufficiently understand the risks. Or rather, we should say that the implications of API-centric architectures are not well understood. APIs have been around for decades and are used for an enormous range of things. The qualitative change we have experienced in the last few years is building applications around APIs as opposed to using APIs to link up existing systems. The “Recommendations & Conclusions” section provides both specific recommendations for API controls as well as some strategic observations.
Impacts
From the standpoint of victim outcomes, the various attacks that constituted the 2020 threat landscape are reducible to four different categories: ransomware, email compromise, formjacking or other payment card loss, and database breaches. This section explores each in turn.
We are notably not covering one prominent and impactful vector from 2020, which is infrastructure compromise of the type exemplified by the SolarWinds SUNBURST attack. This is primarily because this attack was extraordinarily targeted, in addition to being well planned and executed. While it is true that 18,000 targets were compromised by the SUNBURST malware, the later stages of that attack chain exploited only a few dozen specific targets.
While supply-chain attacks remain a significant (and perhaps still underestimated) vector, the ability to pivot from a vulnerability like this into the full-blown compromise that happened to this campaign’s real targets is not common. SolarWinds is, therefore, a hugely significant event from which we all must learn, but not particularly representative in terms of helping prioritize risk for organizations that aren’t tied into national security.
Ransomware Comes of Age
By now it is clear that 2020 was the year that ransomware matured. In its earlier forms, ransomware was essentially a test of backup capabilities, in two respects. First, it separated those who had a backup strategy from those who did not and, second, it separated those who consistently executed their backup strategy from those who were less thorough. However, attackers have adapted their techniques so that backups are less of a silver bullet than they once were and simultaneously have found ways to increase their leverage and maximize the probability of collecting ransom.
At the risk of sounding obvious, ransomware’s largest impact is making the victims’ systems unavailable. Some ransomware strains encrypt only working data and leave operating systems alone. Some encrypt everything, shutting down all operations. In both cases, once the actual encryption is deployed, it’s probably time to bring out the backups, after performing some forensics to find out which backup is clean.
The new trend in ransomware, which started before 2020 but has now become the norm, is for adversaries to be much more subtle. Attackers now seek to quietly achieve widespread persistence in target environments, and compromise backups if possible, before triggering any encryption. This makes it much harder to contain the spread of encryption once the malware is triggered.
This longer, slower approach to ransomware also means that recent backups are more likely to be compromised, forcing organizations to choose between losing a longer span of operational data and ensuring their environment is clean. This is the reason why backups are no longer sufficient to mitigate the impact of a ransomware event, unless organizations have the combination of backups that are sufficiently comprehensive, recent, and hardened (that is, air gapped), plus the forensic ability to identify the moment of infection with reasonable certainty.
Attackers have also recognized that the safest way to ensure victims pay the ransom is to also exfiltrate data from the environment. This gives attackers a bit of leverage in their negotiations. Attackers tend to give victims a short window of time to arrange payment, after which they will start to post sensitive records on the Internet to embarrass victims. Note that this new approach also means that nearly all ransomware events trigger a breach notification according to U.S. law, since forensic investigators can almost never rule out the possibility of exfiltration.
From the standpoint of mitigating a single ransomware attack, it is important to recognize that the ransomware itself is only the tail end of a longer attack chain, and that some kind of malware dropper or downloader is necessary. The three most prevalent malware families for delivering ransomware in 2020 were Trickbot, Emotet, and Cobalt Strike.
However, at a strategic level, we also feel it is important to recognize where the innovation in ransomware really lies, in keeping with the approach that it is equally important to understand why attackers do things as well as how. From a delivery standpoint, ransomware isn’t substantively different from a keylogger or cryptominer. Rather, it is the nature of the encrypted data and the characteristics of the victims that help explain what is going on.
We have been arguing that analyzing attacks by sector is only fruitful insofar as the sectors are good predictors for either data types or software in the environment. Formjacking attacks are straightforward to analyze in this respect since they are so selective in targeting payment card information only. We also note, however, that the retail sector, the epicenter of both payment card use and payment card theft, had the lowest incidence of ransomware of any sector, with only 8% of retail breaches happening this way. At the other end of the spectrum, education and health care stand out as the sectors that had both a large number of breaches overall and a large number of ransomware breaches.13
The organizations with the easiest data to sell are being hit the least hard with ransomware. What this tells us is that the innovative part of ransomware is in monetizing stolen data—not malware. The kinds of information that attackers are stealing in ransomware events are employee paperwork, emails, and maybe the odd bit of financial or personal information in mailboxes. Data like this is not particularly valuable, except to the organization from which it was just stolen.
For this reason, we have come to see ransomware not as a new vector making up a proportion of the breaches that used to be centered around either formjacking or access breaches. Instead, ransomware represents a monetization strategy for nonfinancial data that is difficult to sell. Ransomware isn’t replacing tactics like credential stuffing and email compromise; it is joining those tactics, because the perfect buyer for that stolen data is in the environment from which the attacker just stole it. The how of ransomware is the attack chain—the initial access, the execution strategy, the dropper, persistence, and all that. But the why is, as it is for the vast majority of attacks we talk about, money. Attackers have always striven to find the most profitable buyers for stolen data. They have now optimized this process to the point where they sell our data back to us. Ransomware is best understood as a market phenomenon, not a technical exploit. That is the real lesson for its highly visible maturation in 2020.
Email Compromise
After ransomware, the single most frequent outcome of a breach in 2020 was the vague “BEC.” The 2020 breaches we examined included 195 instances of BEC, or 27% of the total number of breaches. These kinds of breaches can manifest in different ways, depending on the attackers’ goals and what the inboxes contain. The most common impact of a BEC is a breach notification to a subset of customers and/or employees. Most often, forensics specialists review the mailbox’s contents after the breach to find out what was stored there and who was affected.
Because most of us (the authors included, no judgment intended) have become habituated to using mailboxes as a low-quality cloud storage service, most email inboxes include at least some sensitive information, such as tax documents from correspondence with human resources, customer information, and occasionally banking information. When a mail breach happens, exposures of this type are the most frequent cause of notifications going out. Fortunately, the partial nature of the data in most inboxes means that these kinds of breaches are usually not large.
Another impact of BEC is the potential for lateral spear phishing. This was the seventh-most prevalent technique in the attack chain analysis as well as the most prominent lateral movement technique we encountered. It is much easier to convince a target to click on a mail if it is from a known coworker or business partner than if it is from a faceless organization.
Another lateral vector that comes into play after a BEC is lateral account takeovers of accounts for which the compromised email is the point of contact. While these kinds of tactics are usually reserved for high-value targets of state-sponsored actors, we have also heard of these tactics being used to create fake social media accounts for disinformation.
Formjacking/Payment Card Skimming
In the United States, the impact of stolen payment cards falls on the vendors. The Fair Credit Billing Act limits customer liability for fraudulent charges as long as customers report them within a reasonable timeframe.14 When a customer reports a fraudulent transaction, it results in what is known as a chargeback, in which the payment goes back to the customer. The vendor has to take the loss not only on the goods or services it provided but also for the labor time involved in completing the sale, such as inventory and shipping.
These impacts are proportionately much greater for small businesses. Large organizations have budget set aside for these kinds of losses, whereas small business operate with a much finer absolute margin. The result is that payment card theft and fraud hits smaller businesses significantly harder and results in stronger consolidation pressure in the ecommerce market.
Database Breaches
Database breaches can manifest in different ways depending on the nature of the organization and the data involved. If the database contained credentials, those credentials will end up being shared and sold among cybercriminals and most likely used in fraud attempts. If the database contained records that are more difficult to monetize, two scenarios are likely: (1) the records might be collected into a package that a more patient threat actor could use for more gradual forms of fraud, such as identity theft in the tax system; or (2) if the attacker is politically motivated, the records might be used for intelligence or espionage purposes.
For some time, these were the only options for less fungible records than credentials or payment card information. However, as discussed earlier in the “Ransomware Comes of Age” section, these less fungible stolen records might be sold back to the immediate victims in a ransomware attack.
Intellectual property loss is also a risk. We know that some actors carry out targeted cyberattacks for the express purpose of intellectual property theft and industrial espionage. Many of these events are not captured in standard data breach notifications because they are usually meant to be quiet and don’t result in the breach of personally identifiable information. However, not all such attacks are this focused, and attackers are opportunists who might steal something and figure out what to do with it later. The risk of intellectual property theft and loss of competitive advantage is significant and something organizations need to factor into their security strategy.
Recommendations and Conclusions
So now we return to the question of mitigation, which itself always boils down to the question of prioritization. Prioritization is, in turn, where it gets complicated. This section presents a series of recommended controls based on the attacker techniques and tactics documented in this report. However, in a field defined by layers upon layers of abstraction, interpreting the meaning of a trend occurring at one level, and placing it in context with all of the trends in all of the other levels, requires some tactical recommendations and strategic conclusions, which we provide here.
Tactical Recommendations
One of the advantages of the ATT&CK framework is the amount of collective thought that has gone into mapping mitigations to attack techniques. This makes it straightforward for us to pivot from a frequency analysis of attack techniques to a weighted list of recommended techniques. However, first we need to discuss some caveats about this analysis.
As noted in the “Methodology” section, the ATT&CK framework requires subjective judgments from educated analysts. Because of this, MITRE emphasizes that peer review and trading notes are important for making the most of the model. The low level of detail that we got from the breach notifications also means that techniques were used in the breaches that we don’t even know about. Because of this, no matter how well formed the methodology is here, the conclusions are therefore only impressionistic. These recommendations should be used to factor in controls and think about the attacks listed in this report but shouldn’t be used to rule out attacks that other intelligence or experience indicates are a problem. For instance, there are recommendations here that come out of our analysis with low priority scores, such as operating system configuration, but which are quite clearly important for all organizations. If any readers see countervailing evidence on their own networks, we urge them to trust their eyes and act according to local forces.
The controls listed in Table 1 are ranked according to the product of two metrics: the first is depth, as calculated by the frequency with which the corresponding attack technique occurred in the breach notifications. The second is breadth, as calculated by the number of distinct attack techniques that this control would mitigate. The product of these two numbers gives us a holistic sense of each control’s overall helpfulness. Keep in mind this product is a dimensionless value to use only for relative comparison. It has no reference to anything outside of this report, and should be taken with all of the caveats listed in the previous paragraph.15
| Mitigation | Arbitrary Effectiveness Coefficient (Depth x Breadth) |
| Privileged account management | 1.52 |
| Network segmentation | 1.22 |
| Restrict web-based content | 1.13 |
| User training | 0.78 |
| Network intrusion prevention | 0.75 |
| Update software | 0.61 |
| Antivirus/antimalware | 0.56 |
| Disable or remove feature or program | 0.56 |
| Filter network traffic | 0.56 |
| Multifactor authentication | 0.41 |
| Execution prevention | 0.38 |
| Data backup | 0.34 |
| Application isolation and sandboxing | 0.30 |
| Exploit protection (WAF) | 0.30 |
| Vulnerability scanning | 0.30 |
| Password policies | 0.27 |
| User account management | 0.20 |
| Code signing | 0.19 |
| Account use policies | 0.14 |
| Audit | 0.04 |
| Encrypt sensitive information | 0.04 |
| Limit access to resource over network | 0.03 |
| Restrict file and directory permissions | 0.01 |
| Application developer guidance | 0.01 |
| Active directory configuration | 0.00 |
| Operating system configuration | 0.00 |
Table 1. Recommended mitigations sorted by blended rank (depth x breadth). Note that while data backup was the most frequently encountered recommendation, its specificity pushes it down the ranks in this list.
We do not go into detail for all of these recommended mitigations because MITRE has great information, but we briefly touch on the following prominent or interesting ones.16
Privileged Account Management
Managing privileged accounts emerged from our analysis with the highest combination of depth and breadth. As a potential mitigation for the web exploits that made up roughly 30% of the known techniques in the breaches, it has significant depth, and it also would potentially mitigate five separate techniques that we observed among the breaches. Outside of our own data, it is also a broad mitigation approach within the ATT&CK framework itself, covering 35 techniques, not counting subtechniques.
Network Segmentation
Isolating critical systems from the Internet and from one another also emerged as a valuable strategy to mitigate the web exploits that were so prominent in the analyzed breaches. Network segmentation also has broad applicability, covering four attack techniques we observed and many more that we didn’t.
Restrict Web-Based Content
While this is a broad control objective, the most important form it takes, based on our observations, is in extensions that block malicious scripts and malware as well as proxies that control the use of web services.
Data Backup
MITRE lists data backup as the only recommended mitigation for ransomware, and as ransomware execution was the single most frequent technique we observed, this is the mitigation with the greatest depth, even if it only controls for one type of attack. As we mentioned in the “Ransomware Comes of Age” section, attackers have adapted their techniques to maximize the success of ransomware and to force defenders to choose between significant losses in productivity and ensuring a clean rebuild. This means that backups are no longer a single-point mitigation for the impact of ransomware, but they are still extraordinarily important, and incorporating a backup strategy into both routine operations and incident response has become absolutely critical.
Exploit Protection
Blocking behavior that leads to exploits takes many forms. In this case, the prevalence of formjacking attacks that depend on web exploits means that for our purposes, we are talking about WAFs. In both 2019 and 2020, we highlighted WAFs for their flexibility and capability in mitigating a wide range of techniques, including the formjacking exploits that are the current foundation for stealing payment cards. We continue to consider a WAF a minimum for anyone running a public-facing web application.
Code Signing
Code signing is not a particularly high-depth or high-breadth control on the list, but we call it out here because of its potential to control third-party risk in a low-cost way. Automated checks on integrity for both applications and their subcomponents can go a long way in providing prevention and detection against the kinds of injection attacks that are becoming both more prevalent and more impactful. Subresource integrity (SRI) is the most obvious way to implement this given the decentralization of web architecture, but we feel that code signing should be more widely implemented than we believe it is.
Multifactor Authentication
Multifactor authentication did not feature highly on the list of blended rankings because the techniques that it would mitigate that showed up in the data were uncommon. This would control only 11% of attack chains from the public breaches, so despite the fact that it covered six different techniques, it emerges low in the ranking.
However, we also have a strong suspicion that credential stuffing attacks are underreported in this data set and, while it has its flaws, multifactor authentication is still one of the most effective controls for authentication attacks. We know it’s not cheap to implement multifactor authentication, and the user experience isn’t ideal, but until we find a better way to interact with computers, it remains a minimum requirement.
Mitigations by Attack Technique
Table 2 provides a list of mitigations sorted by attack technique so that operators looking to add controls to mitigate a technique that is a known problem can quickly look for suggestions.
| Attack Technique | Mitigation |
| Data encrypted for impact (T1486) | Data backup |
| Exploit public-facing application (T1190) | Application isolation and sandboxing |
| Exploit protection (WAF) | |
| Network segmentation | |
| Privileged account management | |
| Update software | |
| Vulnerability scanning | |
| Command and scripting interpreter (T1059) | Antivirus/antimalware |
| Code signing | |
| Disable or remove feature or program | |
| Execution prevention | |
| Privileged account management | |
| Restrict web-based content | |
| Automated exfiltration (T1020) | Network intrusion prevention |
| Filter network traffic | |
| Network segmentation | |
| Phishing (T1566) | Antivirus/antimalware |
| Network intrusion prevention | |
| Restrict web-based content | |
| User training | |
| Credential stuffing (T1110.004) | Account use policies |
| Multifactor authentication | |
| Password policies | |
| User account management | |
| Internal spear phishing (T1534) | User training |
| Phishing via link (T1566.002) | Restrict web-based content |
| User training | |
| Input capture (T1056) | Privileged account management |
| External remote services (T1133) | Disable or remove feature or program |
| Limit access to resource over network | |
| Multifactor authentication | |
| Network segmentation | |
| Valid accounts (T1078) | Application developer guidance |
| Password policies | |
| Privileged account management | |
| Exfiltration over web service (T1567) | Disable or remove feature or program |
| Limit access to resource over network | |
| Multifactor authentication | |
| Network segmentation | |
| Email collection (T1114) | Audit |
| Encrypt sensitive information | |
| Multifactor authentication | |
| Brute force (T1110) | Account use policies |
| Multifactor authentication | |
| Password policies | |
| User account management | |
| Data from cloud storage object (T1530) | Audit |
| Encrypt sensitive information | |
| Filter network traffic | |
| Multifactor authentication | |
| Restrict file and directory permissions | |
| User account management | |
| Unsecured credentials (T1552) | Active directory configuration |
| Audit | |
| Encrypt sensitive information | |
| Filter network traffic | |
| Operating system configuration | |
| Password policies | |
| Privileged account management | |
| Restrict file and directory permissions | |
| Update software | |
| User training | |
| Phishing via attachment (T1566.001) | Antivirus/antimalware |
| Network intrusion prevention | |
| Restrict web-based content | |
| User training | |
| Email forwarding rule (T1114.003) | Audit |
| Encrypt sensitive information | |
| User execution (T1204) | Execution prevention |
| Network intrusion prevention | |
| Restrict web-based content | |
| User training | |
| Exfiltration to cloud storage (T1567.002) | Restrict web-based content |
Table 2. List of mitigations sorted by corresponding attack technique.
Recommendations for API Controls
APIs are kind of their own thing—part application subcomponent, part data structure—and the specific controls for their business logic and architectures are rather context dependent, so our recommendations for controlling API risk are more centered around control objectives than specific controls. Other F5 Labs articles provide tactical recommendations about controlling API risk, including securing APIs in banking and a “how not to” guide to JWT. F5 Labs recommends the following API controls:
- Inventory and manage API endpoints.
- Use a strong authentication and authorization solution, such as OAuth 2.0 and OpenID Connect.
- Employ the principle of least privilege.
- Encrypt traffic using transport-level security.
- Don’t expose more data than necessary.
- Enforce rate limiting.
- Always validate user input.
Strategic Conclusions
In the course of processing an entire year’s worth of security intelligence that occurred at different levels of detail, abstraction, and focus, many of the observations we make are not reducible to tactical recommendations but are larger-scale perspectives on the evolution of security as a body of practice and thought. We’ve included these conclusions and perspectives to help defenders think about how to improve their specific situations.
Formjacking to Hit Small Ecommerce Organizations Harder
Formjacking continues to hammer the world of ecommerce, and while the victims have ranged widely in size and revenue, this added pressure will hit small retailers the hardest over the long run. This is due to differences in security budgets, software budgets, cash reserves, and legal representation. Unless low-cost technical controls quickly become standard, we predict that the long-term costs of formjacking will be added to the already long list of reasons why it is hard to compete with Amazon.
Ransomware Places Cryptocurrency in Unwelcome Light
We also note in the “2020 Data Breach Analysis” section that the relationship between nonfinancial information and ransomware suggests that ransomware is more innovative on a monetization level than at malware- or intrusion-level techniques. Human-structured data is not nearly as valuable on the black market as payment cards or stolen credentials, but the perfect buyer is always right behind a successful attacker—as long as there is a way to get the money out unhindered.
This raises some questions about the role that cryptocurrencies play in abetting cybercrime. F5 Labs is neutral on the broader question of cryptocurrency—in fact, we are on the record as being both for cryptocurrency and against it—but there is no hiding the fact that it makes these kinds of attacks possible. It is not difficult to envision an attack landscape in the near future that is characterized by three kinds of attacks: stealing payment cards, government espionage, and ransomware. In a world where nearly every network intrusion results in ransomware, how long will cryptocurrencies be tolerated for mainstream transactions?
On-Off Nature of Web Risk Places Onus on Coding Practices
As we observed in the deep dive into web exploits like formjacking, the risks of a specific exploit take on a binary state for any given individual target. Either the vulnerability is present and the risk applies, or it does not. Rationally managing the risk around such a problem is difficult. However, the one way that organizations can control this overall risk in a proactive, predictable way is to invest in secure coding structures and processes. We know that it is cheaper to mitigate a coding flaw in development rather than in production. When we factor in the on-again, off-again nature of web vulnerability risk, investing in secure coding looks even more attractive because of its predictable, forward-looking cost.
API Incidents Illustrate Need for Standards
The current risk landscape around APIs is chaotic due to the sum of many forces, among them shadow IT and the pressure to “fail fast.” However, it also stems from the fact that many developers are treating APIs like a protocol with defined standards, when it is nothing more than a way of thinking about a problem. This is a large part of an API’s strength. Each API needs to define a set of expectations for data structures and formats as well as a URI for an endpoint to communicate with. REST APIs use standard web methods (although in a different way). Anything more than that is left to the API designer. In other words, the same flexibility that has allowed APIs to become ubiquitous is the same lack of consistency that leads to avoidable vulnerabilities.
If API-centric architectures are to fulfill their potential as the new glue of the web, there needs to be more standardization and process. Security professionals should reach out to their organization’s architects and development leads in two ways: first, work with them to develop a process to inventory APIs so that the inventory remains up to date in the future. Secondly, help developers and architects embrace the frameworks that are growing into standards, namely OpenID Connect, OAuth 2.0, and JWTs.
The authors would like to express their gratitude to the many people, within F5 and without, who supported this research project, including but not limited to: Sara Boddy, Debbie Walkowski, David Warburton, Jesse Smith, Heather McRobbie, David Severski, and Ben Edwards.