Executive Summary
It is February 2021. The tech industry is reeling from the twin shocks of the theft of FireEye’s red team tools and the SolarWinds Orion supply chain attack. Based on what we presently know, these campaigns were state-sponsored attacks against public and private institutions of strategic importance to the United States. However, it was also an opportunity for attackers to achieve persistence in the environments of thousands of organizations. We anticipate that 2021 will have many more announcements and unwelcome discoveries surrounding credential spills. In the meantime, what we already know makes it clear that credential stuffing will remain an enormous risk to organizations of all types.
We collected the data in this report to gain a sense of the relationship between three aspects of the ecosystem surrounding stolen credentials: theft, sale, and fraud use. Over the last few years, security researchers at F5 and elsewhere have identified credential stuffing as one of the foremost threats. In 2018 and 2019, the combined threats of phishing and credential stuffing made up roughly half of all publicly disclosed breaches in the United States. In other words, stolen credentials are so valuable that demand for them remains enormous, creating a vicious circle in which organizations suffer both network intrusions in pursuit of credentials and credential stuffing in pursuit of profits. Understanding the supply and demand sides of the market for stolen credentials is, therefore, key to contextualizing and understanding the enormity of the risk that cybercriminals present to organizations today.
That is why, for 2021, we have renamed this the Credential Stuffing Report (prior versions of this report were titled the Credential Spill Report, published by Shape Security, now part of F5), in order to understand the entire lifecycle of credential abuse, and why we have dedicated so much time and effort to not just quantifying the trends around credential theft but to understanding the steps that cybercriminals take to adapt to and surmount enterprise defenses.
Exec Summary Now Available!
Key Findings
- The number of annual credential spill incidents nearly doubled between 2016 and 2020.
- The annual volume of spilled credentials has mostly declined between 2016 and 2020.
- The average spill size declined from 63 million records in 2016 to 17 million records in 2020.
- Breach sizes appear to be stabilizing and becoming more consistent over time.
- Despite consensus about best practices, industry behaviors around password storage remain poor. Plaintext storage of passwords is responsible for the greatest number of spilled credentials by far, and the widely discredited hashing algorithm MD5 remains surprisingly prevalent.
- Organizations remain weak at detecting and discovering intrusions and data exfiltration. Median time to discovering a credential spill between 2018 and 2020 was 120 days; the average time to discovery was 327 days. Often spills are discovered on the dark web before organizations detect or disclose a breach.
- Tracing stolen credentials through their theft, sale, and use across Shape customers revealed nearly 33% of logins used credentials compromised in Collection X, a massive set of spilled credentials that appeared for sale on a hacking forum in early 2019. However, the stolen credentials in Collection X also showed up in legitimate human transactions, most frequently at banks.
- There are five distinct phases of credential abuse, corresponding to their initial use and subsequent dissemination among other threat actors:
- Stage 1: Slow and Quiet. Sophisticated attackers use compromised credentials in stealth mode. This phase usually lasts until attackers start sharing their credentials within their community.
- Stage 2: Ramp-Up. As credentials begin to circulate on the dark web, more attackers use them in attacks. The increase in pace means that this period only lasts about a month before the credentials are discovered, so the rate of attack goes up sharply.
- Stage 3: Blitz. Once the word is out and users start changing passwords, script kiddies and other amateurs race to use the compromised credentials across the biggest web properties they know.
- Stage 4: Drop-Off. Credentials no longer have premium value but are still used at a higher rate than in Stage 1.
- Stage 5: Reincarnation. Attackers repackage spilled credentials hoping for a continued lifecycle.
- The majority of “fuzzing” attacks occur prior to the public release of the compromised credentials, lending credence to our understanding that fuzzing is more common among sophisticated attackers.
- A rich and growing ecosystem of attack tools—many of which are shared with security professionals—enables credential stuffing attacks and threatens the efficacy of existing controls.
- Attackers continue to adapt to fraud-protection techniques, creating a need and opportunity for adaptive, next-generation controls around credential stuffing and fraud.
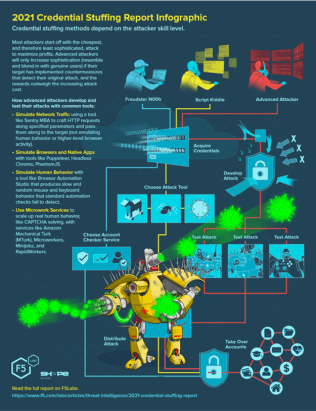
Check out our Cred Stuffing Infographic!
Credential Spills
Definitions and Notes
Credential spill: A cyber incident in which a combination of username and/or email and password pairs becomes compromised.
Date of announcement: The first time a credential spill becomes public knowledge. This announcement could occur in one of two ways:
- A breached organization alerts its users and/or the general public. For example, the gaming site Smogon University announced its data breach through its own web forum.1
- A security researcher or reporter discovers a credential spill and breaks the news. For example, Troy Hunt learned that the home financing website MyFHA had suffered a credential spill and shared the news via his site, Have I Been Pwned (HIBP).
Date of breach: When the credentials in question first became compromised. This date is only known and/or shared in about half of cases.
Date of discovery: When an organization first learned of its credential spill. Organizations are not always willing to share this information.
Notes
- Unlike in previous years, this 2018-2020 report excludes credential spills in which the organization was unable or unwilling to share the number of credentials compromised. There were simply too many of those types of incidents this year from a variety of organizations, including Reddit, GitHub, and Dell.
- If an exact date is not given for date of breach or date of discovery, we use approximations:
- In July = July 1, 2018
- In mid-July = July 15, 2018
- In late July = July 20, 2018
- Several = 3
How Do We Know About Credential Spills?
The credential spill data in this report comes from open-source information about credential spills. Sources like Have I Been Pwned, DeHashed, and Under the Breach contribute the bulk of the data, but we occasionally use other sources, such as press releases, to enrich the data with more accurate dates or details, including password storage techniques.2 Unfortunately, this data also emphasizes the poor state of detection and discovery in the field. Many organizations only learn about credential spill breaches after their data is sold online and a darknet monitoring service notifies them, which is usually the same time that those incidents and credentials end up on something like HIBP. We’ll explore the lamentable state of internal breach detection and the lag in disclosure later in the “Reasons for Credential Spills” section. For the moment, let’s explore the data and see what it tells us about the supply side of the market for stolen credentials.
By the Numbers
Now that we have five years of data on the subject, it is definitive: credential spills are here to stay. However, on the surface, it is not immediately obvious whether they will remain a serious threat or merely a nuisance. Figure 1 breaks down spill data for 2016 through 2020.
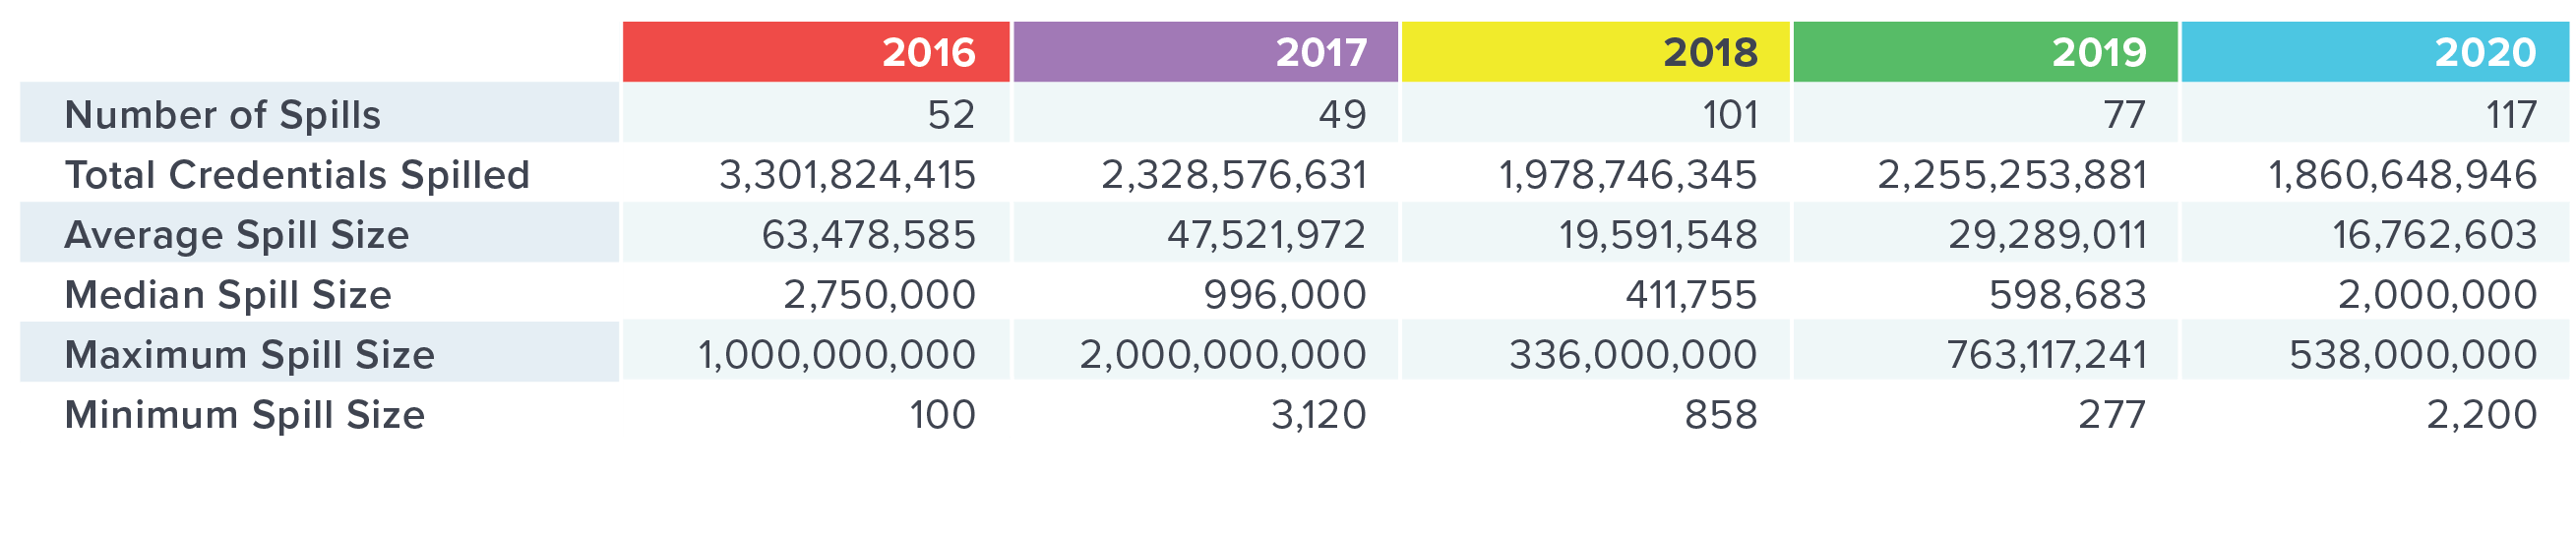
Figure 1. Summary of credential spills from 2016 through 2020
The bad news for organizations is that the number of reported credential spill incidents has varied widely over the last five years, but is trending upwards (Figure 2). However, keep in mind that incidents like this vary enormously in discovery and reporting time. For some of these incidents, we already know that they occurred in earlier calendar years, but we list them this way for consistency. For others, we simply don’t know the date of the intrusion and we list the announcement date by default. Because of this lag, we don’t know if the increase in events is due to improvements in detection and reporting over the last five years, whether attackers are targeting a different kind of organization that is more likely to detect and report, or if successful attacks are becoming more common.
Despite the increasing number of incidents, however, the total number of credentials spilled over each calendar year has trended downward, not counting the slight tick upward in 2019 (Figure 3). Since this report’s primary focus is to prevent credential reuse in postspill fraud attempts, this is good news, even if the number of events is climbing.
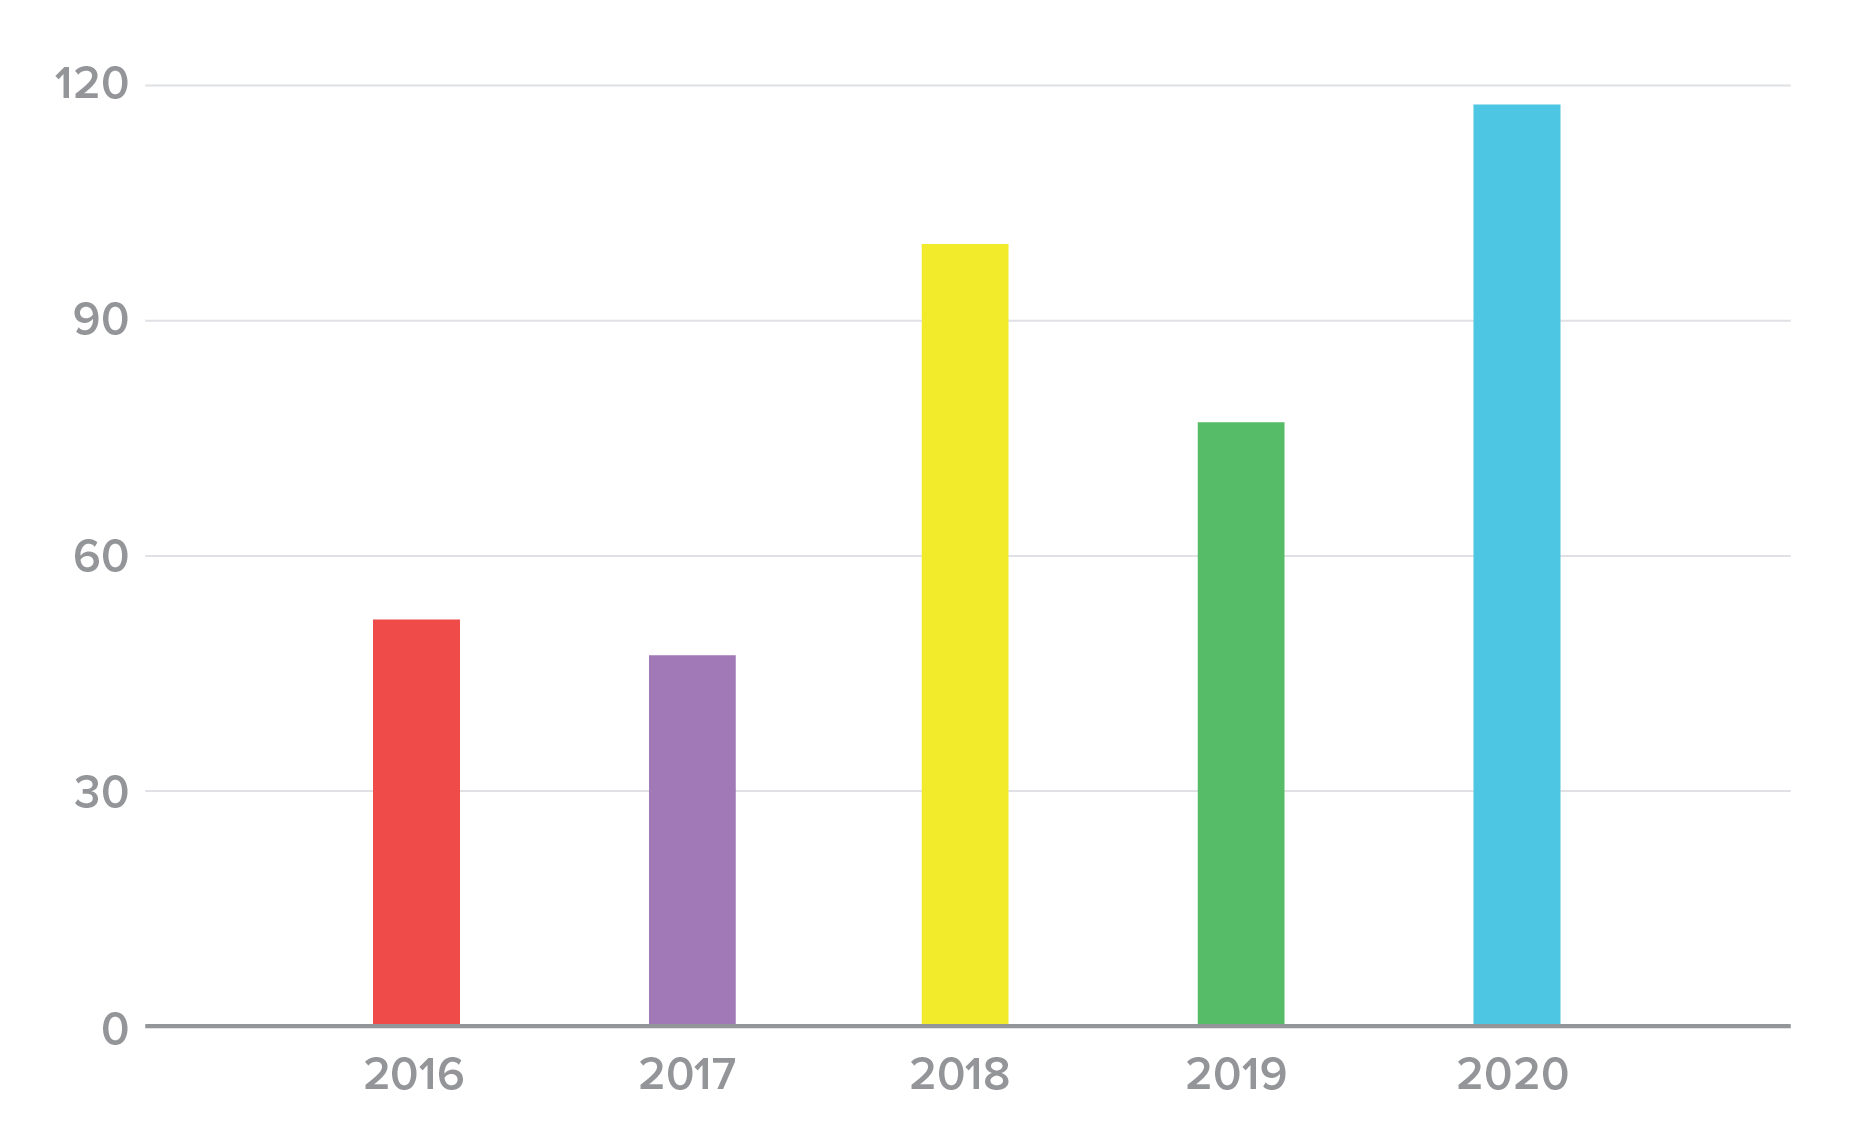
Figure 2. Number of credential spill incidents by year, 2016-2020.
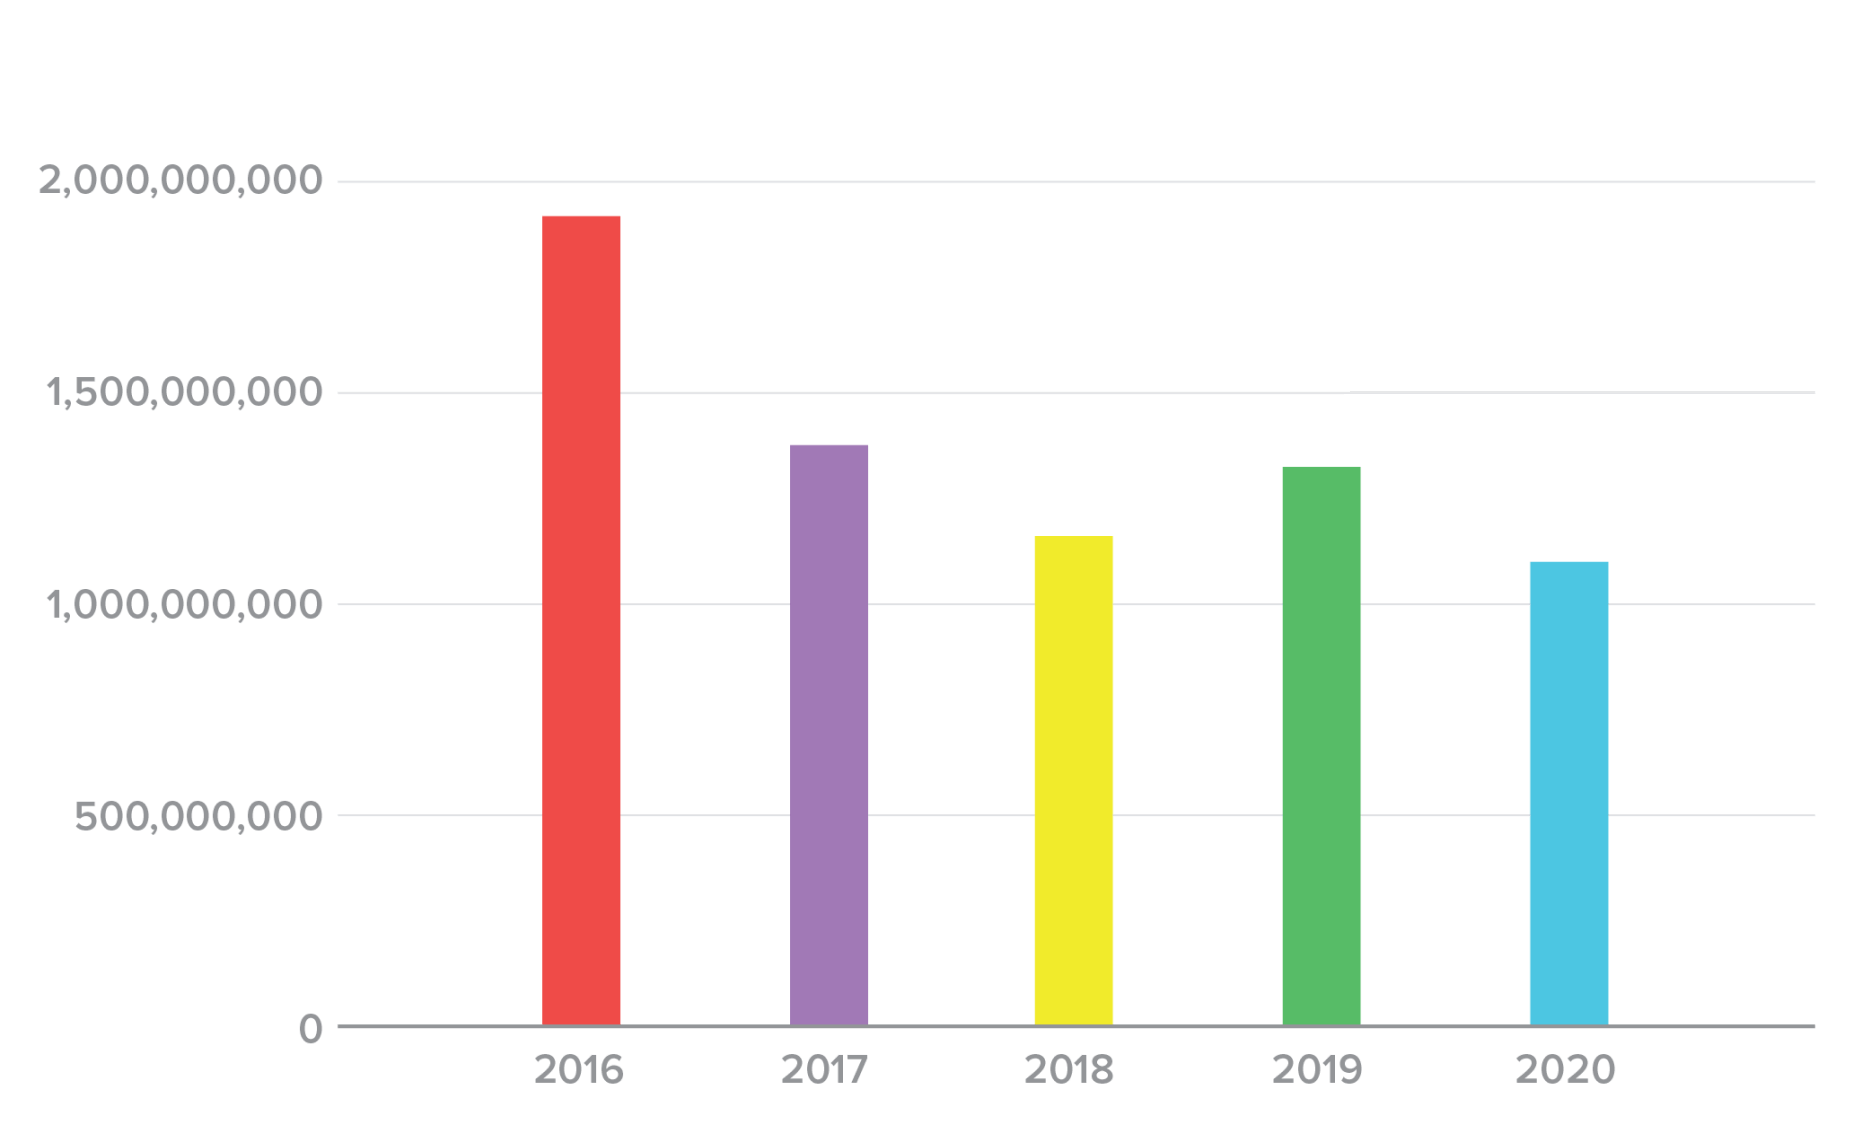
Figure 3. Number of credentials spilled by year, 2016-2020.
The distribution of spill size varied widely, which can make it hard to instinctively understand what a “normal” breach looks like. A box plot of spill size by year illustrates the problem (Figure 4). The mean and median sizes of a credential spill across all years are comparatively small, but a small number of large outliers skews the distribution. Even if we remove the top 20 outliers that contained greater than 100,000,000 credentials (Figure 5), it’s clear that a small number of large incidents are responsible for a large proportion of the total credentials spilled.
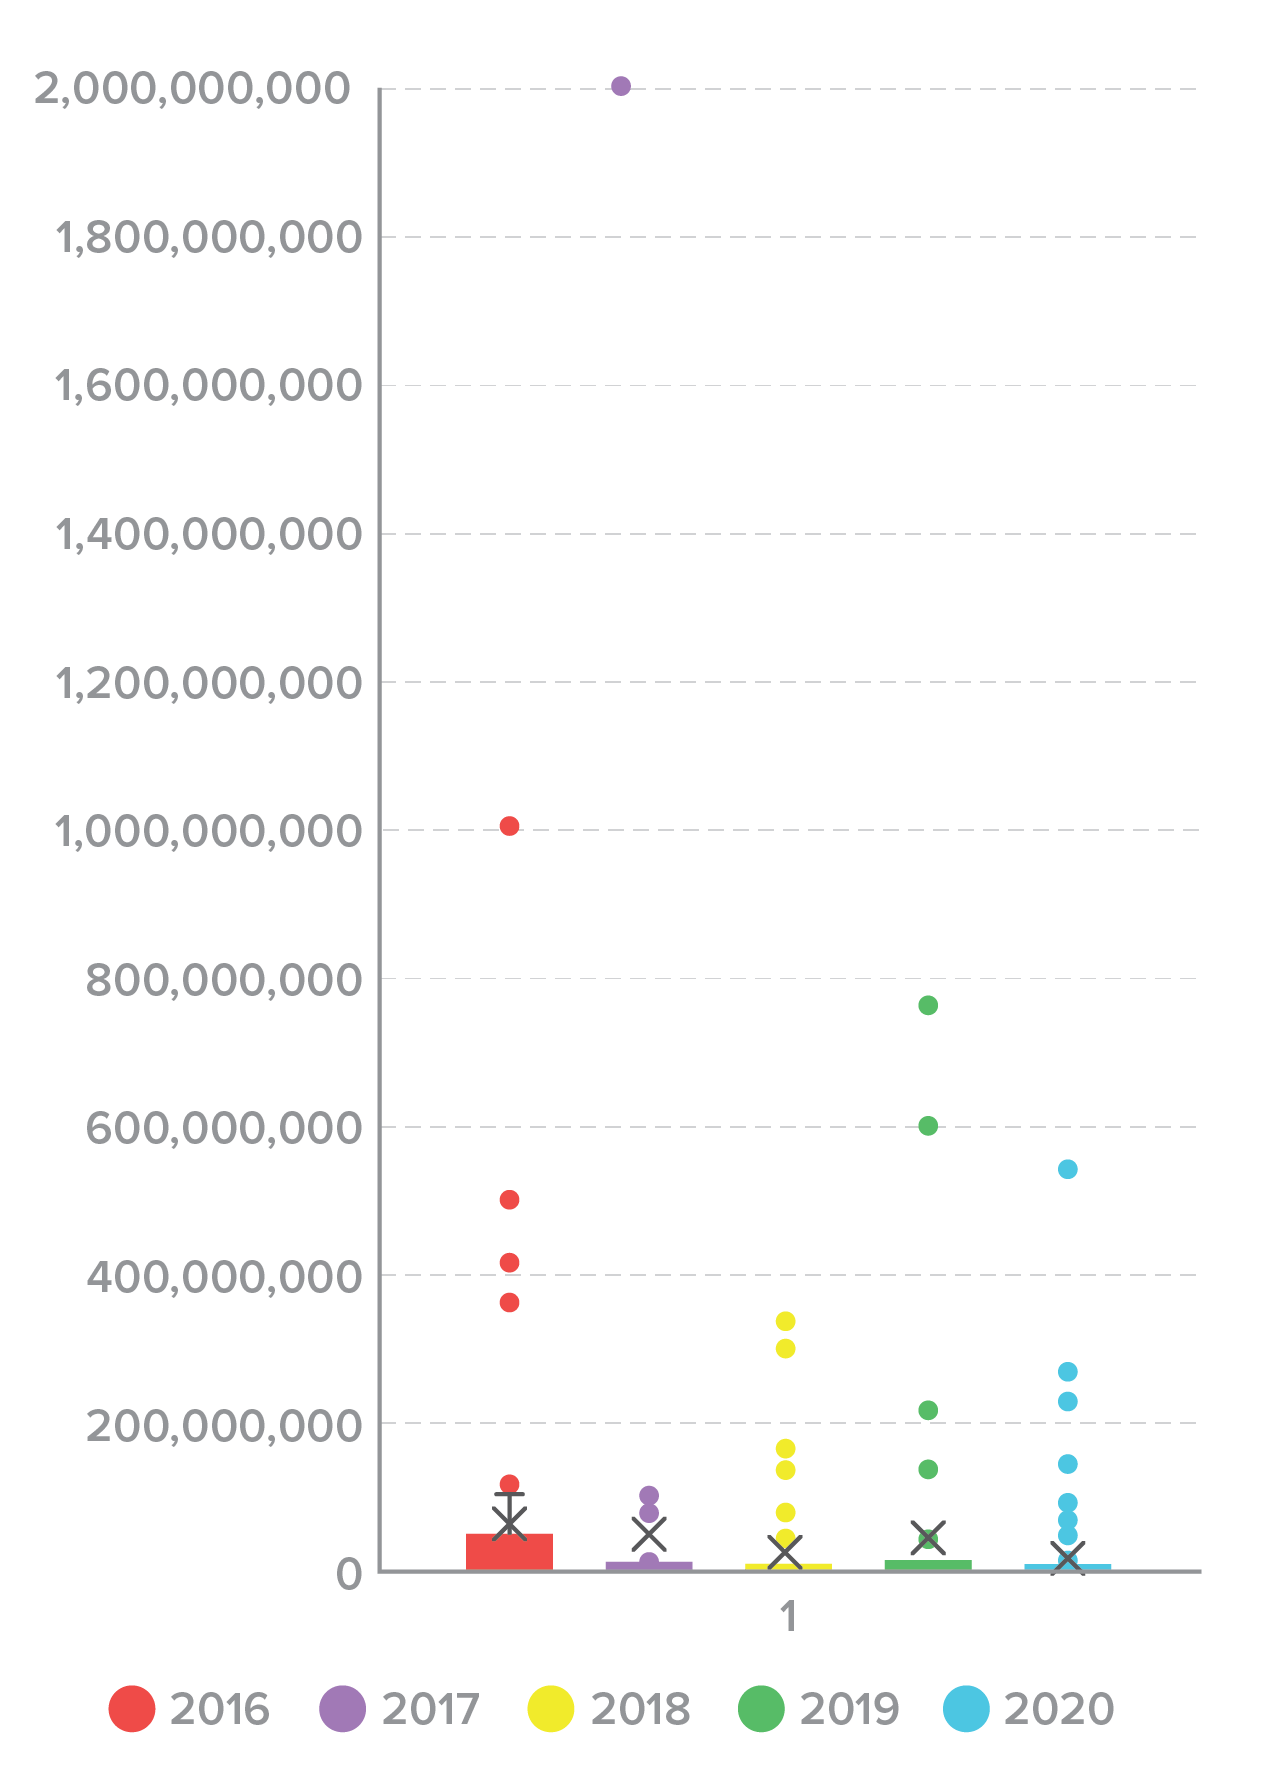
Figure 4. Credential spill size distribution, 2016-2020.
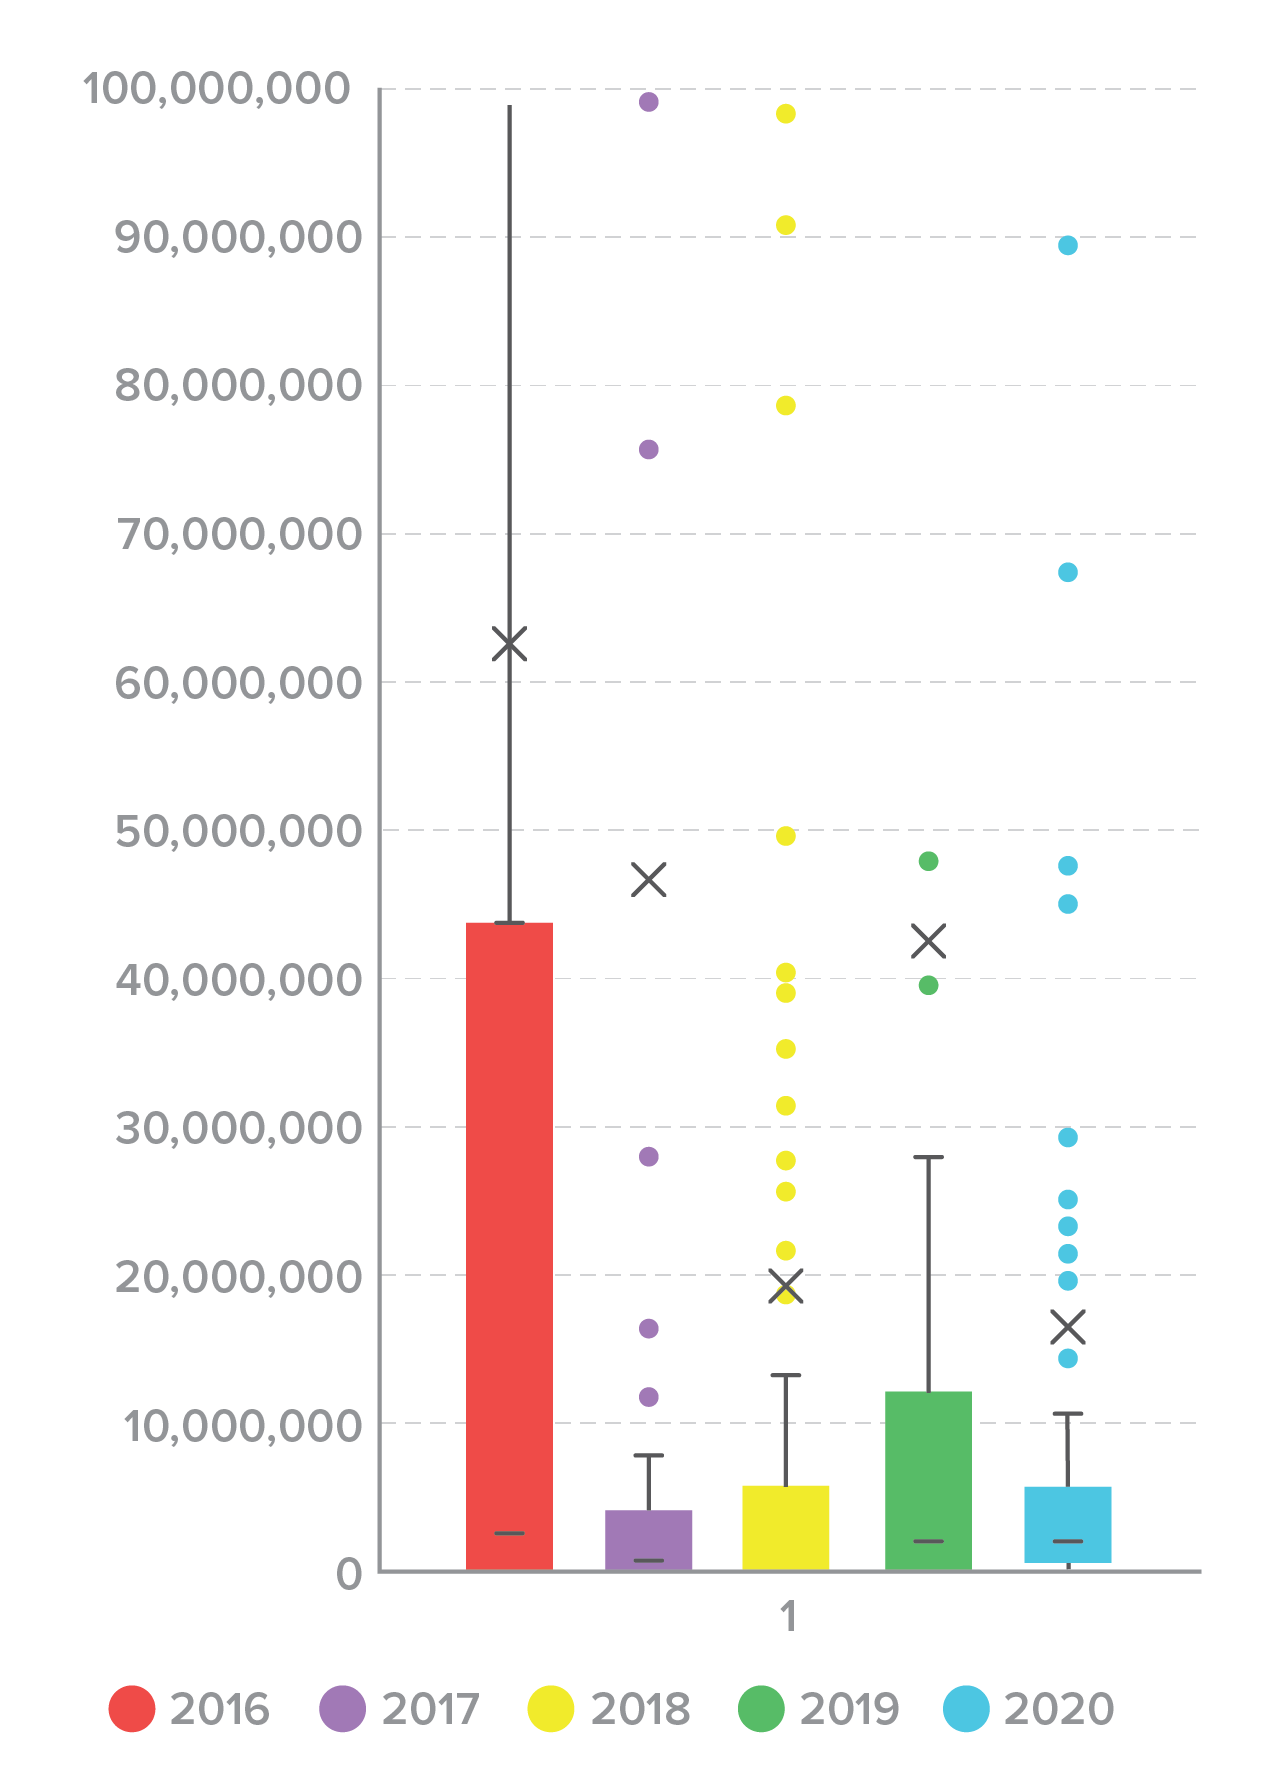
Figure 5. Credential spill size distribution by year, 2016-2020 (outliers removed)
By comparing average and median spill sizes, we can get another view of the trends. The difference between these values helps us understand the degree to which outliers on either end of the distribution distract from the tendency in the data. In each of the past five years, the average (Figure 6) has been significantly larger than the median (Figure 7), confirming our observation that a small number of large incidents was distracting attention from more “typical” spills.
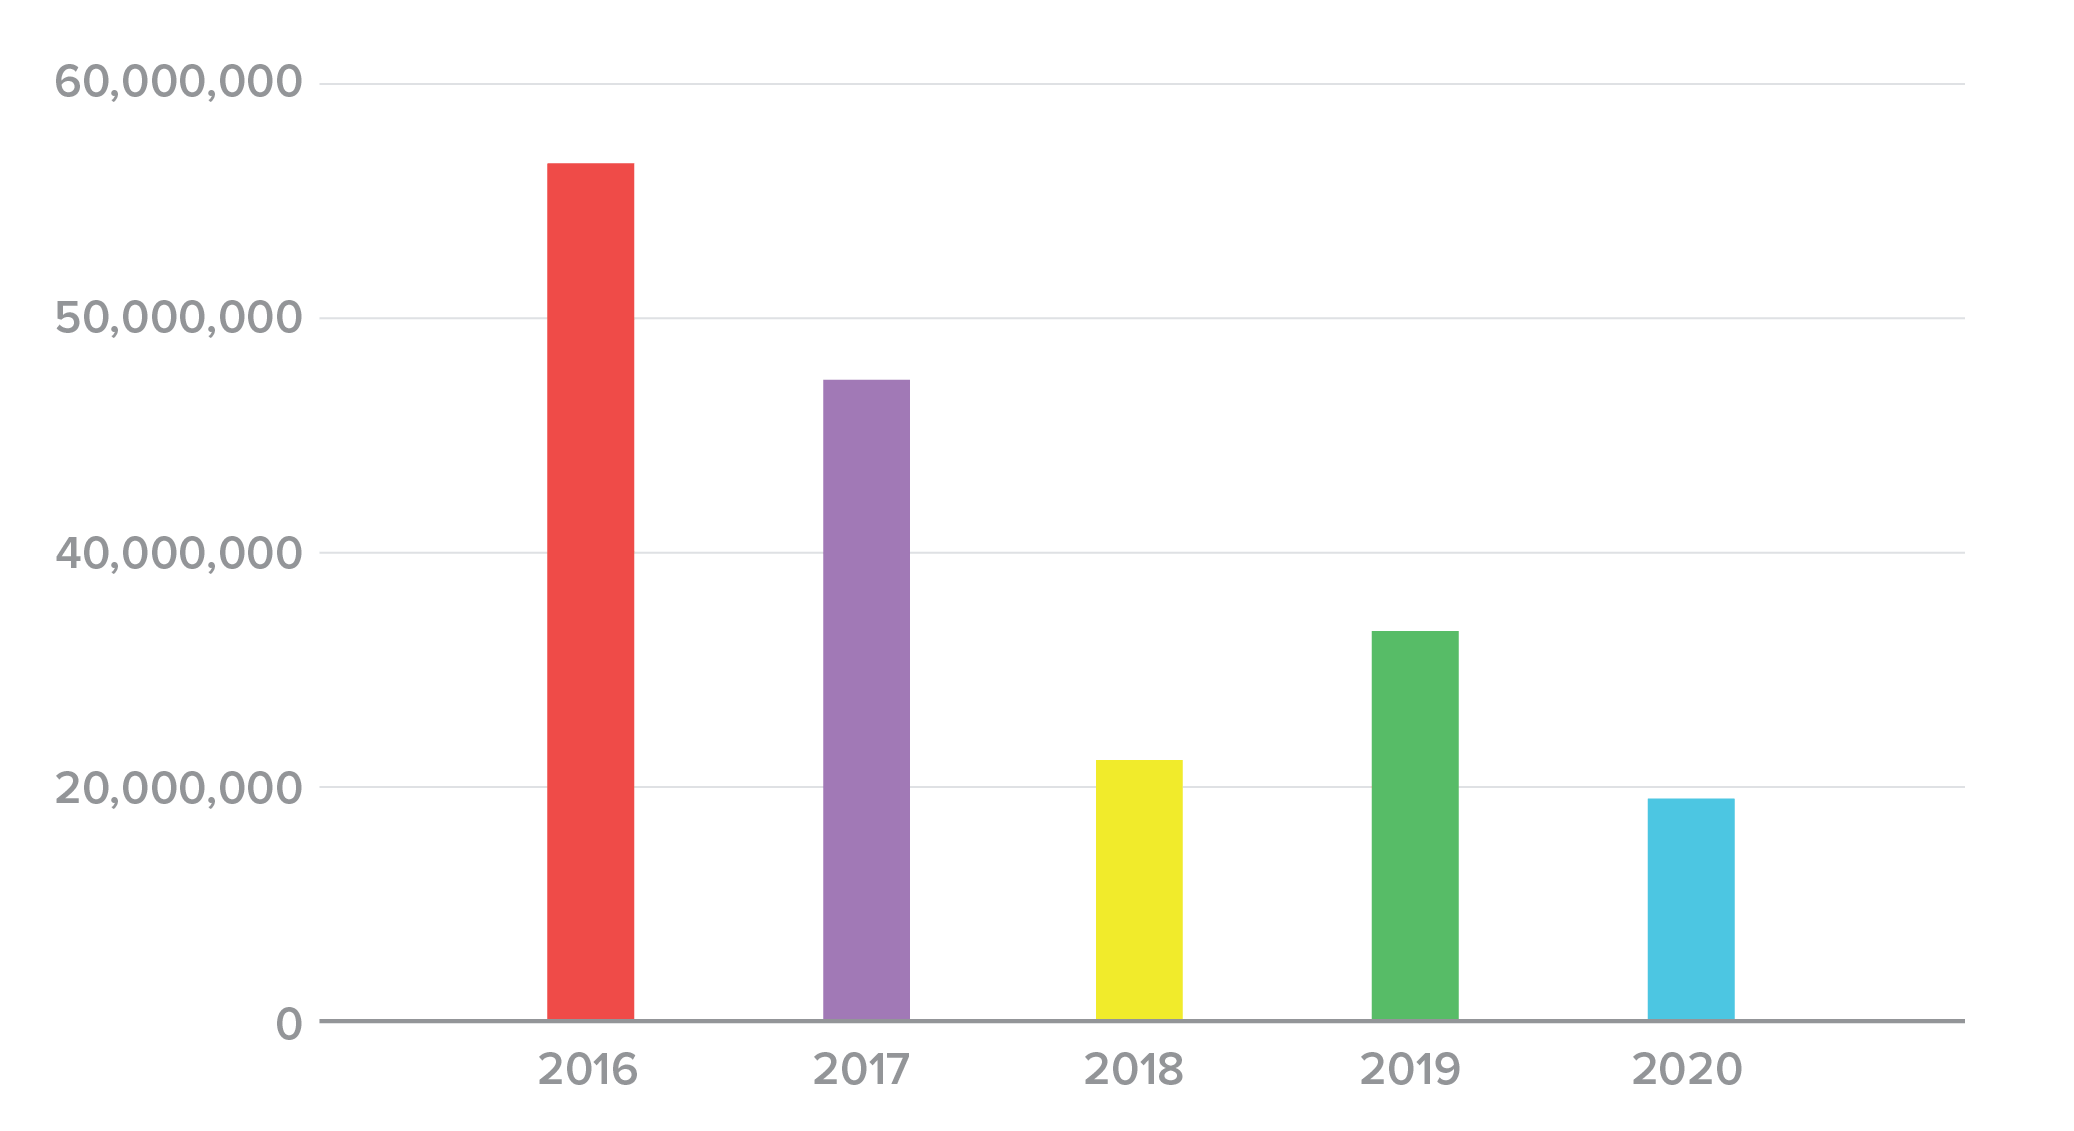
Figure 6. Average credential spill size, 2016-2020.
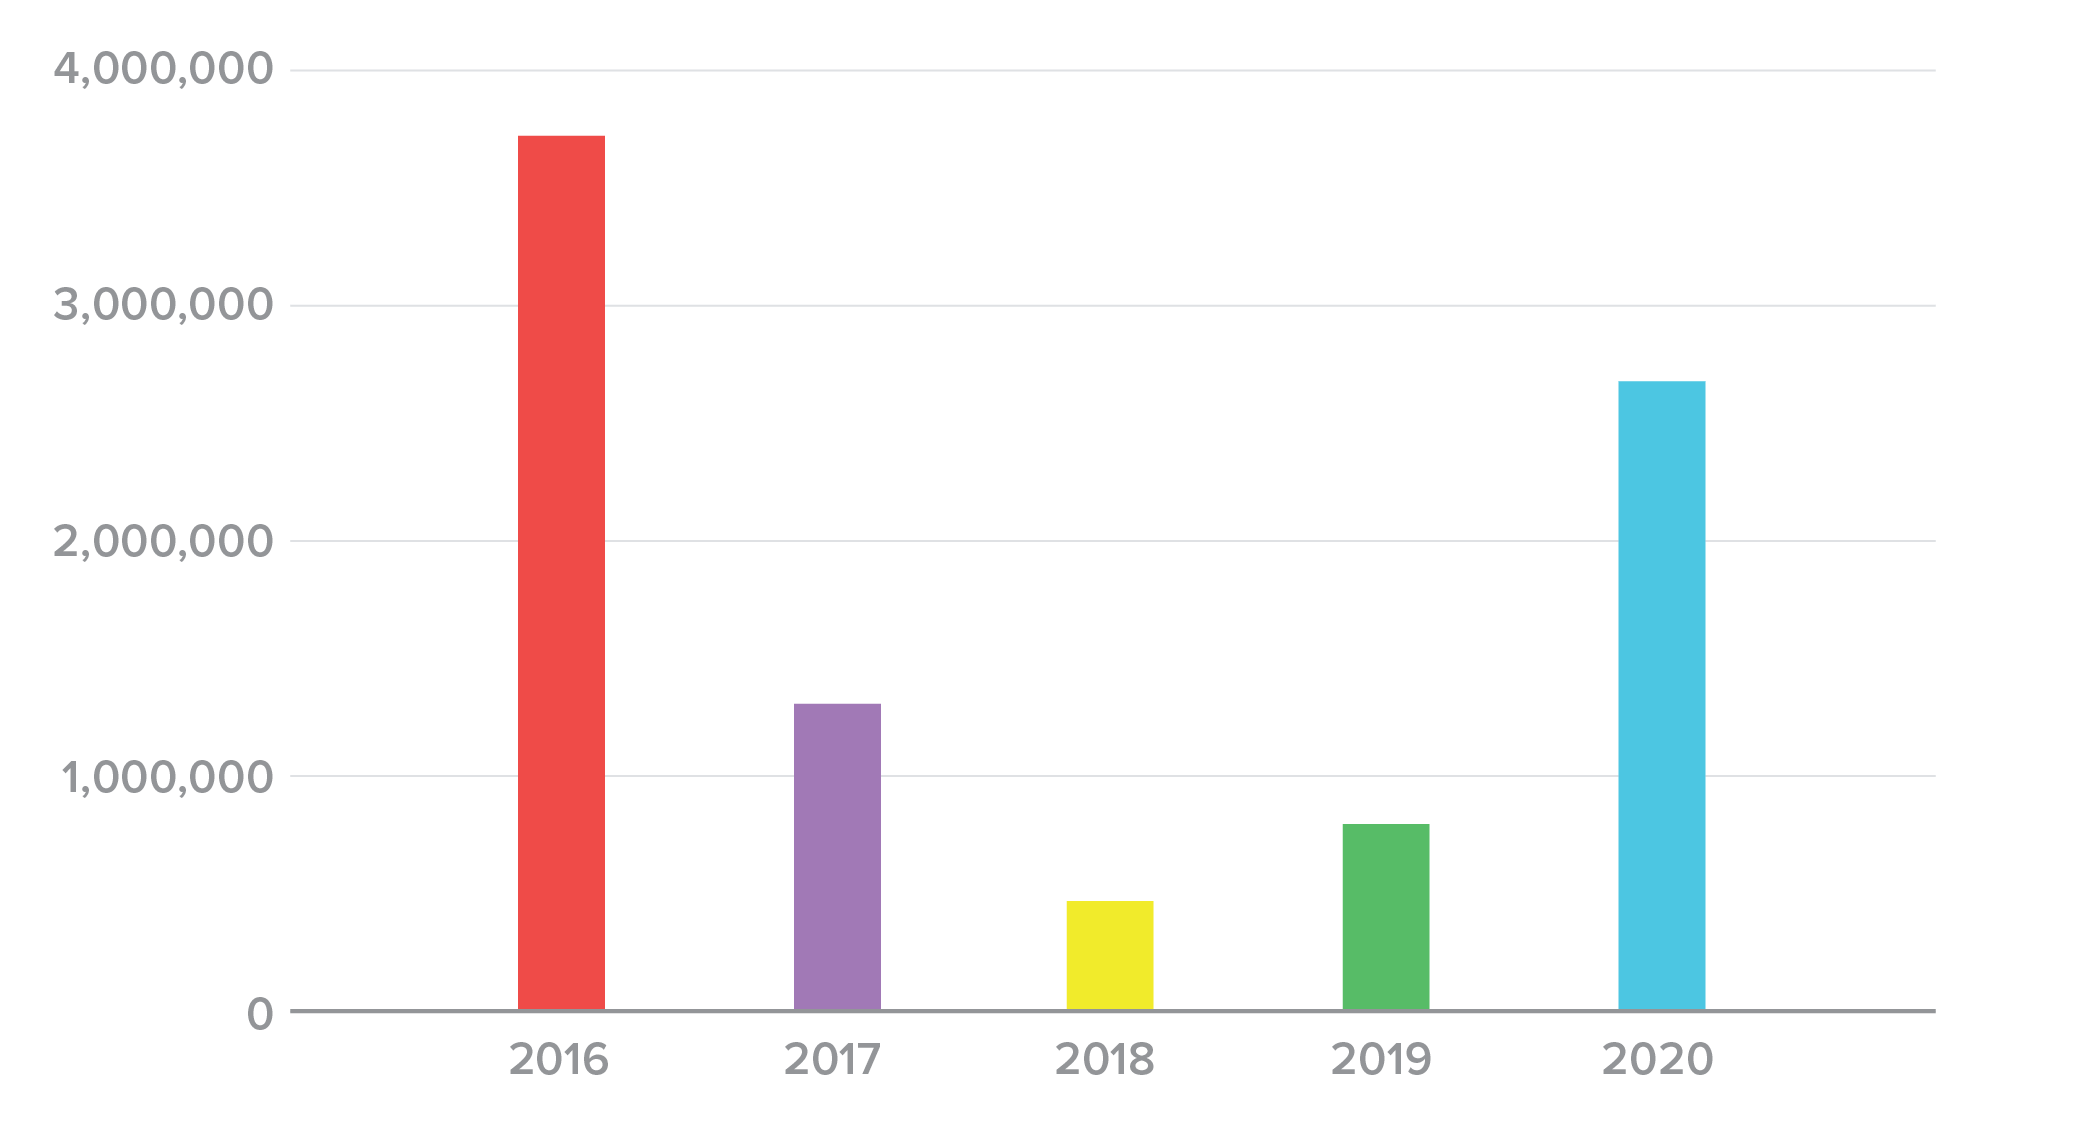
Figure 7. Median credential spill size, 2016-2020.
To check for any seasonality to credential spills, we also plotted the rate of incidents occurring (or being announced) (Figure 8) and the rate at which credentials were spilled over the calendar year (Figure 9). We noted that, for the most part, incidents tended to accumulate gradually and more or less evenly, barring a few days, such as 10/31/2020, when a large number of incidents were announced. Due to the wide variance in spill size and the apparently random timing of incidents, however, credentials sometimes accumulated slowly, and sometimes leapt up as enormous, billion-record incidents were announced. We observed no meaningful relationship in terms of dates or seasons and credential spills.
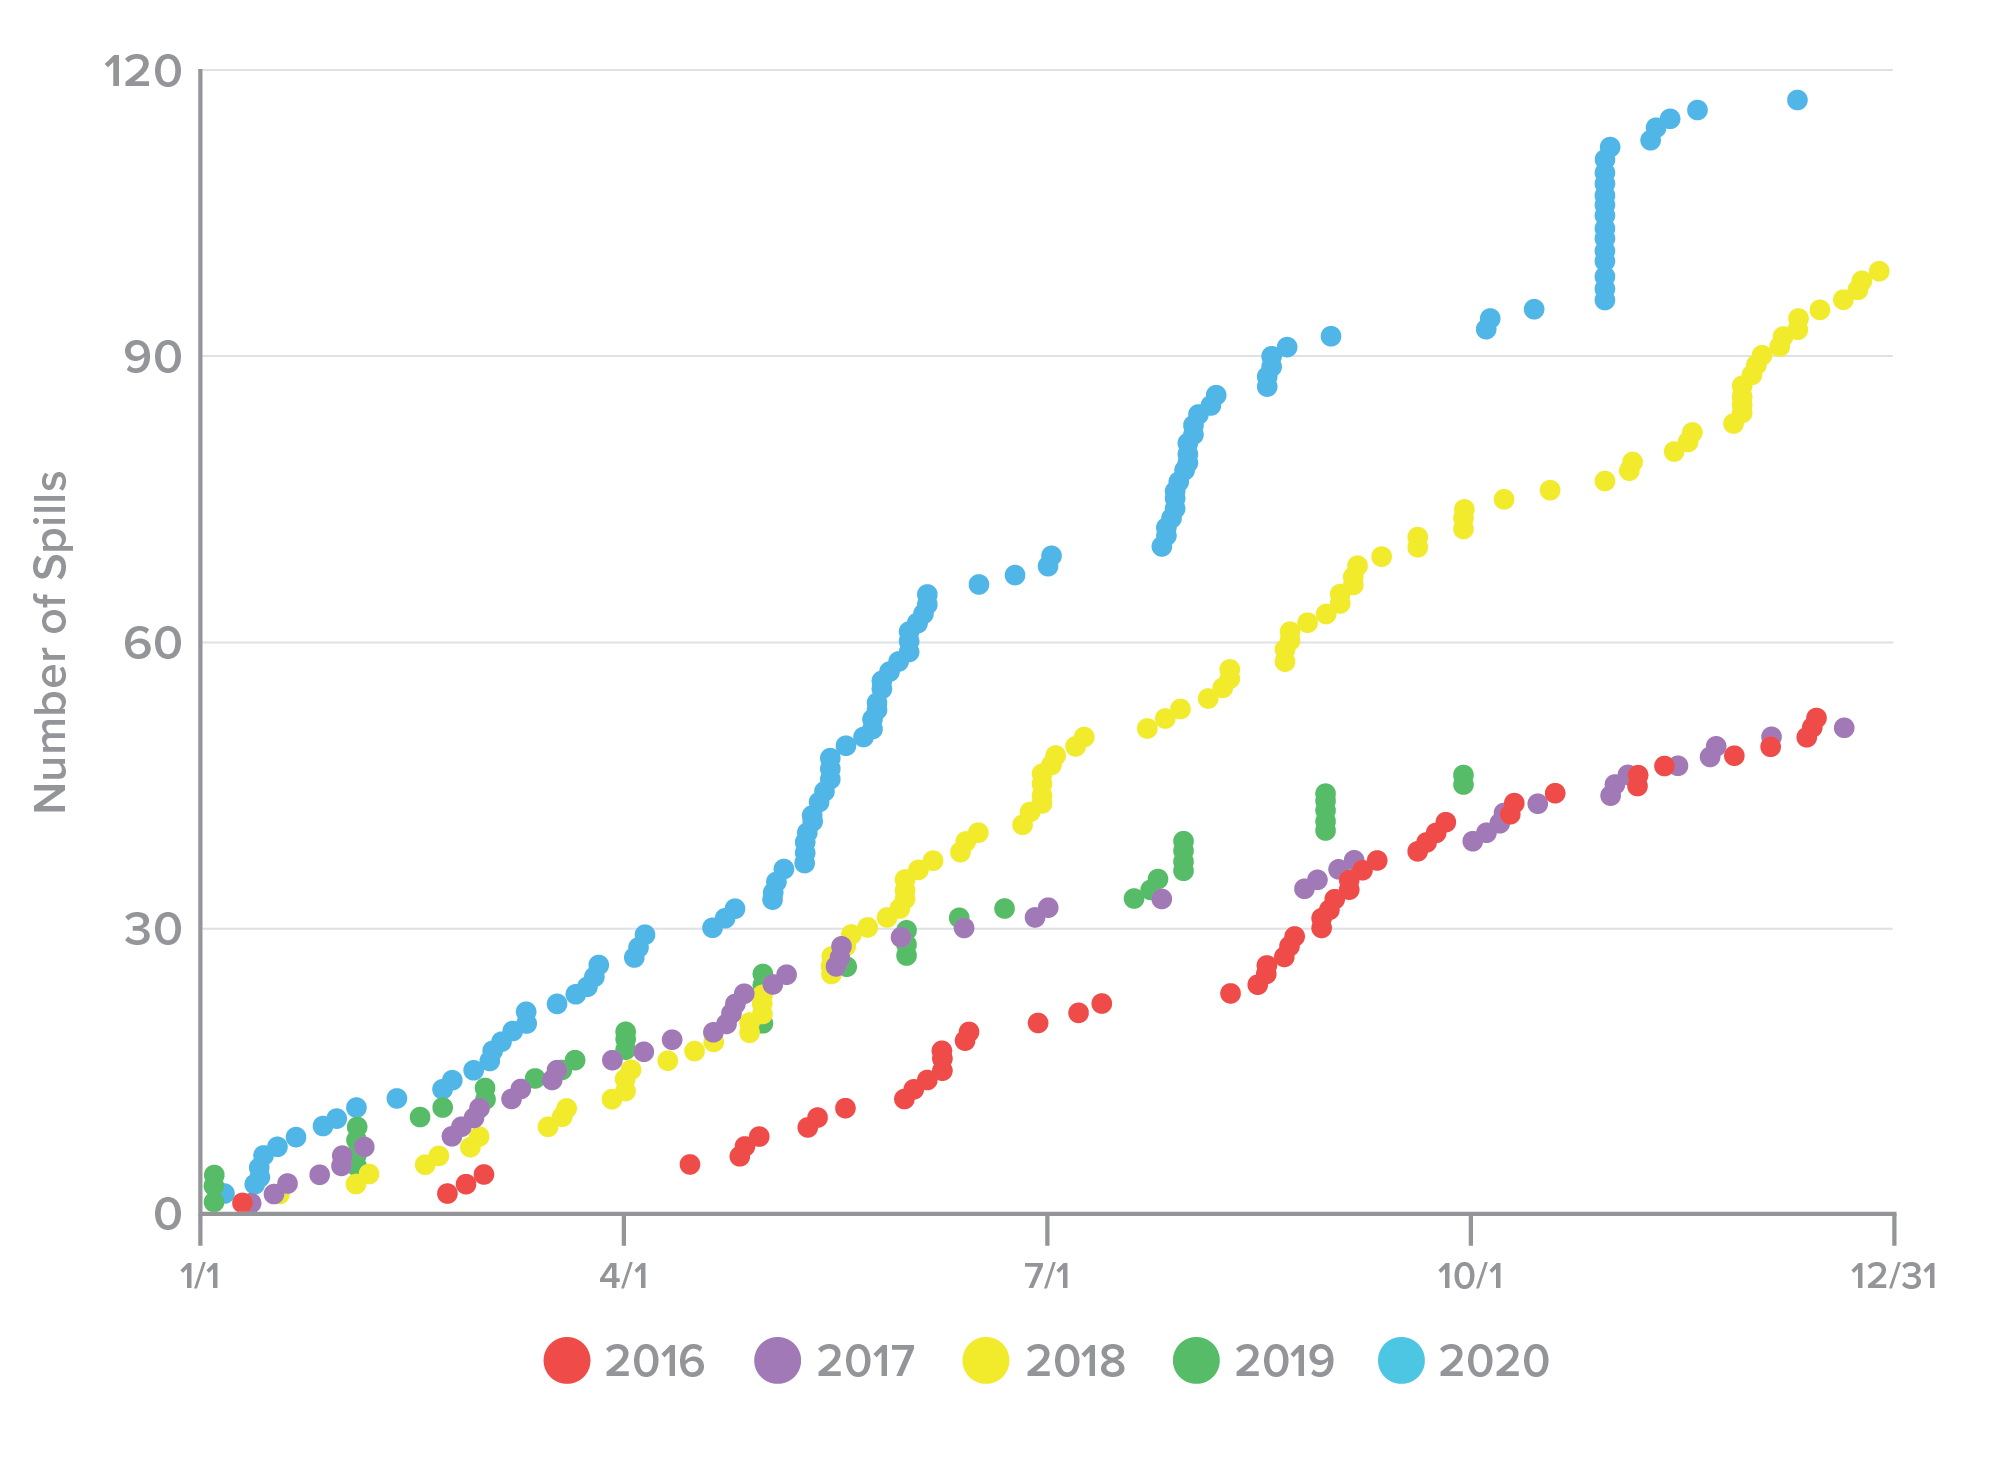
Figure 8. Rate of credential spill incidents over each calendar year, 2016-2020.
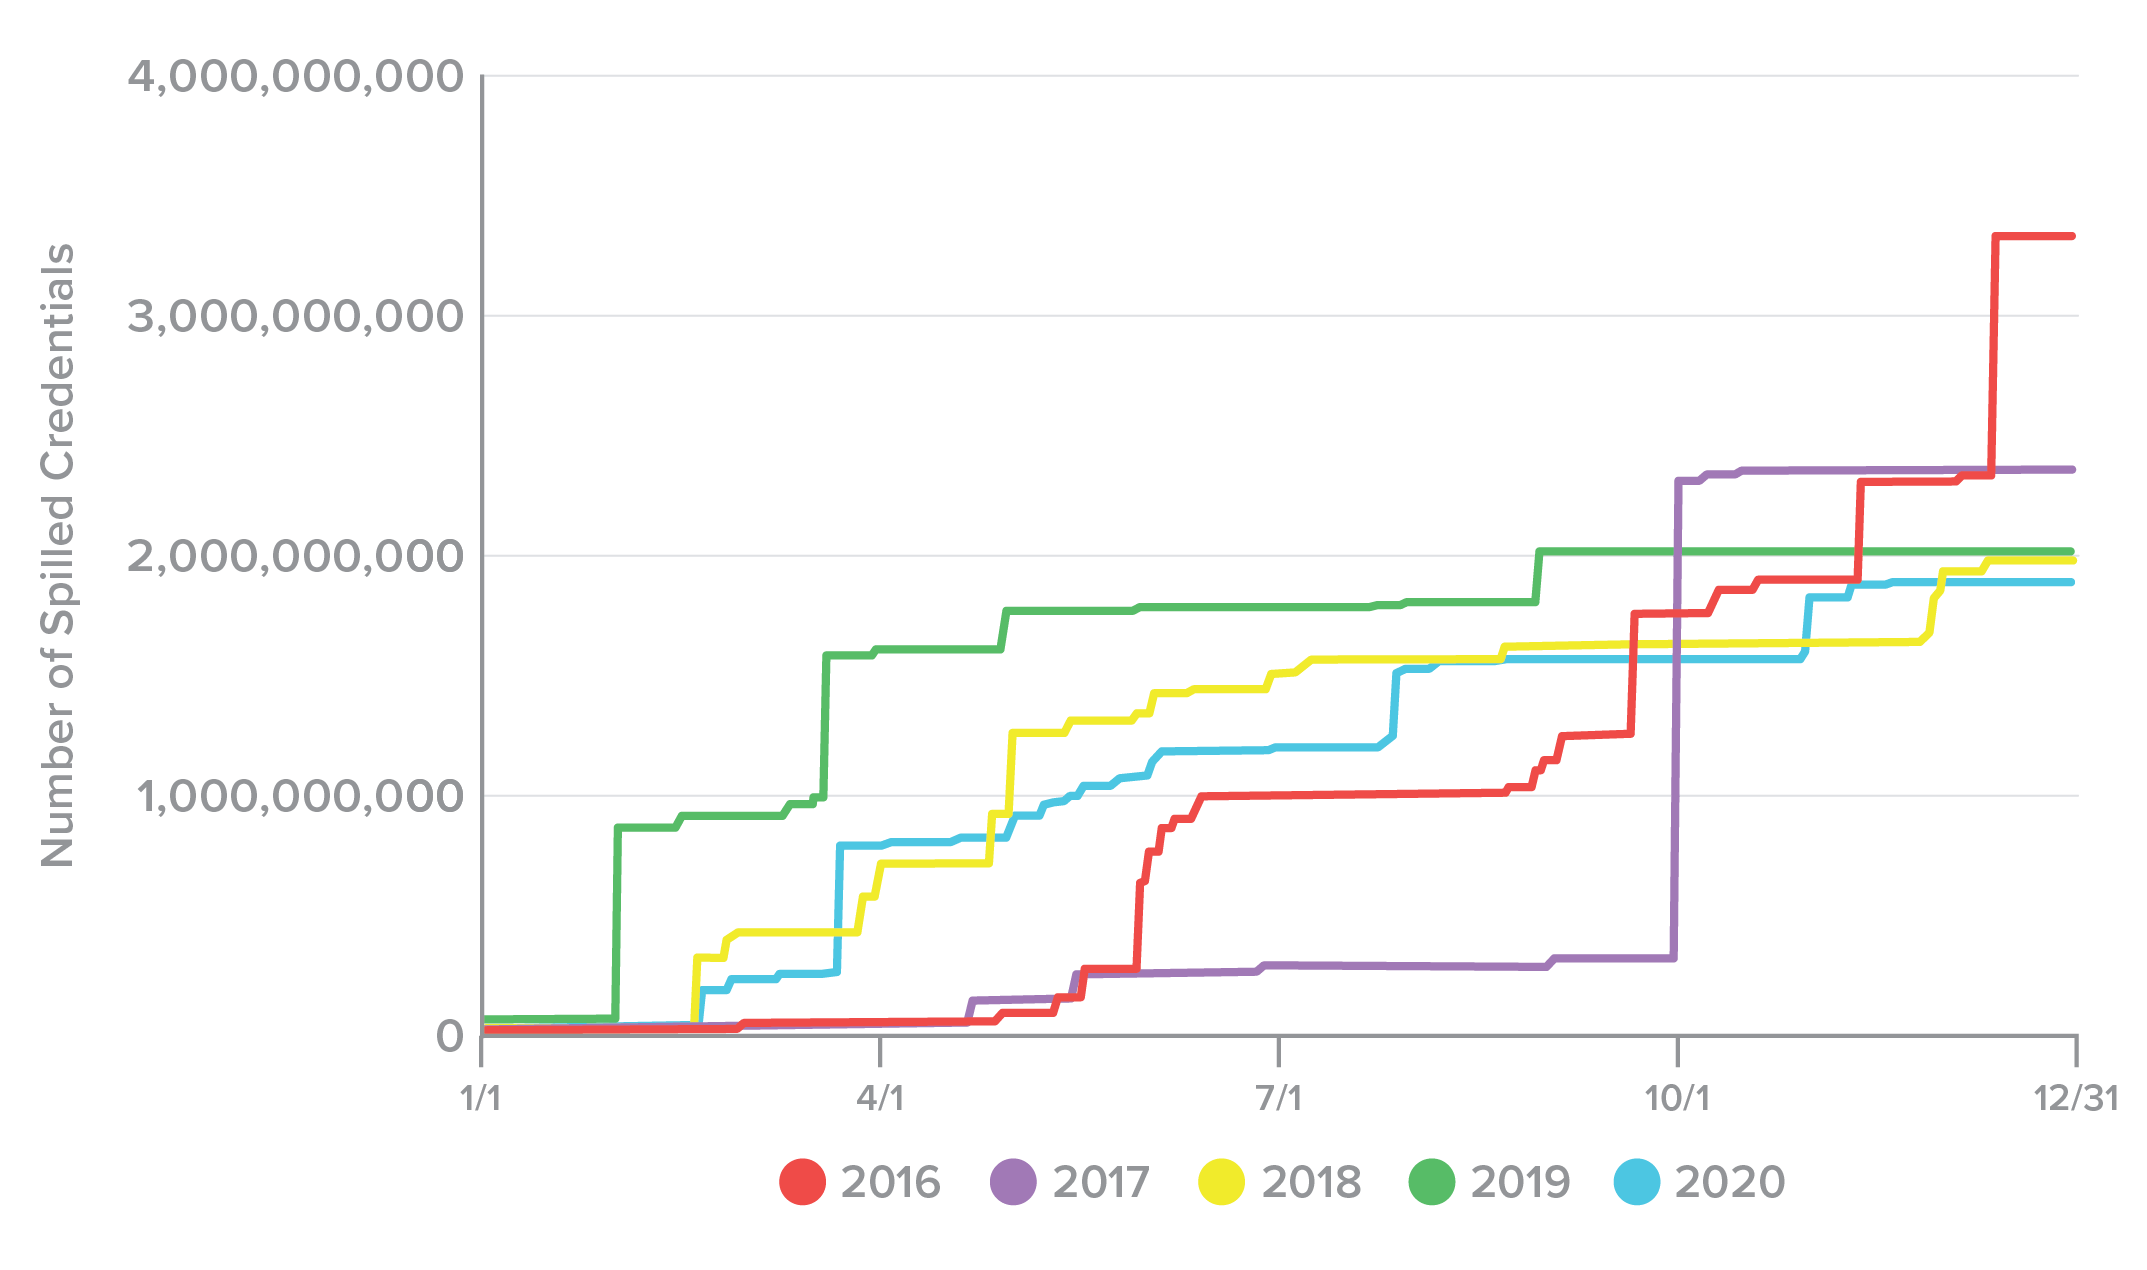
Figure 9. Rate of credentials spilled over each calendar year, 2016-2020.
In sum, the picture that emerges after examining five years of credential spills is that spills are becoming more common, but smaller. At the same time, it’s too soon to celebrate. The total number of spilled credentials in 2020 was still 1.86 billion, which is greater than the population of any country on Earth, and still more than enough for attackers to make a living from their theft, resale, and exploitation. The fact that credential spills are simultaneously becoming smaller and more frequent seems to indicate that we are seeing a previously chaotic market stabilize as it reaches greater maturity, and not that we’re winning the war.
Reasons for Credential Spills
In some of the incidents, organizations were willing and able to disclose the reason credentials were compromised. While every incident is a little different, we’ve highlighted a few here that are particularly instructive (or just frustrating). In short, there’s no shortage of opportunity, even for unsophisticated threats.
A Breach from Beyond the (Organizational) Grave
The most frustrating reason for a spill was from the now-defunct Canadian retailer Netlink Computer (NCIX). NCIX sold its servers without wiping them, leading to multiple buyers getting their hands on a treasure trove of personal data, including nearly 400,000 customers’ usernames and passwords. This should be cause for alarm. In the United States, half of companies shutter within their first five years.3 While they are in business, taking care of customer data is a legal responsibility. Once a company ceases to exist, however, it becomes much more difficult for victims to seek restitution for a data breach.
A Credential Spill Reincarnate
The award for most “meta” credential spill belongs to Light’s Hope, a gaming website. Thirty thousand users had their credentials compromised because of a successful credential stuffing attack on the forum’s administrators.
The Gift that Keeps on Giving (to attackers)
The popular forum platform, vBulletin, was still a cause for credential spills, but far fewer than in 2016-17.4 Just three web forums spilled fewer than one million credentials due to an unpatched vulnerability. Hopefully, this means that the majority of forum owners have finally realized how big the risks were (and how simple the fixes), and patched things up.
Password Security
After a credential spill, breached companies are often quick to tout the security of their password storage systems. They attempt to assuage the public by saying the passwords were “hashed” or “encrypted.” Unfortunately saying passwords were “hashed” means about as much as saying your box of cereal is “natural”—not much. Protecting passwords requires a combination of design decisions and good implementation, and not all organizations get that right. In this section, we’ll do a quick refresher on good practices for password storage, and follow it with an analysis of what we know about how some of the spilled passwords were stored.
To begin, the worst possible thing an organization can do with passwords is store them in plaintext (that is, unencrypted). This allows attackers to compromise a database and immediately weaponize the credentials.
Because it is neither necessary nor desirable to ever see users’ passwords, the best thing an organization can do is use a one-way hash to transform the passwords into a bit string before storing them. In theory, this would be difficult for attackers to reverse engineer. Unfortunately, because consumers often use passwords like “password” and “12345,” attackers can quite easily and quickly crack many hashing functions using a tool called a “rainbow table” of precomputed hashes for common passwords.
One important step organizations can take is to salt the passwords before hashing them. This entails appending a unique string of characters to the end of a password and hashing the compounded result using the associated algorithm. Now, instead of taking seconds to crack millions of passwords, it could take weeks or months, even years, depending on the hashing algorithm used. Adding to the work needed to monetize an attack makes it more costly, and therefore less likely.
A function like bcrypt has the advantage of having the salting functionality built in. It took one security researcher five full days to crack just 4,000 passwords that had a bcrypt work factor of 12.5 That’s less than 0.1% of the six million passwords he tried to crack. Furthermore, those were only the “weakest” passwords, like “123456” and “password.” It would have taken multiple years to crack the whole list.
However, protecting passwords is a holistic problem and requires a multipronged, detailed approach. Using a salt does not help if an organization chooses a poor hashing algorithm in the first place. So with that said, let’s see what we can discern from the incidents over the past few years.
MD5 has been considered weak and poor practice for decades, salted or not. We’re not going to conclude based on this that MD5 is a good choice in any case. This underrepresentation of MD5 could simply be because the kinds of organizations still using a widely discredited algorithm tend to have smaller stores of data. It is tricky to understand the mechanisms of causality, and the data here represents a partial view, so we certainly don’t recommend any organization downgrade or weaken existing hashing practices based on this.
Conversely, the fact that bcrypt figures significantly in both the number of incidents and spilled credentials, particularly in 2020, should not be taken as a sign that bcrypt is a poor choice. Instead, this might be a sign that bcrypt has emerged as one of the de facto standards in password hashing, partly because it incorporates a salt by default, and partly because it is a slow hash, which makes it significantly more difficult for an attacker to crack the hashes offline than a fast hash such as SHA-2.
Over the last three years, plaintext storage has been responsible for the greatest number of spilled credentials (42.6%)
Another hidden variable at play in password storage is that most of these algorithms provide great latitude in terms of configuration, depending on the needs and constraints of the system with which it is intertwined. While it is possible to configure some strong algorithms like the SHA-2 family or bcrypt so that they are less strong, it is not possible to configure MD5 so that it is strong enough. The subtle details of password hashing are beyond the scope of this project, but we do know that plaintext storage is a transparently horrible idea, and MD5 is only slightly better.
Spills by Time to Discover
As noted in “How Do We Know About Credential Spills,” many organizations learn that their credentials have been spilled and are up for sale from external sources, like security researchers or dark web monitoring services (Figure 14). Other than the fact that this places organizations at a disadvantage in terms of incident response, this lag also provides attackers with a glorious window in which they can use credentials for fraud with relative impunity, as we’ll discuss in “The Lifecycle of Spilled Credentials.”
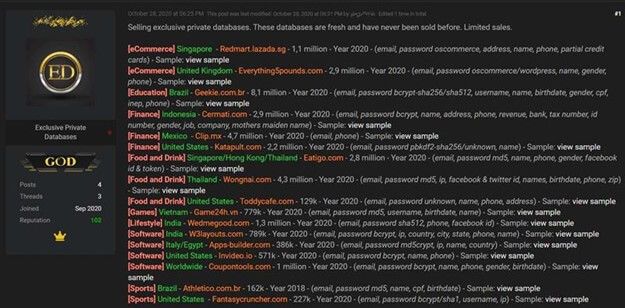
Figure 14. Databases for sale (Credit: Bleeping Computer).
Organizations’ inability to detect their own breaches skews the way that we have traditionally thought about “time to detect.” Occasionally, however, we can find out both when a spill actually occurred and when it was discovered for sale. This allows us to analyze these lags in detection and reporting, and shifts our thinking about credentials spills to “time to discover” instead of “time to detect.”
Of the 96 incidents in this data set with enough information to differentiate between incident date and date of discovery, the average time was 327 days, and the median time was 120 days (Figure 15). In other words, the 50th percentile of discovery time was at four months, and an equal number of incidents, 48 each, were discovered in more and less time than this. Ten incidents in the data had a discovery time that exceeded three years, and the longest delay was 2,335 days, or six-and-a-half years. While many organizations detect credential theft as soon as it happens and disclose within a day or two, many clearly do not.
the median time to discover spilled credentials across 96 incidents
120 DAYS
We anticipate that this discovery method will increasingly become the norm, as darknet monitoring services become more common and skilled. Given how quick attackers are to weaponize stolen credentials (more on that in the next section), services like this are the only hope of closing that glorious window for attackers, unless organizations can improve their internal detection capabilities.
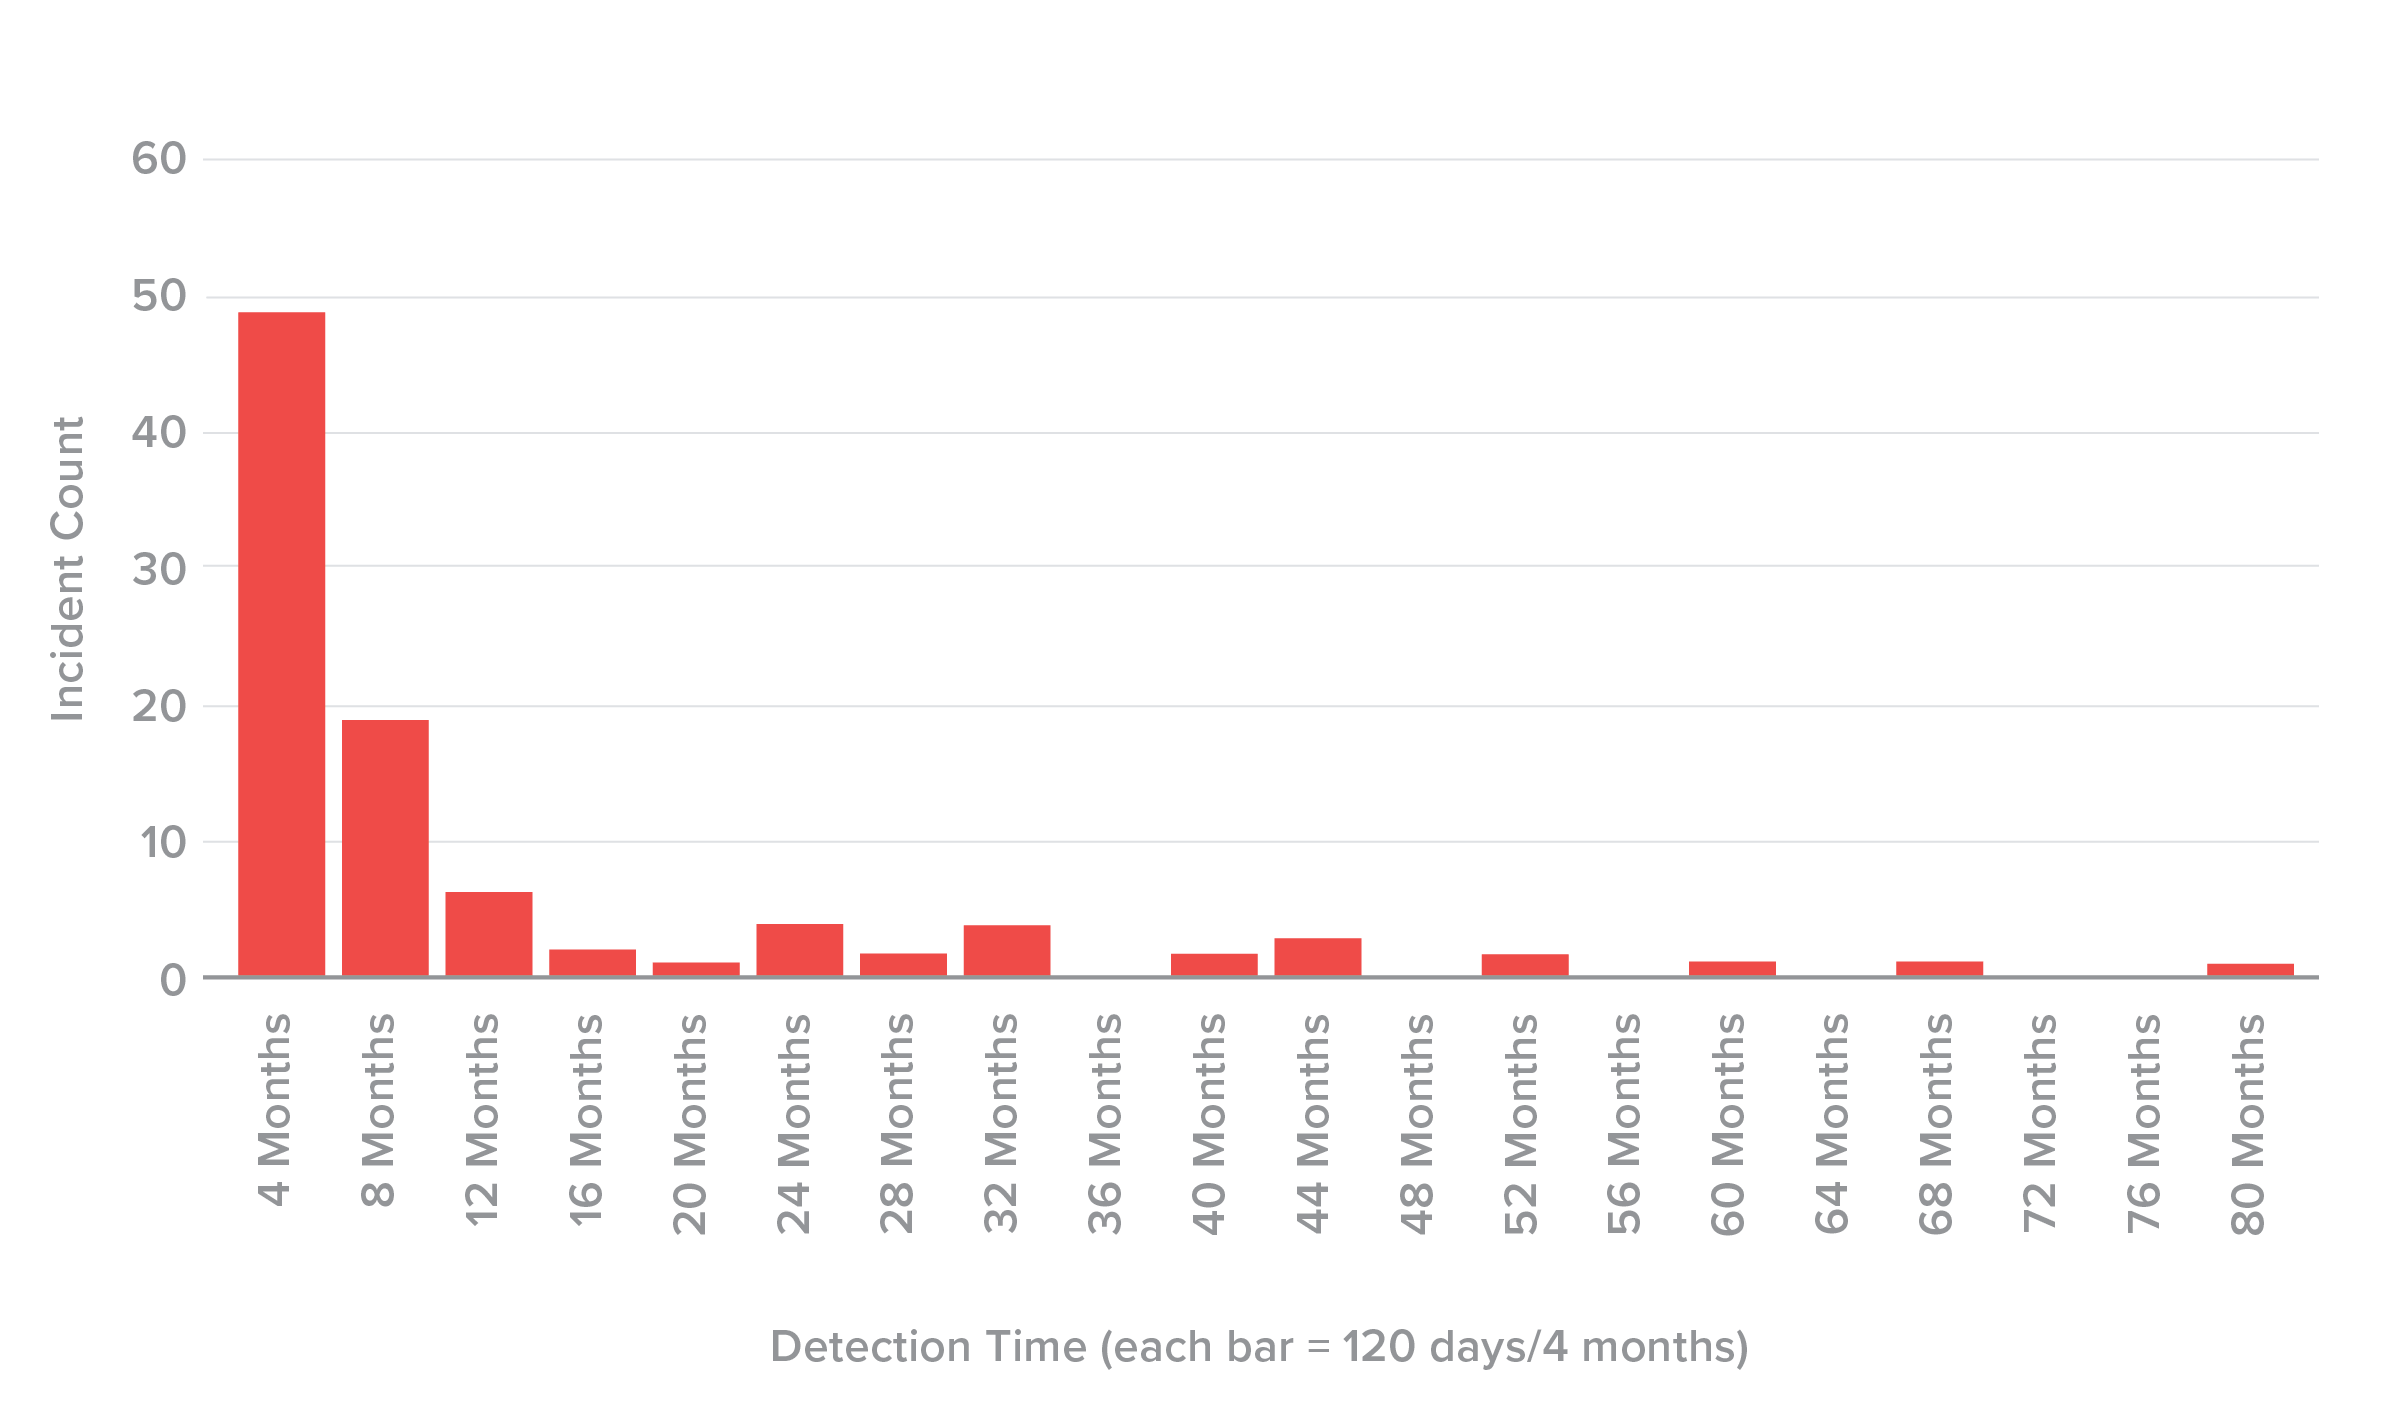
Figure 15. Time to discover spill histogram (bin width = 120 days, n = 96).
The Lifecycle of Spilled Credentials
Methodology
In the 2018 Credential Spill Report, we found that it took an average of 15 months for a credential spill to become public knowledge. Over the last three years, organizations have improved at discovering and reporting credential compromises. As noted in “Spills by Time to Discover,” the average time to discover was about 11 months, though this number is skewed by a handful of incidents in which the time to discover was three years or longer. The median time to discover was about four months.
Oftentimes, the announcement of a spill closely coincides with the credentials appearing on dark web forums. This is not a coincidence, as the two events are usually related through one of two mechanisms: either an organization is alerted to the credential theft when they are posted on the dark web, or an organization’s announcement alerts attackers that the window of opportunity to use the credentials is closing. Attackers know the success rate of the passwords diminishes quickly as consumers reset them, so once the announcement goes out, they will try to sell them quickly before the price completely bottoms out.
Of the 2.9 billion credentials that were used against the four sites in a year, nine hundred million, or nearly one in three, had been compromised in Collection X
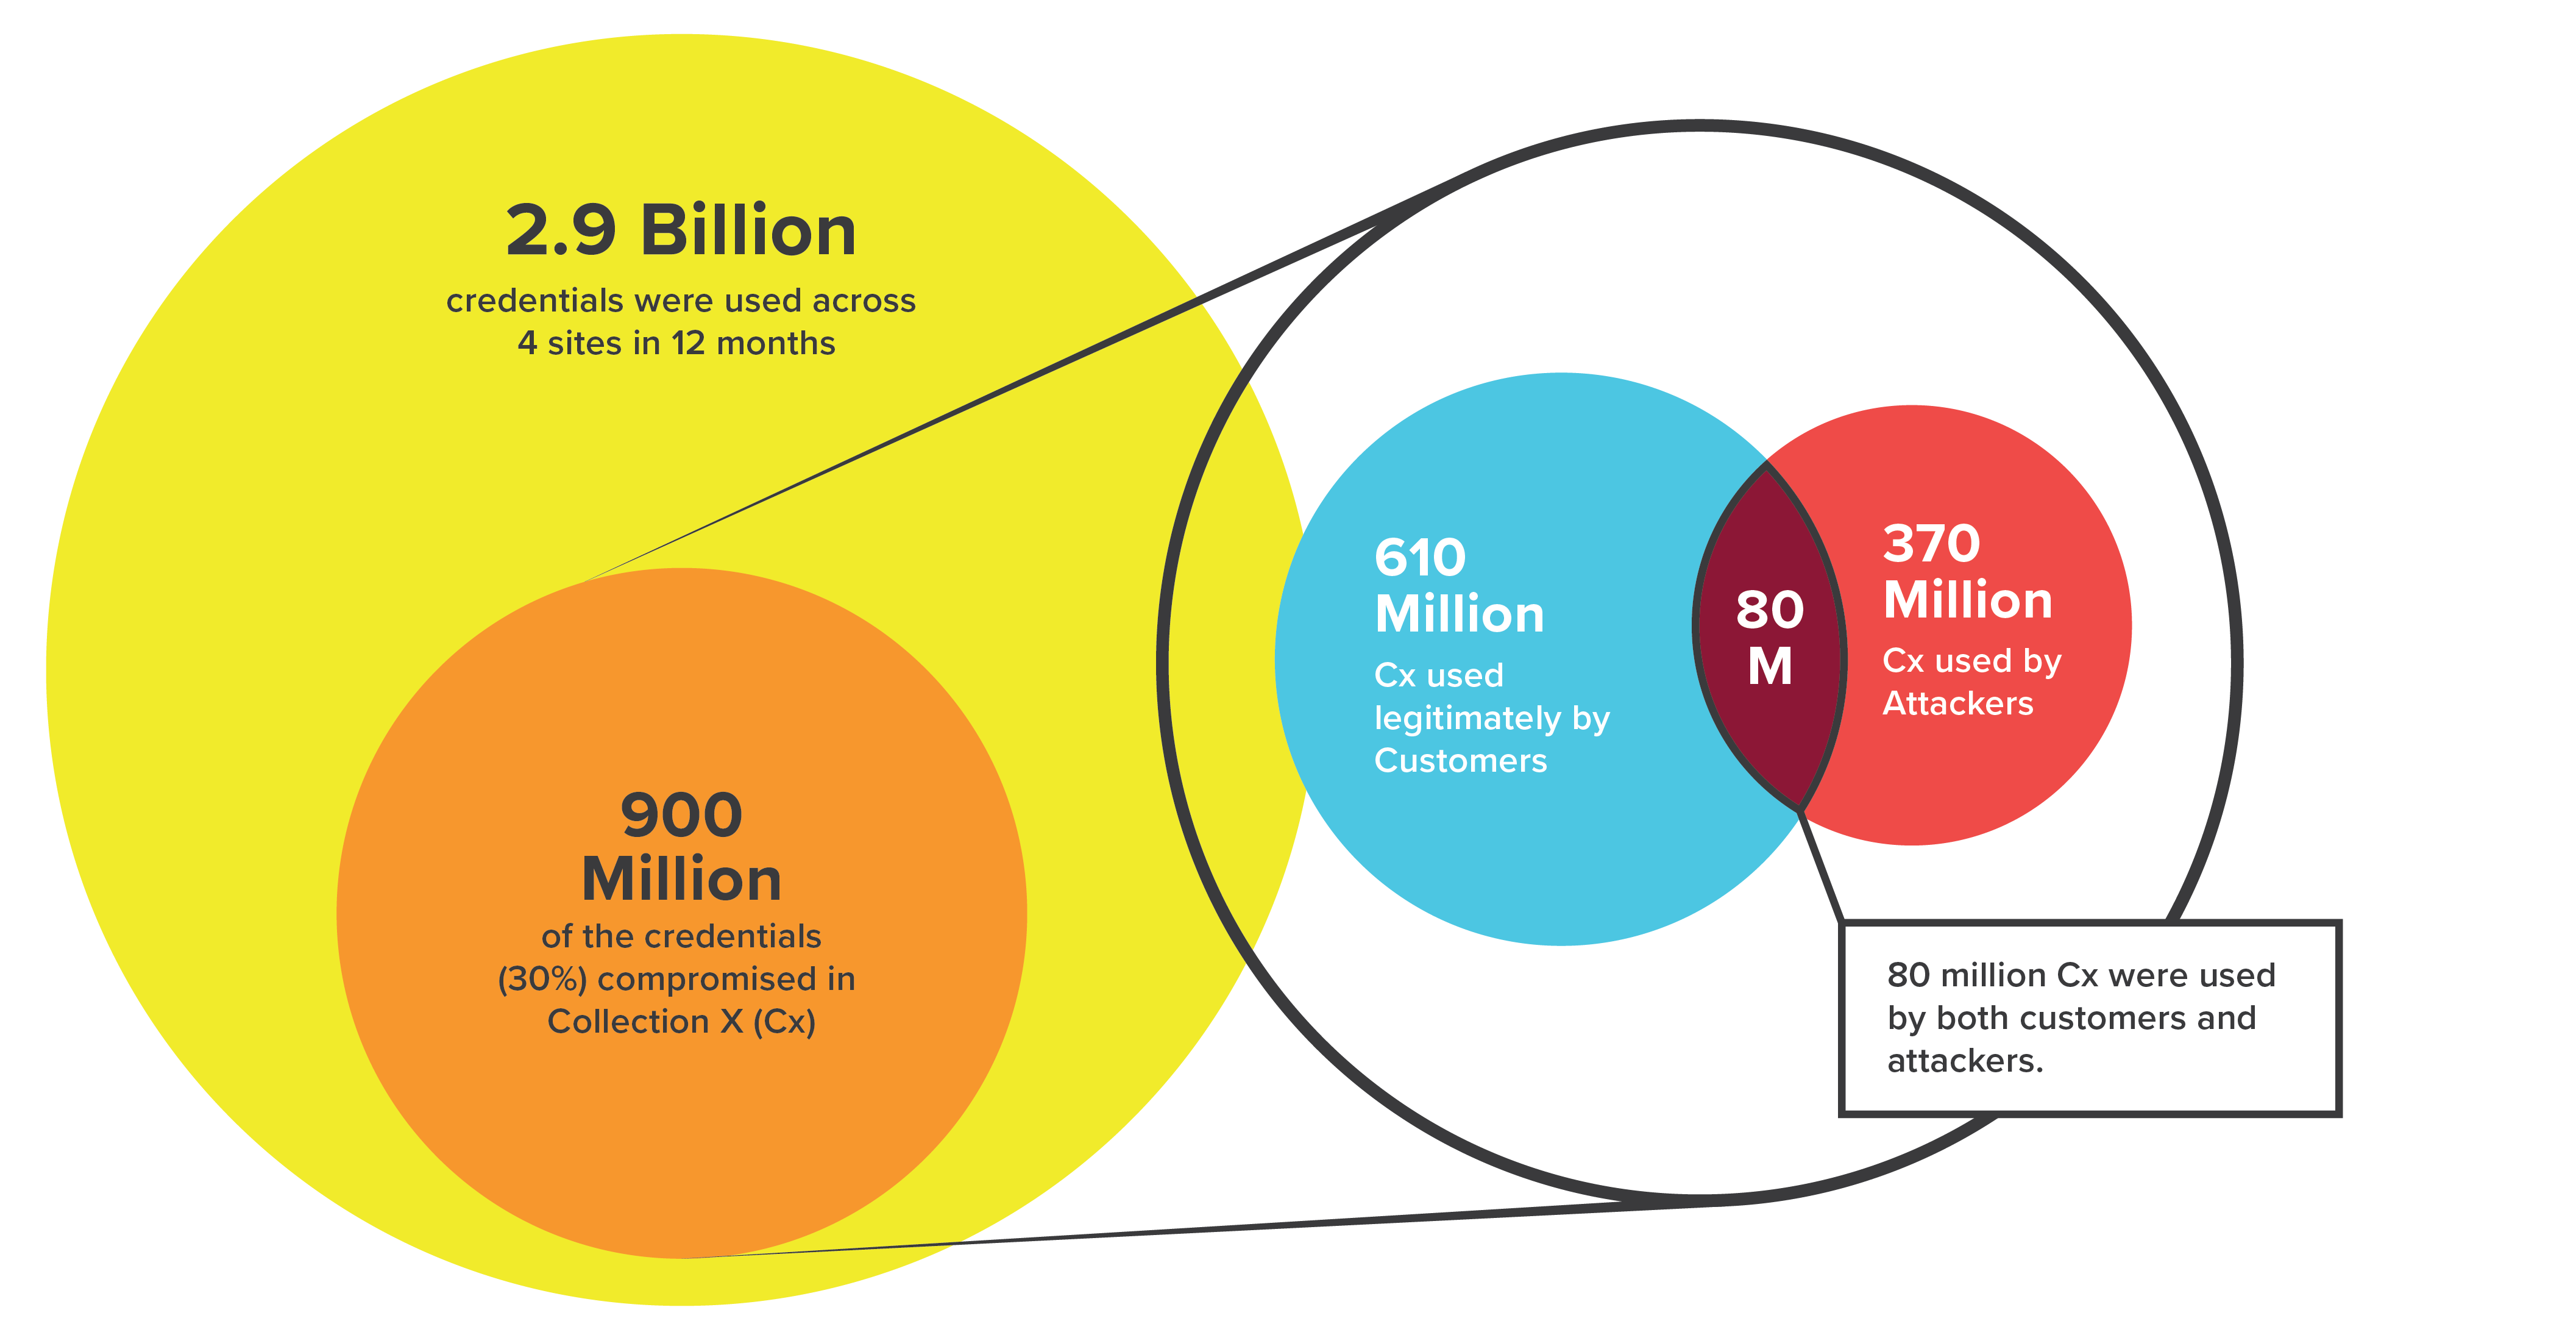
Figure 16. Consumer or criminal? In Collection X, one out of three logins to customer sites over 12 months had been compromised.
That still leaves an important question unanswered: what exactly is happening in that crucial period between the theft of credentials and their posting on the dark web? To answer this question, we conducted a historical analysis using credentials from Collection X.
As noted in “The Credential Spills,” Collection X included nearly nine billion credentials from thousands of separate data breaches, both new and old, which were posted on dark web forums in early January 2019.
We used data from Shape Enterprise Defense, which was protecting nearly two billion user accounts across all major consumer industries at the time of this research, to understand how and when attackers use credentials from a fresh spill. We compared the Collection X credentials to the usernames used in credential stuffing attacks against a group of our customers six months before and after the date of announcement. We selected four Fortune 500 customers for this study—two banks, one food and beverage company, and one retailer—which collectively represented 72 billion login transactions over the course of 12 months. In essence, this project amounts to an attempt to “trace” stolen credentials through their theft, sale, and use by taking advantage of the capabilities of Shape systems.
Use of Compromised Credentials
Of the 2.9 billion credentials that were used against the four sites in a year, nine hundred million, or nearly one in three, had been compromised in Collection X (Cx). Of the nine hundred million credentials used from Collection X (Cx), six hundred and ten million were used by customers, three hundred and seventy million were used by attackers, and eighty million were used by both customers and attackers (Figure 16).
The stolen credentials showed up in legitimate, human transactions most frequently at the banks whose sites we were watching, followed by the retailer (Figure 17). The food and beverage organization showed little legitimate use of the stolen credentials.
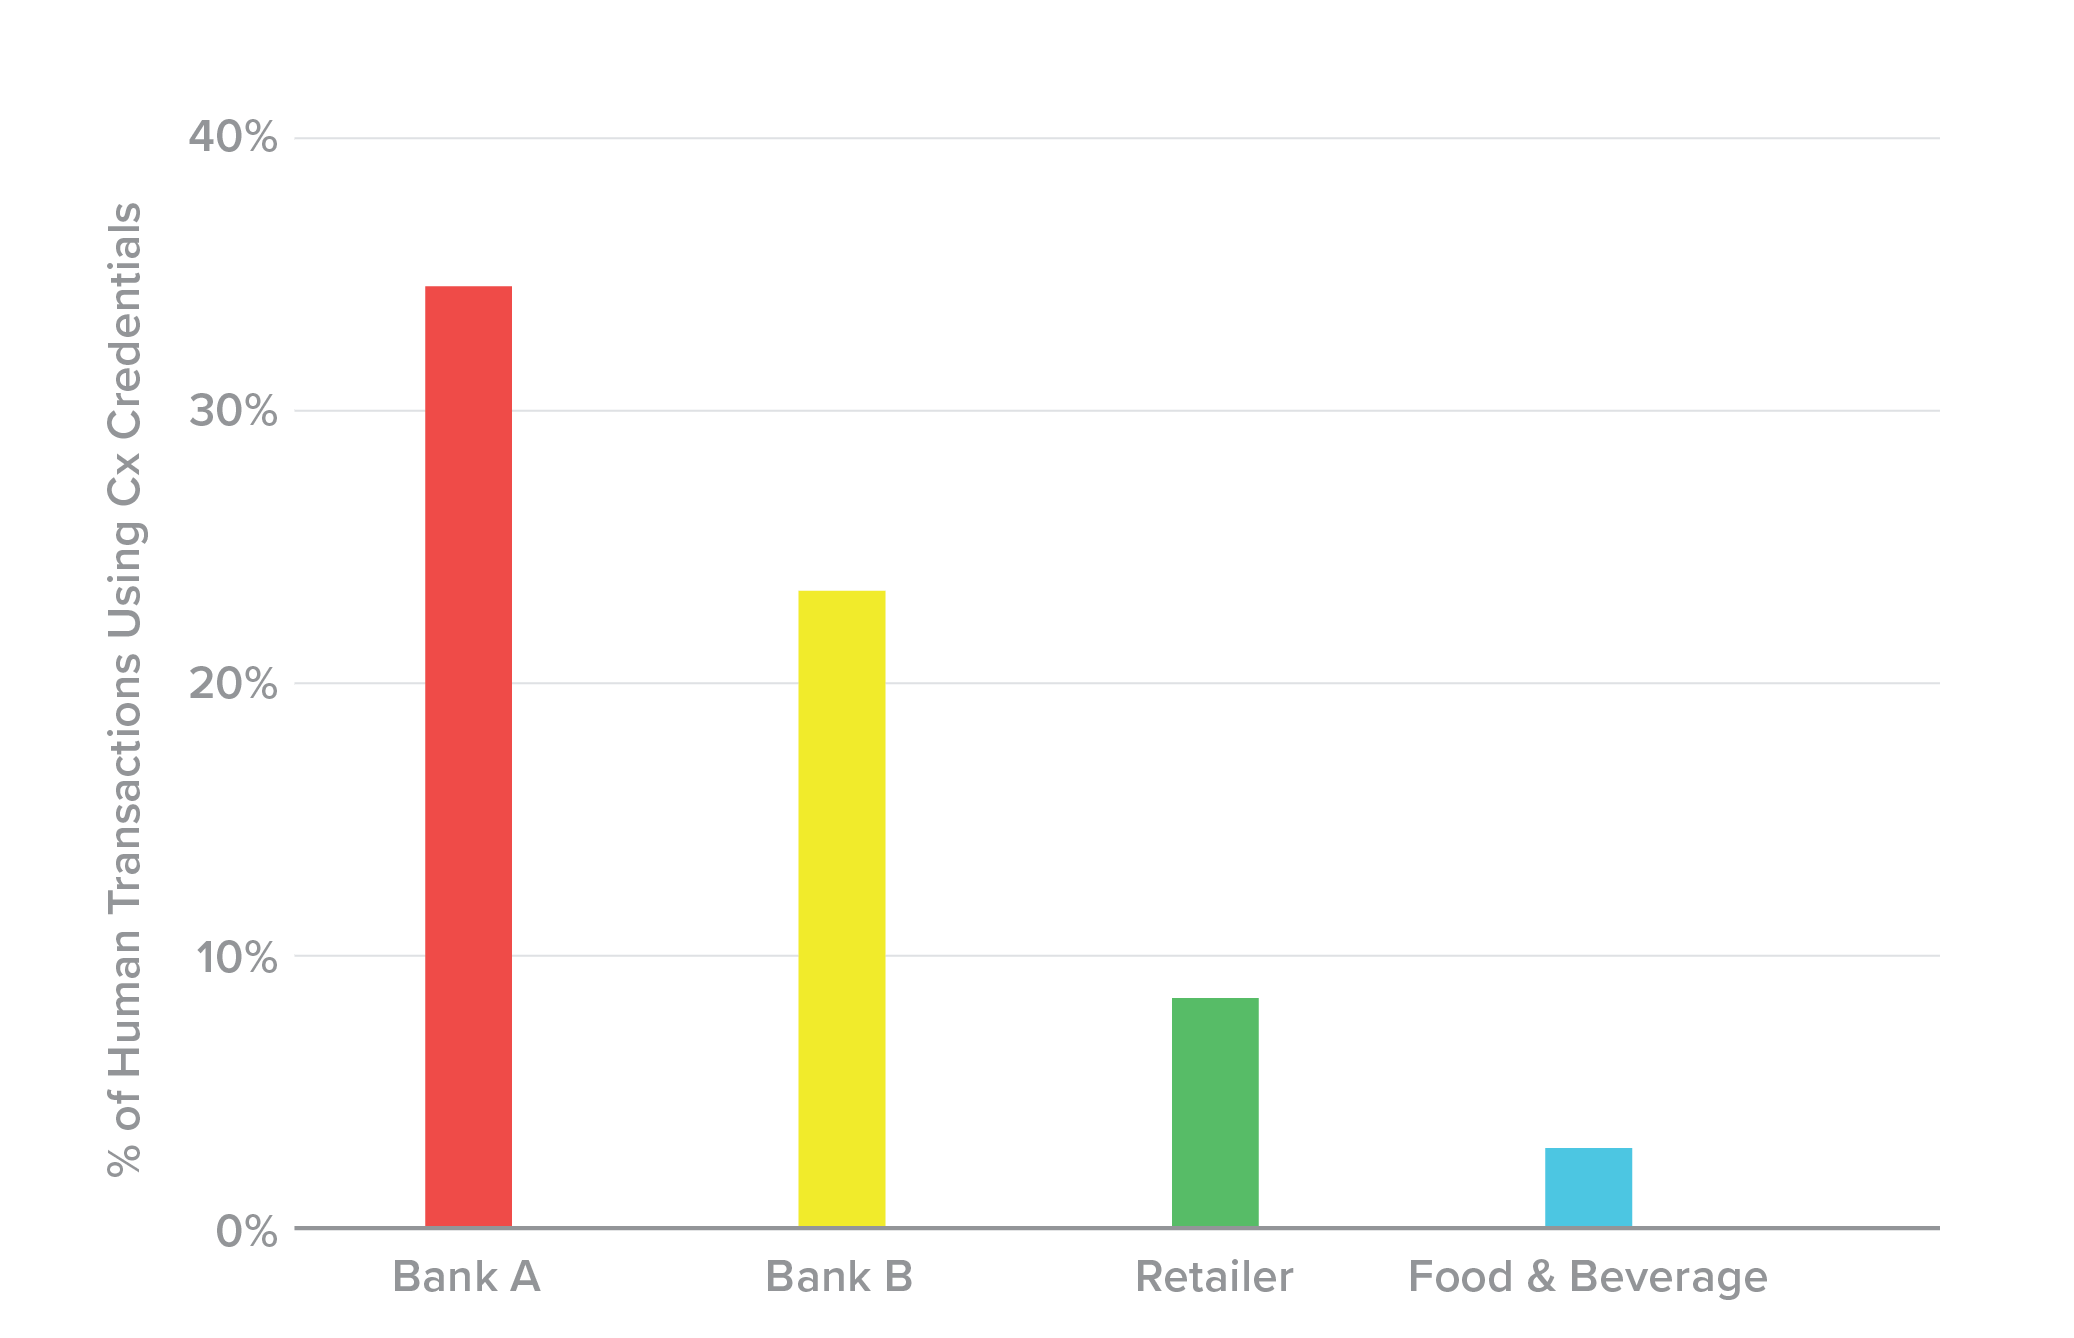
Figure 17. Where humans are using compromised credentials: banks.
Credential Use Over Time
This analysis revealed five key stages to how attackers exploit credentials after they are first compromised. In the following figures, “transactions” includes both attacks and legitimate logins, and “Day 0” refers to the date that the credential spill became public knowledge.
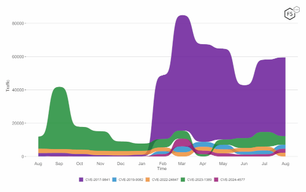
Attacker Behavior with Compromised Credentials
Oftentimes, multiple attackers will try to use the same set of credentials in the same day. Figure 23 shows the rate of attacks against a bank account across two months. A spike in attack traffic is apparent in late May, as five separate attacks all tried the same credentials within three hours of each other.
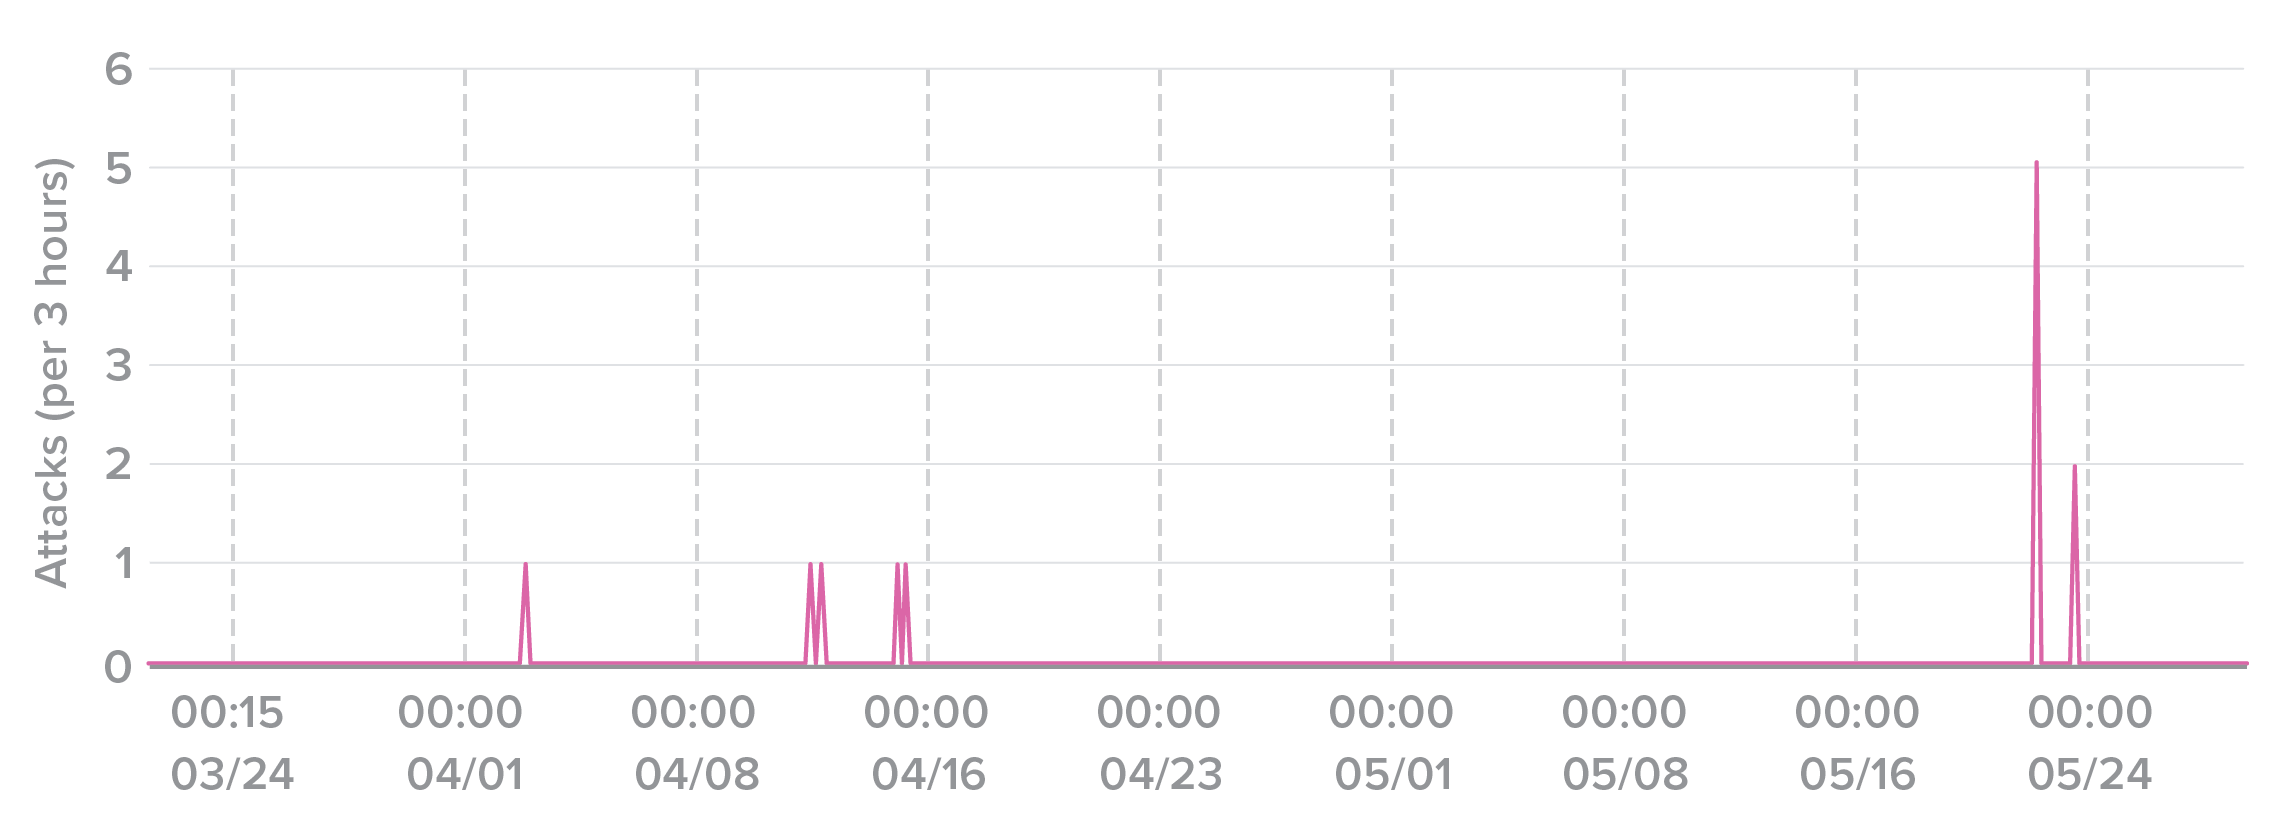
Figure 23. Five different attackers trying to use the same set of credentials within three hours.
Figure 24 shows six months of attack traffic against a single user across multiple sites. The peak of 250 attempts on a single user happened on Christmas Eve, which is attackers’ favorite holiday because of the distraction and heavy spending in much of the world.
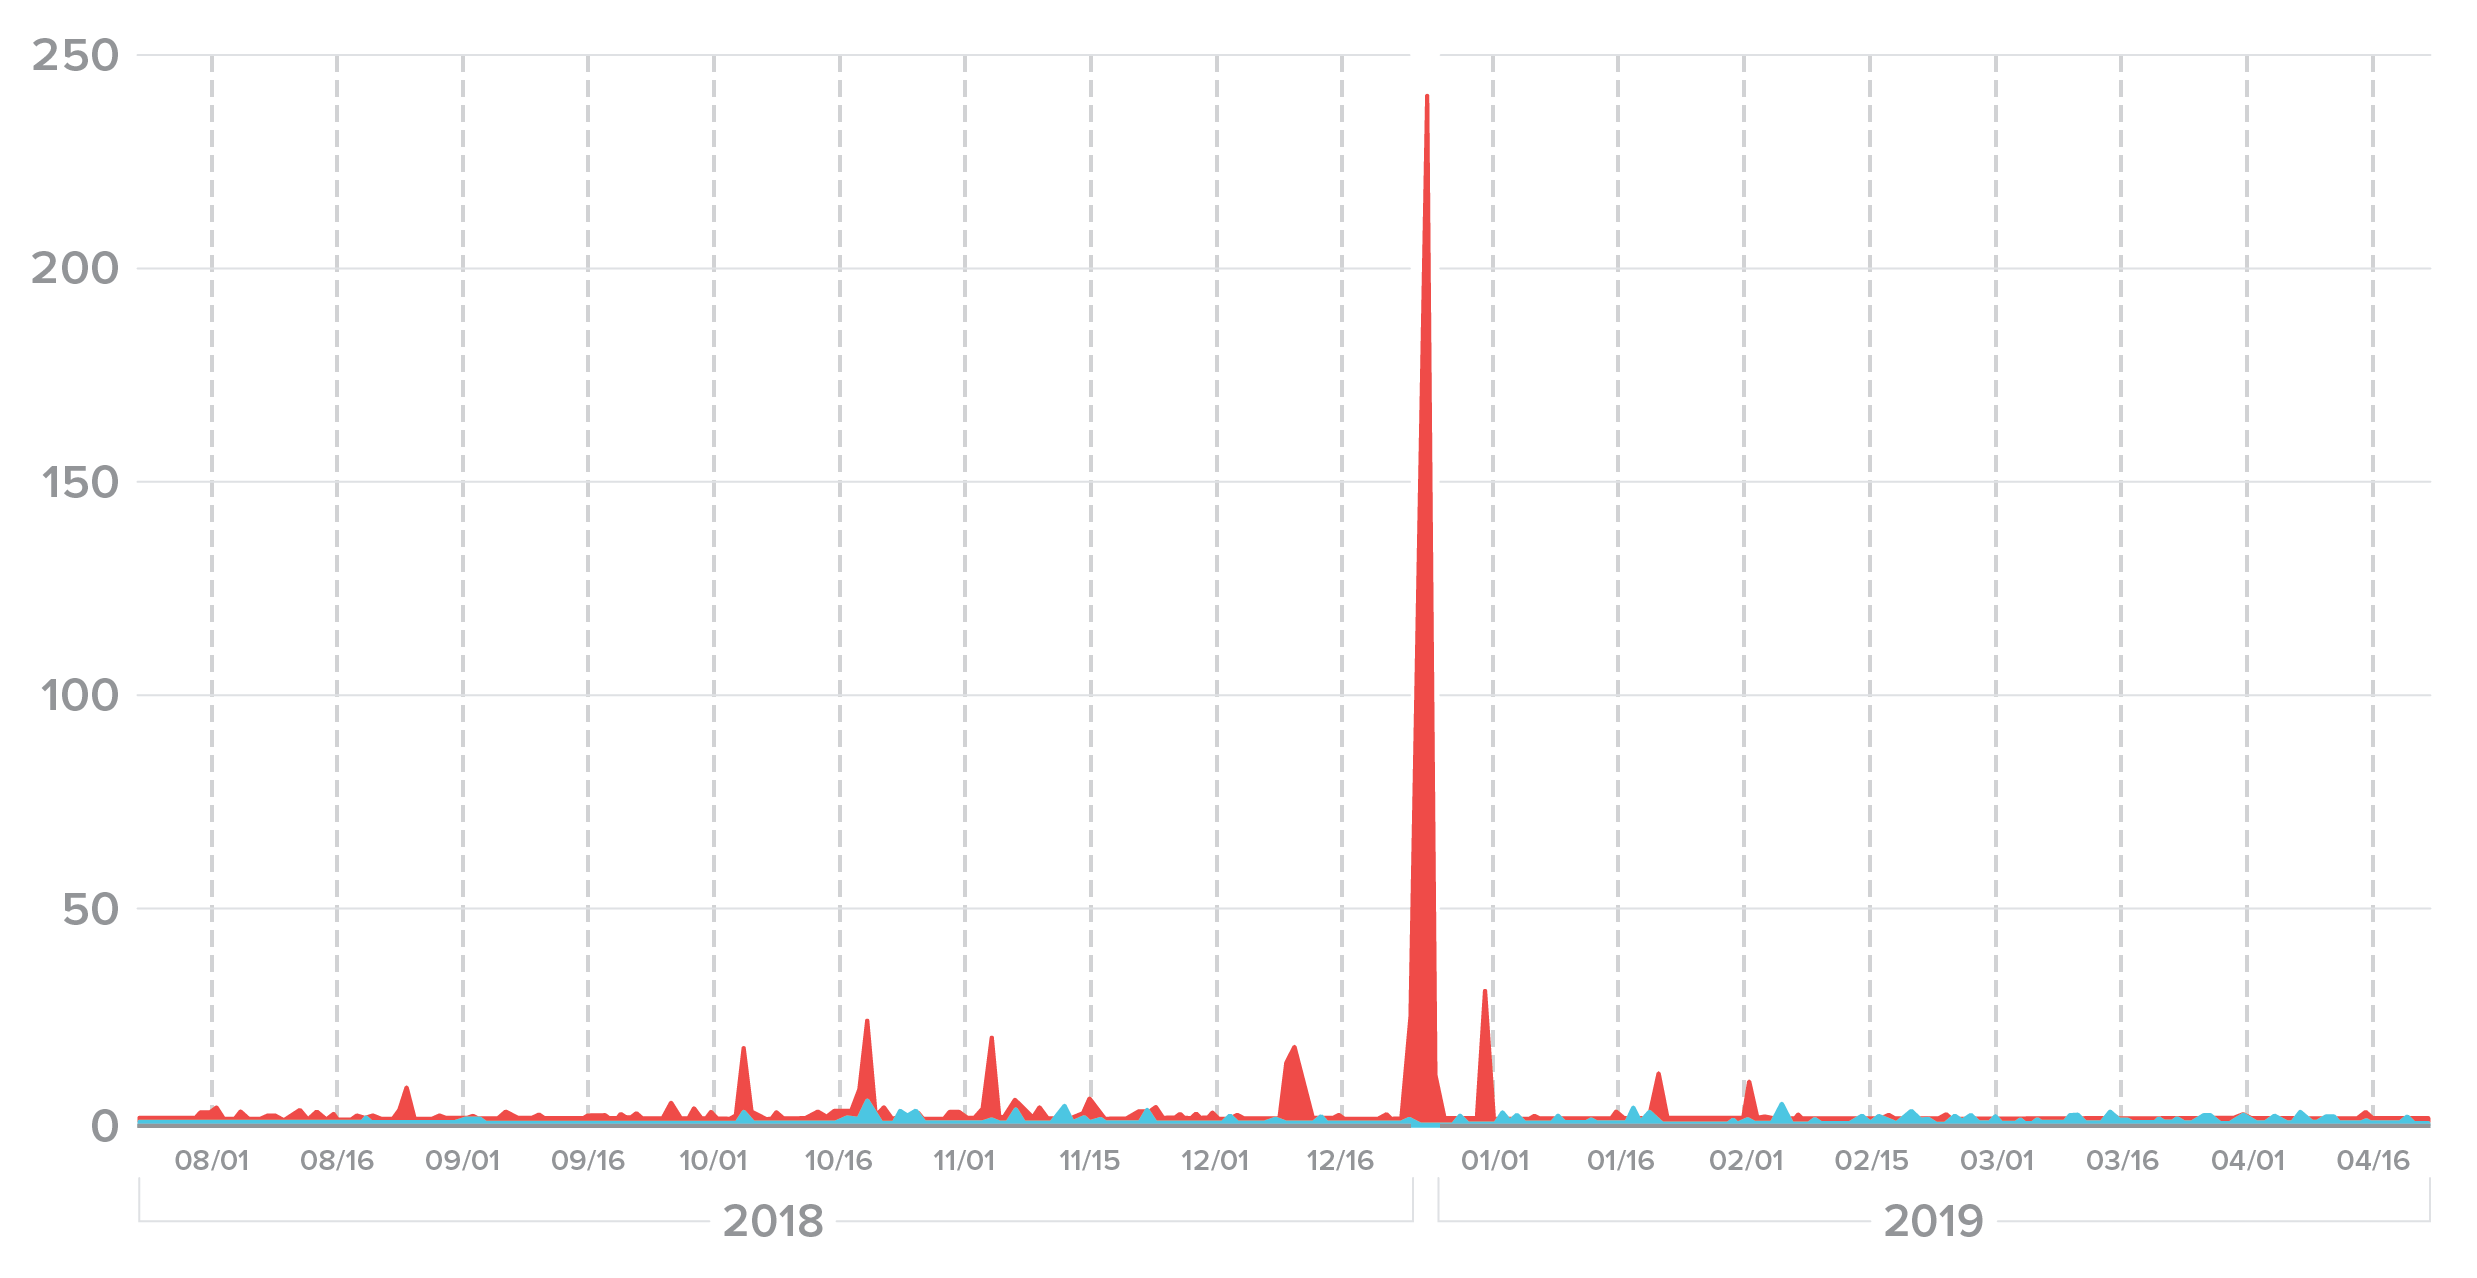
Figure 24. Repeated attacks on a user account peaked on Christmas Eve.
Fuzzing
Sophisticated attackers won’t just give up if they don’t find success using the exact credentials in a spill. If the username “shapesecurity00” was part of the spill, they will add code to their attack program to also check the top 10 or even top 100 most common variations, such as:
- shapesecurity01
- shape_security00
- shape_security_00
- shapesecurity_00
- shapesecurity00@gmail.com
This process is known as “fuzzing.” Figure 25 displays all of the credential stuffing attacks on user a********22 at Bank A, along with close variations of the username.
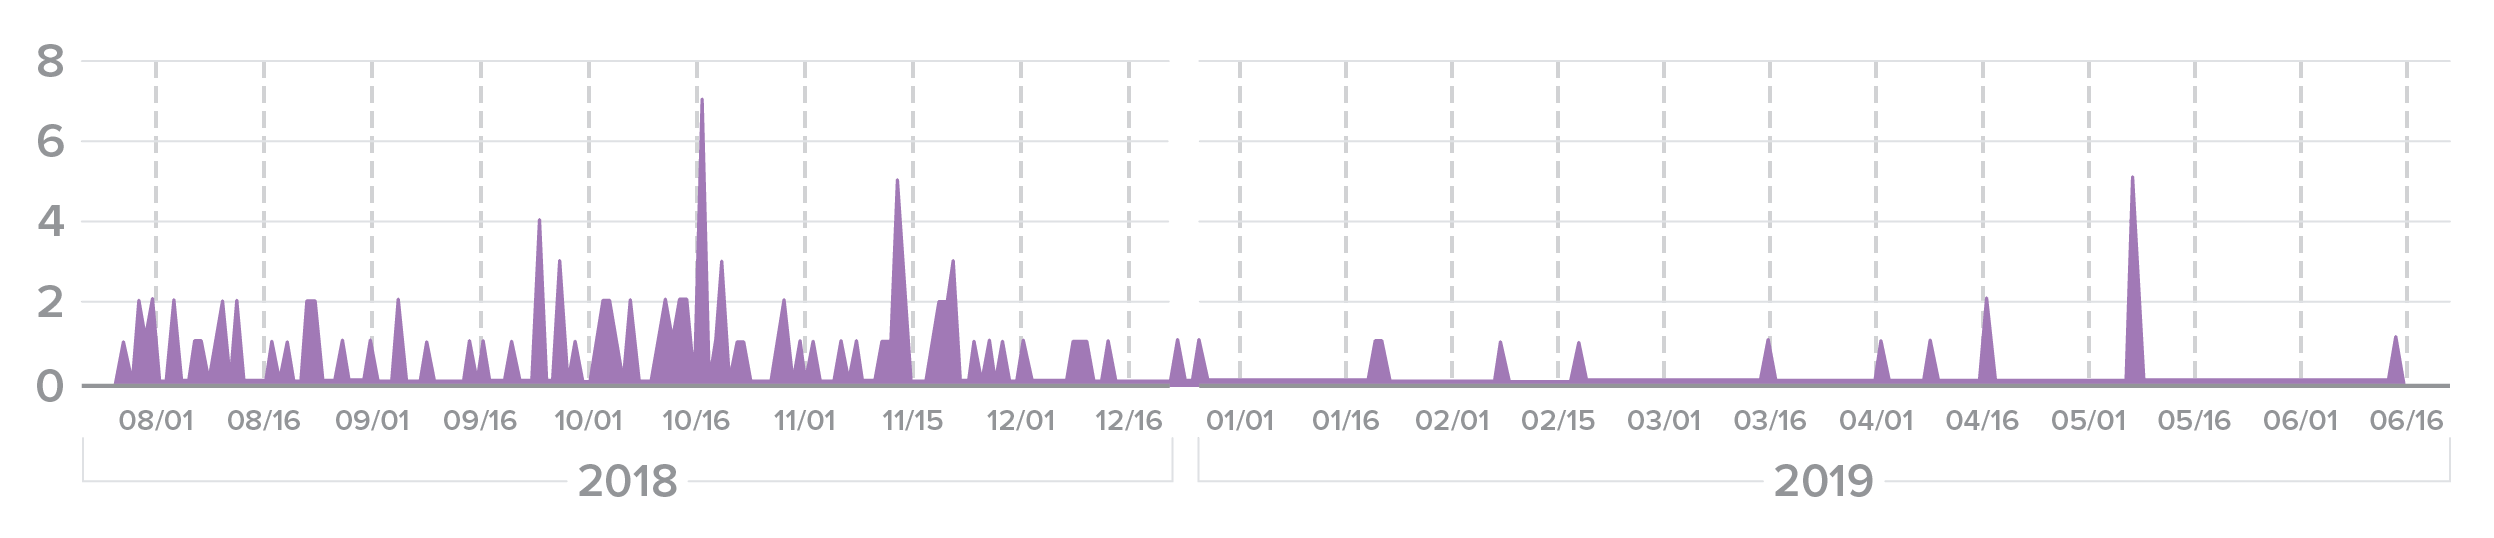
Figure 25. “Fuzzing” attack on a banking user account. Sophisticated attackers won’t give up if they aren’t successful with the exact credentials from a spill.
Note that the majority of the fuzzing was done prior to the public release of the compromised credentials. This lends credence to our understanding that fuzzing is more common among more sophisticated attackers.
Credential Stuffing Attacks and Breaches
The 2018 report categorized credential stuffing attackers into three groups based on the sophistication of their techniques (Figure 26).
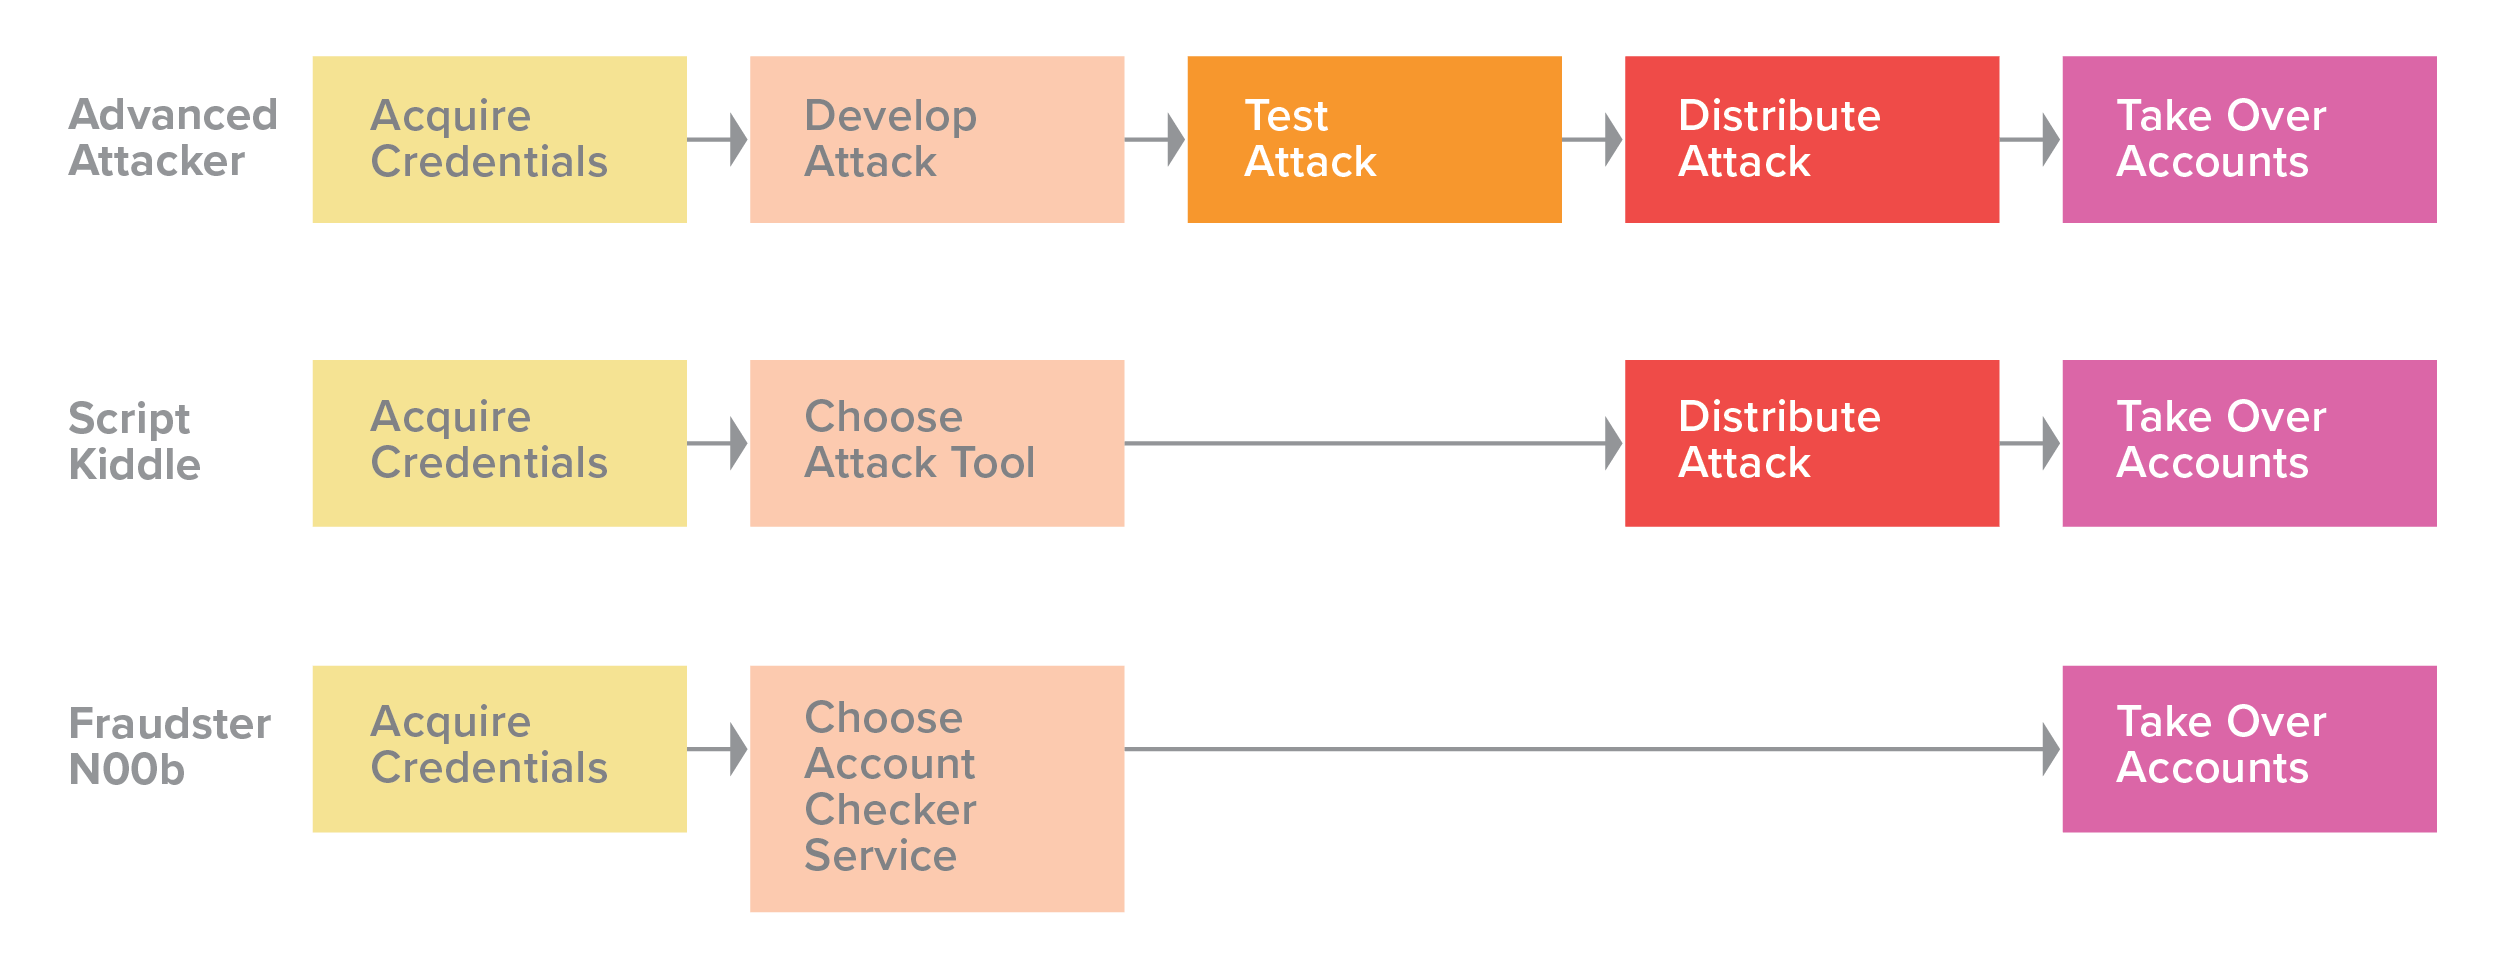
Figure 26. The method of credential stuffing depends on an attacker’s skill level.
Having established that attackers are distributed along a spectrum of sophistication, we will focus on how advanced attackers tune their attacks. For the purposes of this research, we define sophistication as an attacker’s ability to resemble and blend in with genuine users as closely as possible. But no matter the skill level, most attackers (at least, most cybercriminals) will start off with the cheapest, that is, least sophisticated, attacks in order to maximize rate of return. Able attackers will only increase sophistication (and thereby cost) if their target has implemented countermeasures that detect their original attack, and if the rewards still outweigh that increased cost.
Simulating Network Traffic
The simplest level of user simulation contains tools that make no attempt to emulate human behavior or higher level browser activity. They simply craft HTTP requests along specified parameters and pass them along to the target. These are the simplest, cheapest, and fastest tools. Sentry MBA (Figure 27) is perhaps the standard tool of this type.
To use Sentry MBA, an attacker specifies the URL of the company it wants to attack and then configures the application until the generated requests are accepted. The tool supports basic HTTP requests with custom headers, rotating proxy lists, optical character recognition for CAPTCHAs, and multistage requests.
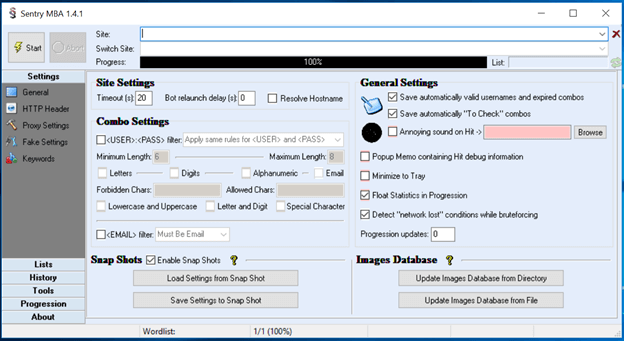
Figure 27. Sentry MBA, a standard user simulation tool.
Despite its age and limited capability, Sentry MBA still has a thriving community. Users on hacking forums continue to post and distribute years’ worth of Sentry MBA configurations at no charge. Most of these “configs” are old and not directly reusable, but the examples serve as documentation for those who are learning. If an attacker is not interested in learning, they can always pay for a custom configuration from any of the users selling their services.
The quickest way to block Sentry MBA is to simply require JavaScript execution on a webpage. It may seem strange that Sentry MBA is still so popular despite these shortcomings, but it thrives on old, unmanaged web applications and login flows for clients like TVs, where software development kits (SDKs) are hard to integrate, and JavaScript execution is not an option.
Simulating Browsers and Native Apps
Most of the websites that we interact with every day—online banking, ecommerce, and travel sites—consist of large web applications built on hundreds of thousands of lines of JavaScript. These webpages are not simple documents, so simulating convincing transactions at the network level is extremely complex. At this point, it makes more sense for an attacker to automate activity at the browser level.
Until 2017, PhantomJS was the most popular automated browser in the market. When Google released Chrome 59 that year, however, it pushed forward the state of browser automation by exposing a programmatically controllable “headless” mode (that is, absent a graphical user interface) for the world's most popular browser, Chrome. This gave attackers the ability to quickly debug and troubleshoot their programs using the normal Chrome interface while scaling their attacks. Furthermore, just weeks after this announcement, Google developers released Puppeteer, a cross-platform Node.js library that offers intuitive APIs to drive Chrome-like and Firefox browsers. Puppeteer has since become the go-to solution for browser automation, as you can see from its growing popularity in web searches (Figure 28).
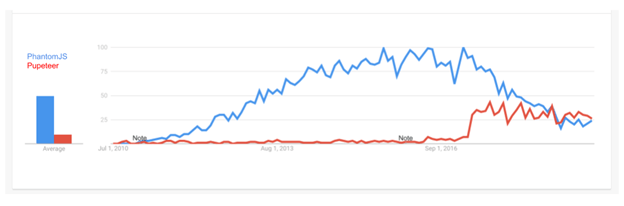
Figure 28. Google trends graph showing interest in PhantomJS versus Puppeteer between 2010 and 2016. (Source: Google Trends)
Puppeteer and Headless Chrome
Puppeteer is a Node.js-first library but has ports in other languages. Using Puppeteer is as simple as using any other library available on npm, the package manager for Node.js.
Puppeteer bundles a version of the open-source Chromium browser that the maintainers test against and guarantee to conform with the installed Puppeteer version. Chromium is sufficient for many legitimate use cases, but using production Chrome is better because it is closer to real user traffic.
One of the biggest benefits of Puppeteer is the ability to run in either headless mode or normal (GUI) mode with a single Boolean option. This enables rapid debugging and shortens the iteration cycle—a key cost reducer for any developer, malicious or not.
const puppeteer = require('puppeteer');
puppeteer.launch({
headless: false
});
Headless Chrome exposes itself by default via the navigator.webdriver property, which determines whether it is automated. In theory, this would make it easy to detect and block headless Chrome, but attackers have found ways to bypass this check. Furthermore, attackers can render common fingerprinting techniques, such as WebGL and canvas, useless by turning off these capabilities via configuration or command-line arguments. Puppeteer even has plug-ins that optimize stealthy usage. For example, the puppeteer-extra project includes the puppeteer-extra-stealth plug-in, which includes an architecture for evasions (modules designed to anonymize Chrome and evade common detection methods).
Simulating Human Behavior
The next level of sophistication above simulating a browser is simulating human behavior. It's easy to detect rapid, abrupt mouse movements and repeated clicks at the same page coordinates (such as a Submit button), but it is much harder to detect behavior that includes natural motion and bounded randomness (Figure 29).
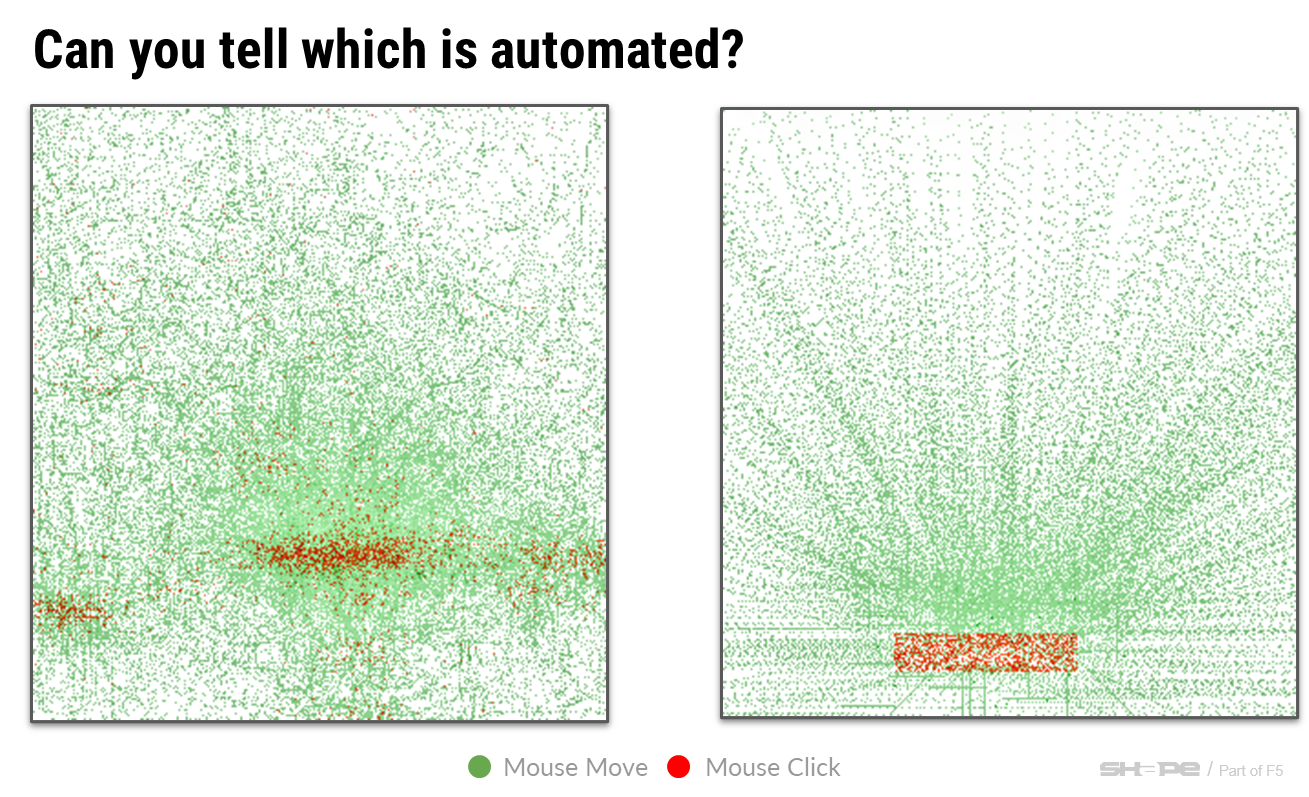
Figure 29. Human versus bot mouse movements.
While Puppeteer and the Chrome DevTools Protocol can generate trusted browser events, such as clicks or mouse movements, they have no embedded functionality to simulate human behavior. Even if perfect human behavior was as simple as including a plug-in, Puppeteer is still a developer-oriented tool that requires coding skill.
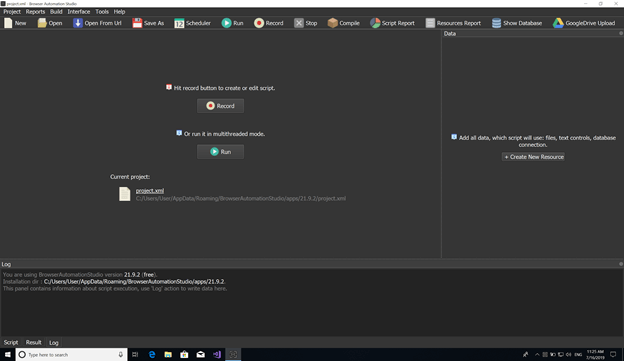
Figure 30. Browser Automation Studio graphical user interface.
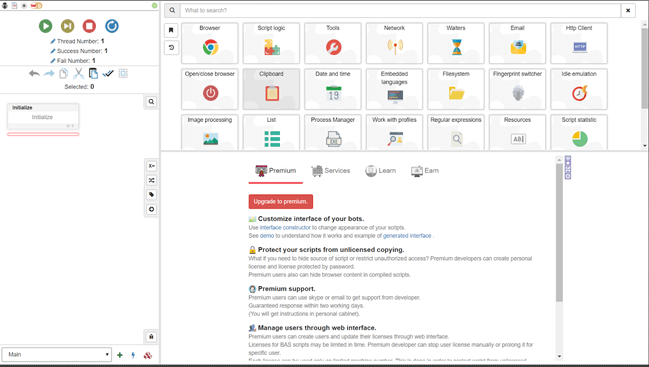
Figure 31. Creating automation tasks in BAS is simple.
Enter Browser Automation Studio, or BAS. BAS is a free, Windows-only automation environment that allows users to drag and drop their way to a fully automated browser, no coding needed. BAS was created by the Russian company Bablosoft and has a thriving community dedicated to helping others through common automation hurdles. The BAS premium license is $80 a year and allows users to bundle and password protect their creations and sell them on the Bablosoft market.
In 2019, Shape saw BAS usage grow. Until then, attacks using BAS had primarily originated from within Russia, but attackers outside the country are starting to use this powerful software more.
Browser Automation Studio: How it Works
BAS starts with a graphical user interface that allows users to create a new project (Figure 30).
Creating automation tasks is as simple as picking from one of the dozens of common actions (Figure 31).
BAS heavily integrates with Chrome, guiding users through some of the more frustrating automation tasks. For example, users can click directly on the elements they want to interact with, and BAS will record the actions it took to get to that element and automatically store the selectors it needs to reference that element again.
Some user experience flows on an attacker’s target website have forks in them; for example, a login page may present one out of 10 users with a multifactor authentication challenge. These forks can be cumbersome to deal with when writing and managing one’s own source code, but with BAS it's just another drag and drop (Figure 32).
Arguably BAS’s most compelling feature (to attackers) is its free automatic behavior generation. BAS produces mouse and keyboard behavior that is slow and random enough that standard automation checks fail to detect it.
Tools like this drive down the cost of attacks and are a shot of adrenaline to attacker communities. The cost-value ratio of attacks fluctuates as companies and vendors deploy new defenses. The current era of defenses has made attacks somewhat more costly, but we're at the early stages of new tools driving that cost down sharply. It’s not all bad news, however. As of late 2020, BAS currently runs several versions behind the latest Chrome. Because of that, it displays characteristics that make it stand out, most notably an older user agent string.
One of the reasons we expect to see more of BAS is because of the Bablosoft community and how easy the software makes it to redistribute and sell work. BAS can compile and protect a developer’s software with a few clicks (Figure 33). This allows downstream configuration experts to have marketplaces of their own—exactly the type of ecosystem that enabled other tools to explode in popularity.
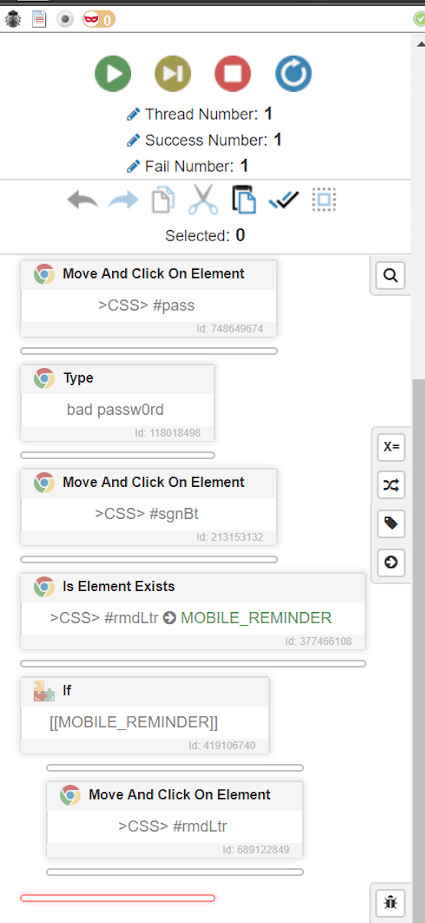
Figure 32. Avoiding common forks like multifactor authentication in BAS is easy.
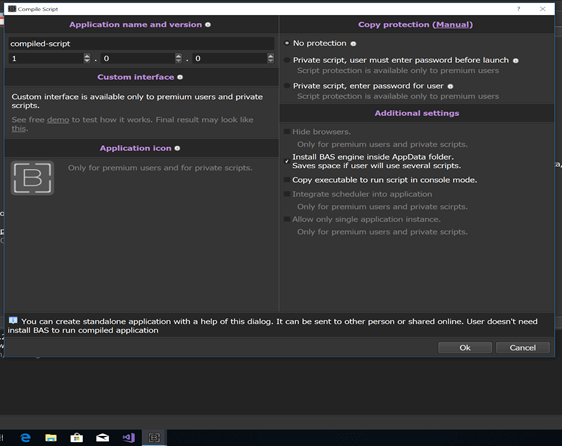
Figure 33. Compiling and protecting developer software in a few clicks in BAS.
Scaling Up Real Human Behavior
As attackers grow in capability, they succeed in creating automated attacks that look more like human behavior. In some contexts, it actually makes more sense to just use actual humans. "Microwork" is a booming industry in which anyone can farm out small tasks in return for pennies. These services describe their jobs as ideal for labeling data destined for machine learning systems and, in theory, that would be a perfect use. In reality, the tasks the human workers perform are helping bypass antibot defenses on social networks, retailers, and any site with a login or sign-up form (Figure 34).
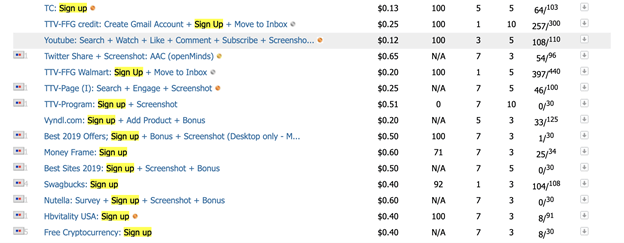
Figure 34. Data labeling “microwork” using humans to help bypass antibot defenses.
The most well-known of these services is Amazon Mechanical Turk (MTurk), which has a comparatively stringent set of listing criteria. Lesser-known services like Microworkers, Minijobz, and RapidWorkers are less rigorous in their quality control. Some of these services allow the task creator to isolate tasks to users of specific countries, which helps craft believable traffic demographics. Tasks, or “campaigns,” generally run about 10 to 60 cents for about three minutes worth of work, which might not sound like much, but is a good wage in many parts of the world.
As such, manual fraud is much more expensive than comparable automated solutions and is therefore only viable when the value is high, for example, if the attacker had access to credentials from a fresh spill and if monetizing the hijacked accounts was relatively quick and easy.
Manual fraud is difficult to catch in the act. It is prohibitively costly to prevent at first touch and prone to false positives, which are a big problem to businesses because they weed out customers. Instead of worrying about catching 100% of manual fraud at the earliest stage, companies should have a pipeline in which automated systems flag potentially fraudulent behavior and maintain those flags throughout the lifetime of all associated transactions. This facilitates identifying and reversing an attacker’s actions once enough flags have been raised. Manual fraud thrives between the cracks of automated systems. The defenses put in place to catch it necessitate different techniques, strategies, and systems. It is not impossible but it requires a different, holistic perspective.
Conclusion: Minimizing the Threat of Credential Stuffing
A common truism in the security industry says that there are two types of companies—those that have been breached, and those that just don’t know it yet. As of 2021, we should be updating that to something like “There are two types of companies—those that acknowledge the threat of credential stuffing and those that will be its victims.” In the F5 Labs 2019 Application Protection Report, we found that access-related attacks, which comprise phishing and credential stuffing in its various forms, made up roughly half of the publicly disclosed data breaches in the United States over 2018 and 2019, which was a far greater proportion than any other cause (Figure 35).
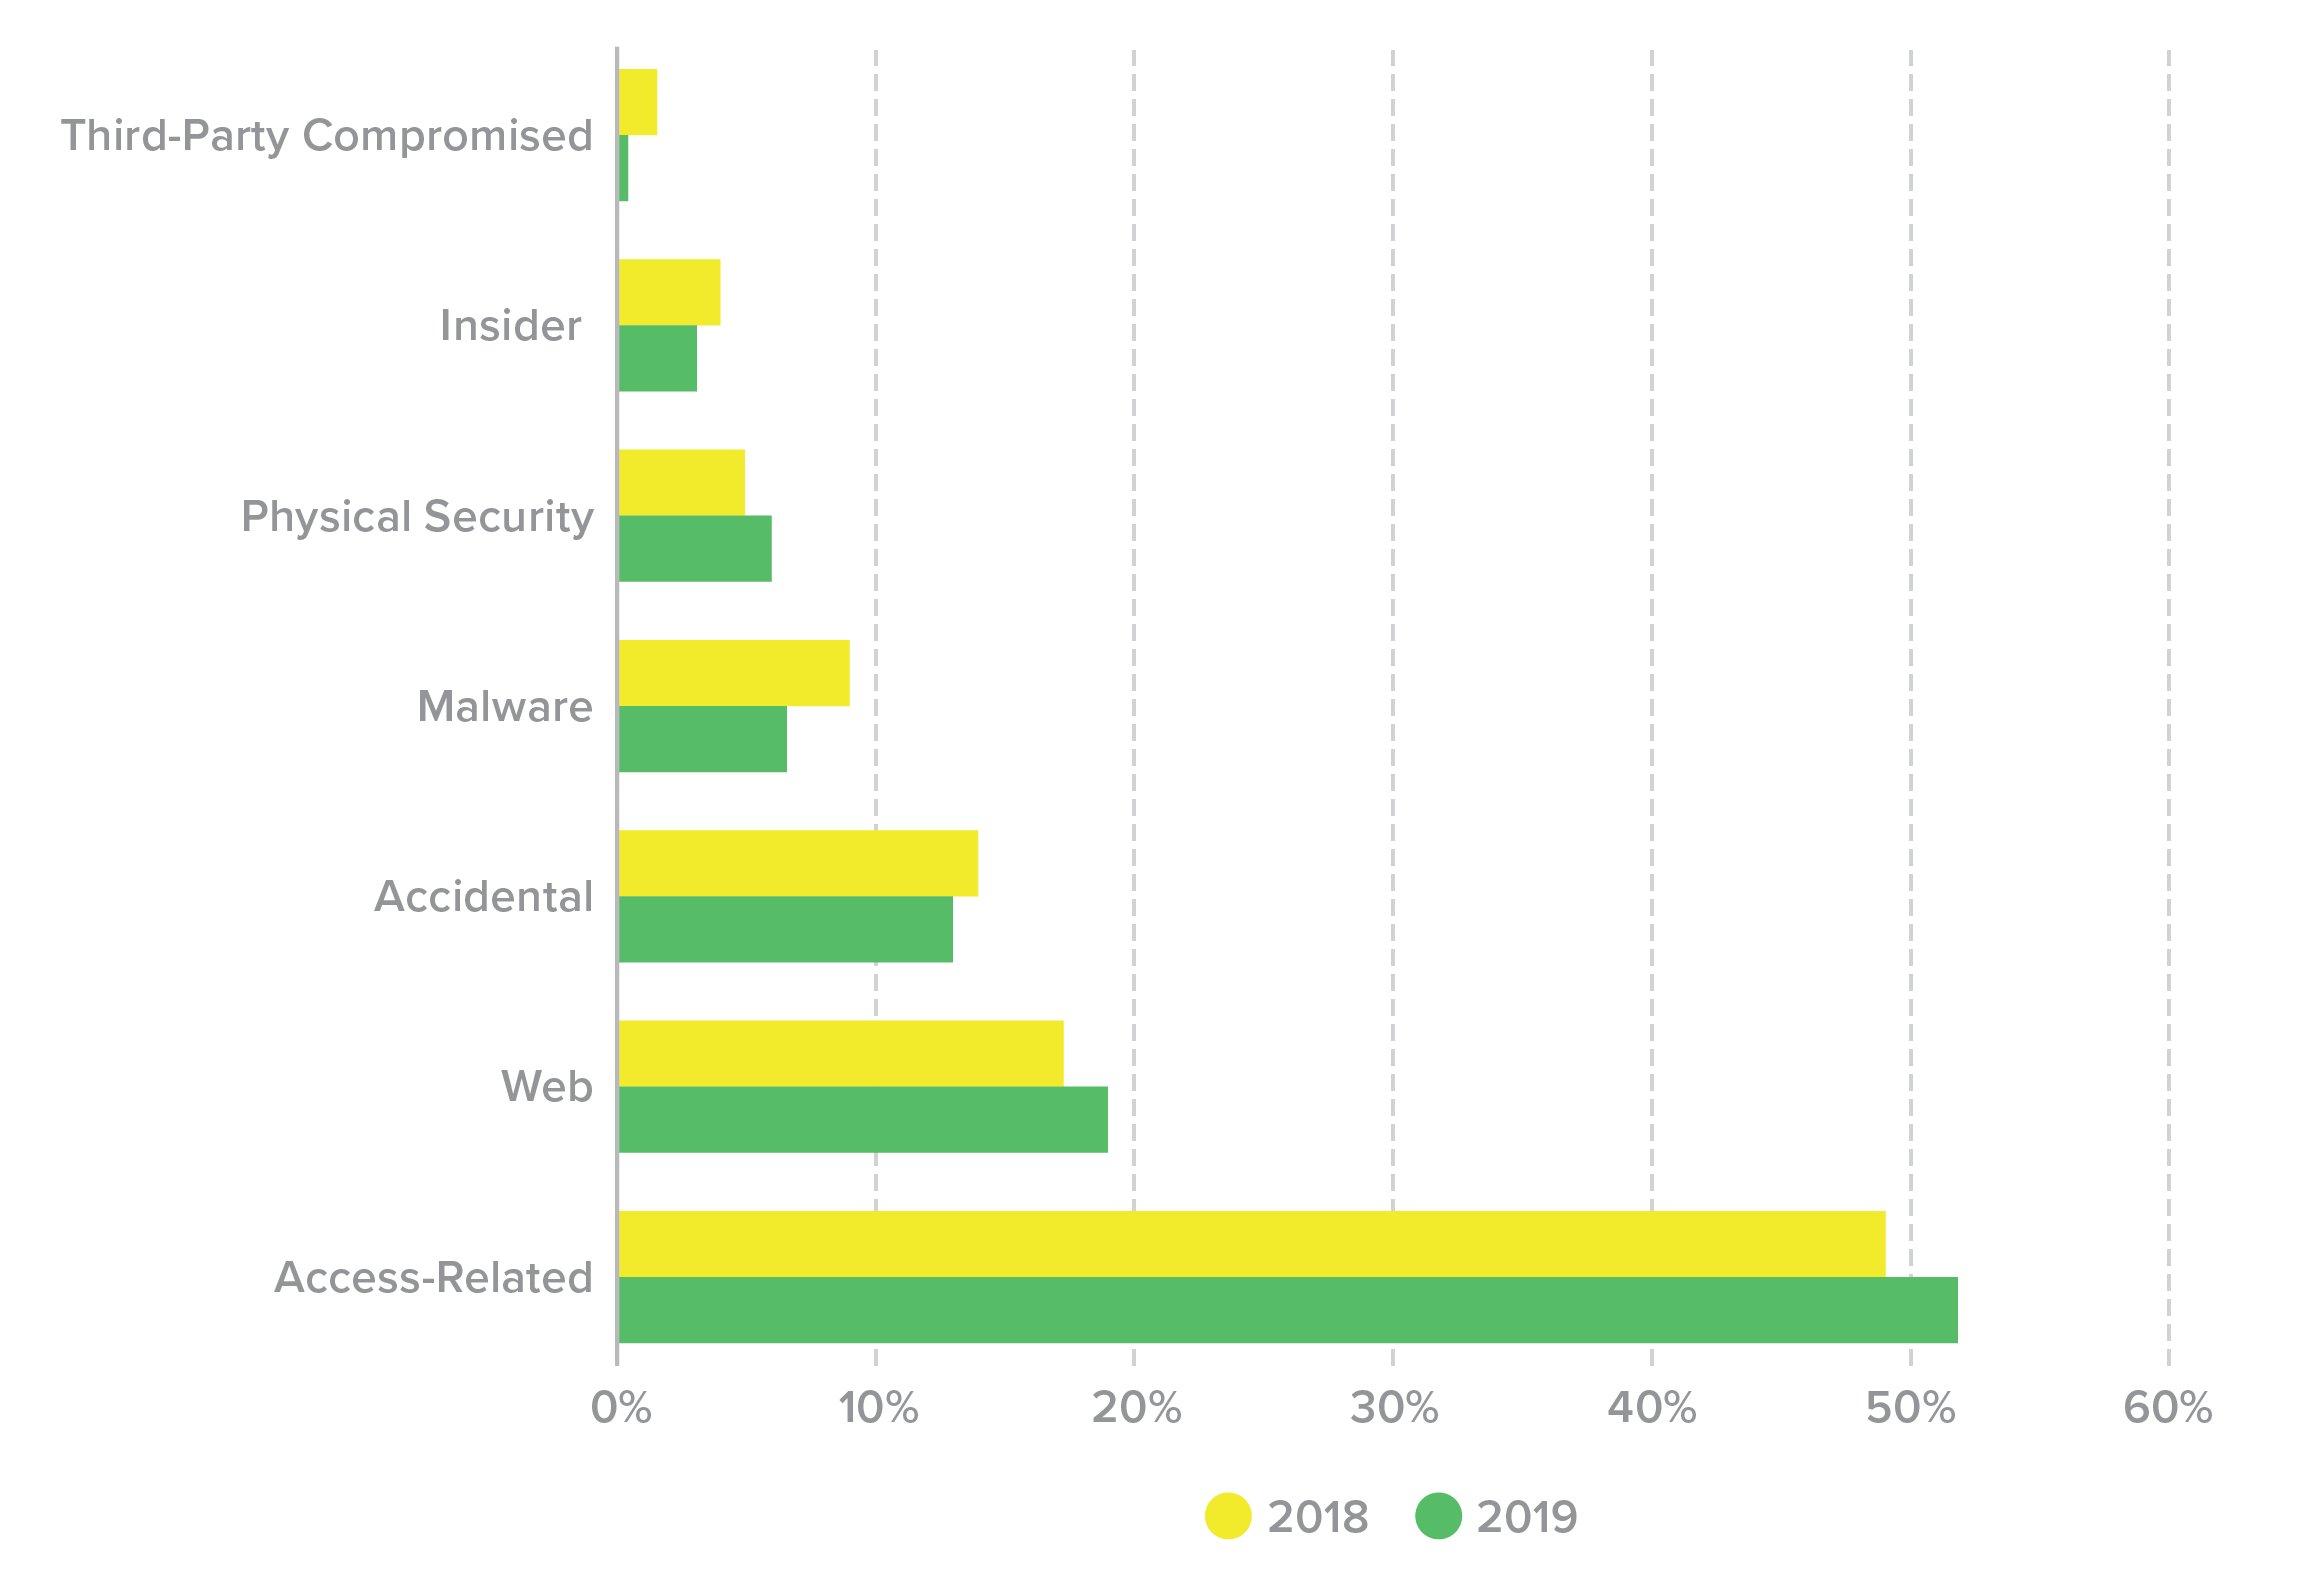
Figure 35. U.S. breaches, 2018-2019, by cause (%).
Credential stuffing will be a threat so long as we require users to log in to accounts online. The most comprehensive way to prevent credential stuffing is to use an anti-automation platform. In addition, follow these 10 best practices for minimizing the threat of credential stuffing—from ways an organization can shrink its attack surface to tips for employees:
Promote unique passwords: Every year, articles are published on the most common passwords used, and year after year, very little changes.6 Clearly, consumers continue to use them. Why not share that top 10 list when users are creating a password on your site, encouraging them to choose a different password? Furthermore, when users are creating accounts or resetting passwords, use language to encourage them to choose a unique password they haven’t used elsewhere. Now, 70% of users will likely tweak an old password, which still leaves them vulnerable to fuzzing attacks, but it will weed out the bottom of the barrel.7
Give users options for passwords: Do not set requirements on the number or type of characters customers and employees must use when creating a password. While these parameters prevent users from choosing one of the absolute worst passwords (123456, password, 111111, etc.), they actually reduce the set of possible passwords, thereby increasing the likelihood an attacker can brute force their way in. Instead, encourage users to choose a password optimized for length.
Prevent users and employees from using known compromised credentials: All organizations should routinely cross-reference their users’ and employees’ credentials against an “allow list” of username and password combinations that have already been compromised. One way is to use a “dark web” service as an intermediary to discover spilled credentials that have been shared on dark web marketplaces. However, because the dark web is, by design, unsearchable, it is impossible to ascertain whether one of these services has combed 10, 30, or 50% of all posted credentials.
Furthermore, as discussed in “The Lifecycle of Spilled Credentials,” it takes on average 10 months for credentials to be posted on dark web forums. Thus, organizations may want to use technology that detects compromised credentials as soon as attackers weaponize them, months before they hit the dark web.
Reduce feedback: As we mentioned in “The Lifecycle of Spilled Credentials,” time is an extremely precious resource for an attacker. One way to increase the time it takes for an attacker to launch a successful credential stuffing campaign is to reduce the feedback attackers receive from unsuccessful attempts. As an example, when a user enters incorrect login credentials, do not disclose which element of the credential, the username or password, was incorrect. Instead, the error message should read “login failed,” or the verbose yet accurate, “that combination of username and password does not exist in our system.”
Look for a diurnal pattern: One of the things that distinguishes humans from bots is sleep. Legitimate consumers are going to wake up in the morning, conduct transactions during the day, and then power down at night. So organizations should monitor three functions—login, password reset, and account creation—to ensure a consistent diurnal pattern that reflects their customers’ business hours. If not, it is likely the organization is under substantial credential stuffing attacks.
Monitor key metrics: While blocking based on diurnal patterns will deter elementary attackers, advanced attackers time their attacks to mirror normal business hours. So just because traffic appears relatively diurnal and normal does not mean attacks are not occurring. Thus, security teams should monitor two key metrics:
- Login success rate. Normal human login success rates are 60 to 80%, depending on the industry.8 Financial institutions have higher success rates because customers tend to value and therefore remember their online banking credentials over, say, their password for one of many ecommerce sites they visit. If a website or mobile app’s login success rate suddenly drops by 10 to 15%, that suggests the application is under attack by criminals testing nonexistent credentials.
- Password reset request rate. An uptick in reset requests may indicate reconnaissance for a credential stuffing attack.
Connect security and fraud with marketing: False positives are a huge issue for security teams fighting fraud. Not only do they impact revenue, but they run the risk of alienating both the customer and colleagues at the organization. In order to reduce this risk, it is important to be in touch with teams at the organization whose activities might affect legitimate human traffic. To use a recent real-world example, a siloed security team might think that a spike in transactions from the UK represented an attack on their site. In fact, these weren’t credential stuffers targeting the company, they were actual customers acting slightly out of the norm. The digital marketing team had emailed out a two-for-one flight deal that morning to all of its UK customers, causing an abnormal spike in traffic. Had the security or fraud teams not had a heads-up, the company might have lost tens of thousands of dollars in revenue.
Train marketing: The relationship between security teams and marketing departments should be a two-way street. In many organizations, digital marketing teams have a dominant say in managing the website. They need to be taught how to best keep the website and their customers safe.For example, one practice might be having the security team verify that any plug-ins and code snippets are acceptably low risk before they are added to the website. In other words, a customer-facing site should go through the same change control process as any other aspect of an application. Several breaches have occurred in the last few years due to the addition of malicious code to the website that masqueraded as a Google Analytics script.9 Another practice marketing teams should embrace is storing data only when necessary. Data-driven marketing is all the rage, but each piece of data collected poses an additional risk for end customers. For example, does your particular company require a unique account registration system? Or would it be possible to outsource identity management to a known secure solution such as Google or Okta? Educating marketing teams about the risks that accompany the rewards of collecting customer data can save a lot of pain down the line.
Extend signal collection beyond a single organization: Companies should adopt methods to leverage each other’s data points (in compliance with data privacy laws), allowing them to better secure users and prevent fraud from account takeovers. For example, if a user known to make purchases of $25 to $50 on a certain retail site suddenly made a $500 purchase, that wouldn’t necessarily raise any alarms (nor should it). But if that user also made an unusually large purchase on another retail site and also converts all of their credit card reward points into gift cards that week, then it’s possible the user’s accounts have been compromised.Similarly, it would be reasonable for an American user to log in to their frequent flyer account from Japan, as they might be traveling. The airline would not want to block users’ transactions simply due to a change in location. What would be unusual, and a sign of account takeover fraud, would be if that same “user” had logged in to their bank account that same day from Brazil.
Work with law enforcement: Another area for potential collaboration is between the private sector and law enforcement. In 2018, we witnessed the first major conviction of a credential stuffer.10 The FBI managed to track down the attacker after he forgot to use his VPN when stealing data from Disqus (a spill reported in 2017).Furthermore, while credential stuffing is by and large a financially motivated attack, we have seen nation-states engage in credential stuffing. The lines will likely continue to blur between nation-state activities and financially motivated crimes, in which case it is especially prudent for companies to begin collaborating with law enforcement, if they haven’t already.