
The Sensor Intel Series is created in partnership with Efflux , who maintains a globally distributed network of sensors from which we derive attack telemetry.
---------------------------------------------
This month’s story in vulnerability targeting trends is one of stability. Even though two of the top ten vulnerabilities changed in June compared with May, and a few vulnerabilities more than doubled in volume, all of the change was minor in the big picture. We did, however, identify a few vulnerabilities that were novel to us, and added four more signatures.
June Vulnerabilities by the Numbers
Figure 1 shows the top ten vulnerabilities by traffic for the month of June. Most of these are old friends by now: CVE-2020-8958 (GPON router), CVE-2017-9841 (PHPUnit), and several others are commonplace in the top ten. On the other hand, both CVE-2019-9082 (ThinkPHP) and CVE-2013-6397 (Apache Solr) more than doubled compared with May, putting them in the top ten for the first time in a while.
Table 1 displays the traffic volume for all of the vulnerabilities that showed up in our systems in either June or July. Note that we track 71 vulnerabilities and this list only shows 50—20 CVEs are present in our data at some point but didn’t show up for the last two months. As a reminder, last month we started including CVSS v3.x and Exploit Prediction Scoring System (EPSS) scores to cross-reference with our own observations. Since EPSS scores vary over time, these scores were collected on 1 July 2023, at the end of our period of observation.
| CVE Number | June Traffic | Change from May | CVSS v3.x | EPSS Score |
| CVE-2020-8958 | 9220 | 1530 | 7.2 | 83.1% |
| CVE-2017-9841 | 5027 | 2173 | 9.8 | 97.5% |
| CVE-2022-24847 | 2606 | -120 | 7.2 | 0.1% |
| CVE-2019-9082 | 1731 | 1069 | 8.8 | 97.5% |
| CVE-2021-3129 | 1614 | 1006 | 9.8 | 97.5% |
| CVE-2022-22947 | 1520 | -450 | 10 | 97.6% |
| CVE-2020-0688 | 1292 | -111 | 8.8 | 97.3% |
| CVE-2013-6397 | 1150 | 760 | n/a | 71.4% |
| CVE-2022-41040/CVE-2021-34473 | 1013 | -109 | 9.8 | 97.3% |
| 2018 JAWS Web Server Vuln | 985 | 200 | n/a | n/a |
| CVE-2021-28481 | 932 | -474 | 9.8 | 2.3% |
| CVE-2020-25078 | 840 | 615 | 7.5 | 97.0% |
| CVE-2021-26855 | 711 | -338 | 9.8 | 97.5% |
| CVE-2020-15505 | 499 | 213 | 9.8 | 97.5% |
| CVE-2017-18368 | 370 | 131 | 9.8 | 97.6% |
| CVE-2018-10561 | 294 | -42 | 9.8 | 97.5% |
| CVE-2021-22986 | 216 | 39 | 9.8 | 97.5% |
| CVE-2022-1388 | 43 | 43 | 9.8 | 97.5% |
| CVE-2014-2908 | 254 | -61 | n/a | 0.6% |
| Citrix XML Buffer Overflow | 250 | -59 | n/a | n/a |
| CVE-2021-40539 | 243 | 55 | 9.8 | 97.5% |
| NETGEAR-MOZI | 203 | -46 | n/a | n/a |
| CVE-2019-18935 | 184 | -131 | 9.8 | 90.8% |
| CVE-2021-26084 | 146 | 137 | 9.8 | 97.5% |
| CVE-2018-13379 | 144 | -184 | 9.8 | 97.5% |
| CVE-2021-26086 | 134 | -237 | 5.3 | 94.4% |
| CVE-2017-1000226 | 117 | -249 | 5.3 | 0.1% |
| CVE-2022-40684 | 101 | 84 | 9.8 | 96.7% |
| CVE-2021-44228 | 84 | -7 | 10 | 97.6% |
| CVE-2021-27065 | 53 | 52 | 7.8 | 92.5% |
| CVE-2022-22965 | 30 | 3 | 9.8 | n/a |
| CVE-2021-21985 | 21 | 7 | 9.8 | 97.5% |
| CVE-2020-3452 | 17 | 0 | 7.5 | 97.6% |
| CVE-2008-2052 | 8 | 0 | n/a | 0.2% |
| CVE-2019-9670 | 8 | -12 | 9.8 | 97.5% |
| CVE-2021-41277 | 5 | 0 | 10 | 96.7% |
| CVE-2021-25369 | 4 | 0 | 6.2 | 0.1% |
| CVE-2018-20062 | 3 | -37 | 9.8 | 96.8% |
| CVE-2018-18775 | 2 | 0 | 6.1 | 0.2% |
| CVE-2019-12725 | 2 | -150 | 9.8 | 96.7% |
| CVE-2020-13167 | 2 | 0 | 9.8 | 97.4% |
| CVE-2021-21315 | 2 | 0 | 7.8 | 96.9% |
| CVE-2021-29203 | 2 | 0 | 9.8 | 95.6% |
| CVE-2021-33564 | 2 | 0 | 9.8 | 6.1% |
| CVE-2020-7796 | 1 | 0 | 9.8 | 74.8% |
| CVE-2021-33357 | 1 | 0 | 9.8 | 96.4% |
| CVE-2007-3010 | 0 | 0 | n/a | 97.3% |
| CVE-2018-7600 | 0 | 0 | 9.8 | 97.6% |
| CVE-2020-17496 | 0 | 0 | 9.8 | 97.5% |
| CVE-2020-25213 | 0 | 0 | 9.8 | 97.5% |
Table 1. Traffic volumes, change from the previous month, CVSS and EPSS scores for all vulnerabilities that were targeted in either May or June 2023.
One of the more interesting things in Table 1 is the low EPSS score of CVE-2022-24847. This was the third-most targeted CVE in our data last month, but the EPSS likelihood of future exploitation is a mere 1%. There could be many explanations for this—the score was slightly higher, around 2.6%, shortly after the vulnerability was released in April 2022, but subsided around 1% or lower by the beginning of May 2022. While we will never know why this particular vulnerability seems so uninteresting to EPSS when it is clearly being exploited in the wild, this shouldn’t be taken as an indictment of the efficacy of EPSS, which has been proven at scale.1 Perhaps our observations will help refine EPSS parameter weights in the future.
Targeting Trends
To better illustrate how June contrasts with previous months, Figure 2 shows how fourteen of the most heavily targeted vulnerabilities (the top five from each month of the past year) have ebbed and flowed in terms of attack volume and rank. Note that in this view two vulnerabilities stand out for their rapid growth: CVE-2019-9082 and CVE-2021-3129.
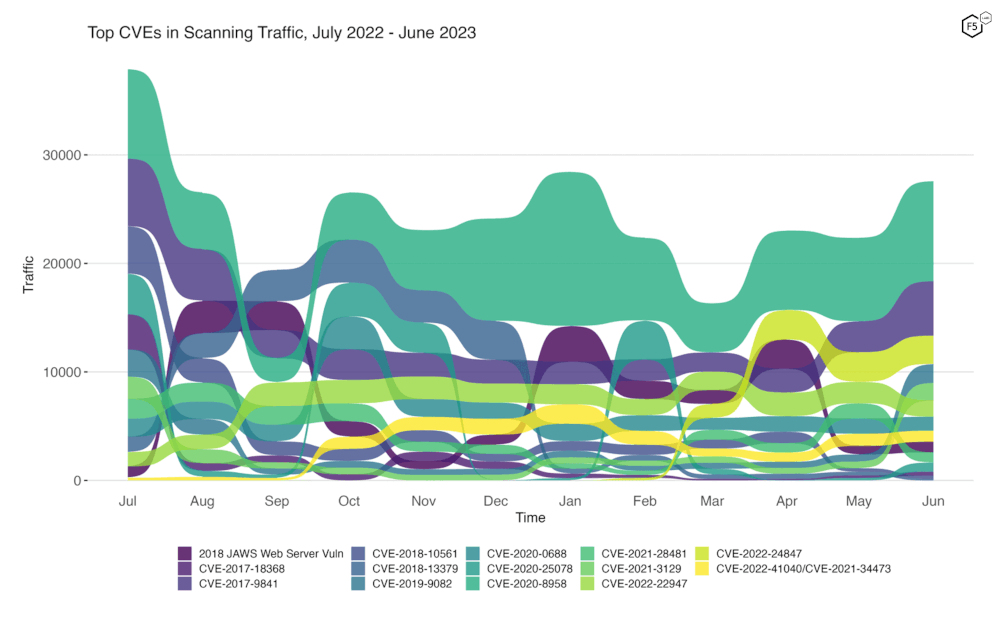
Figure 2. Evolution of vulnerability targeting trends over previous twelve months. This plot shows fourteen vulnerabilities which collectively represent the monthly top five for all twelve months. The rapid growth of CVE-2019-9082 and CVE-2021-3129 are visible in June.
Long Term Trends
Figure 3 shows traffic volume for the past year for all 70 of the tracked CVEs. Note the log10 scale on the y-axis. Other than some of the fluctuations we’ve discussed in above figures, not much changed last month.
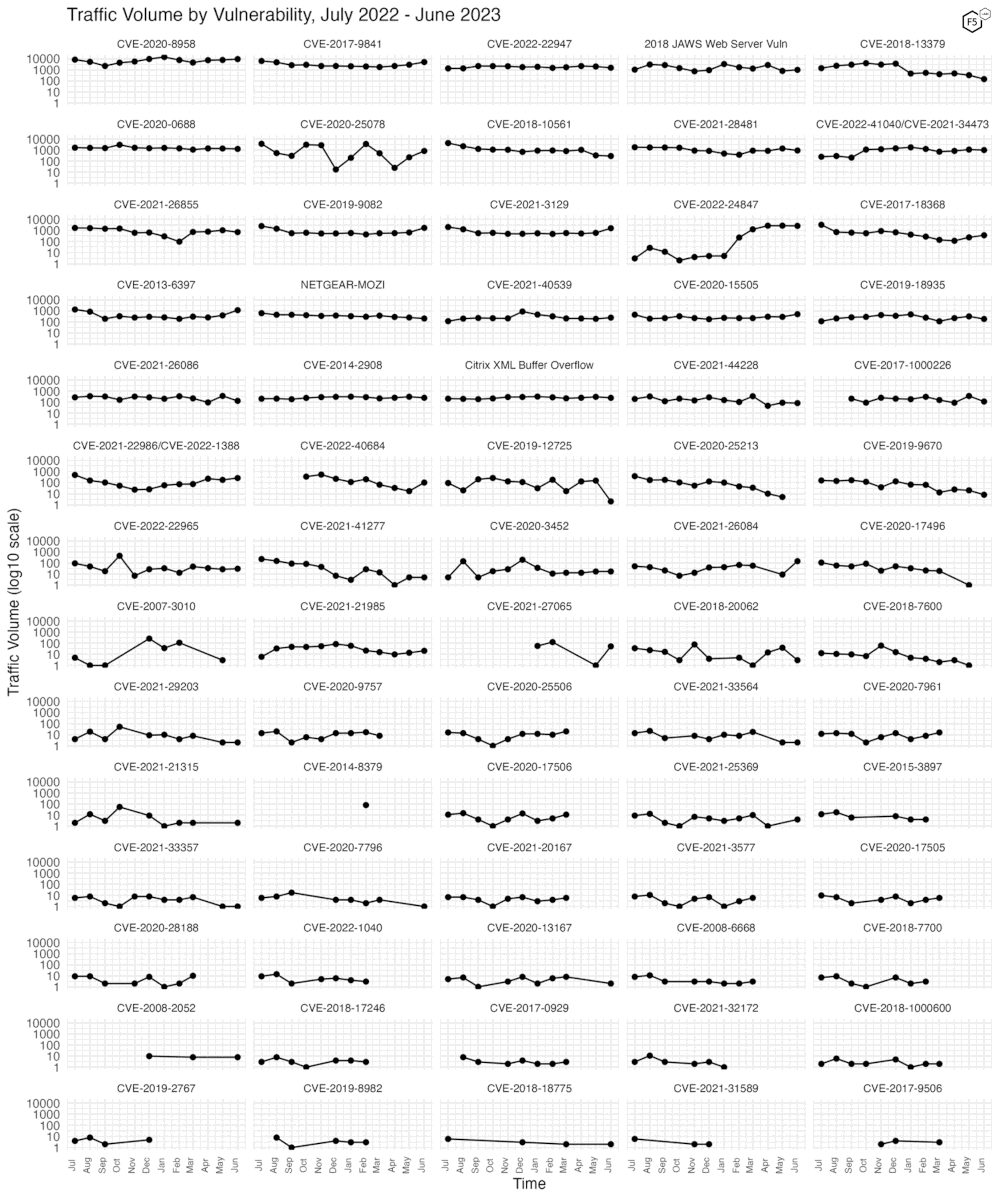
Figure 3. Traffic volume by vulnerability. June 2023 did not see much significant change in traffic volume for any notable CVEs.
Conclusions
The comparative stability in attacker trends according to our data brings to mind an analysis we looked at earlier this year. In February 2023 we published a report in collaboration with the Cyentia Institute2 examining the long-term history and evolution of the CVE Landscape. Figure 4, below, is an analysis from that report which plots the density with which CWEs were assigned to CVEs over time. In essence this figure shows the degree of dominance that any one type of vulnerability had over the landscape of new vulnerabilities at that time.
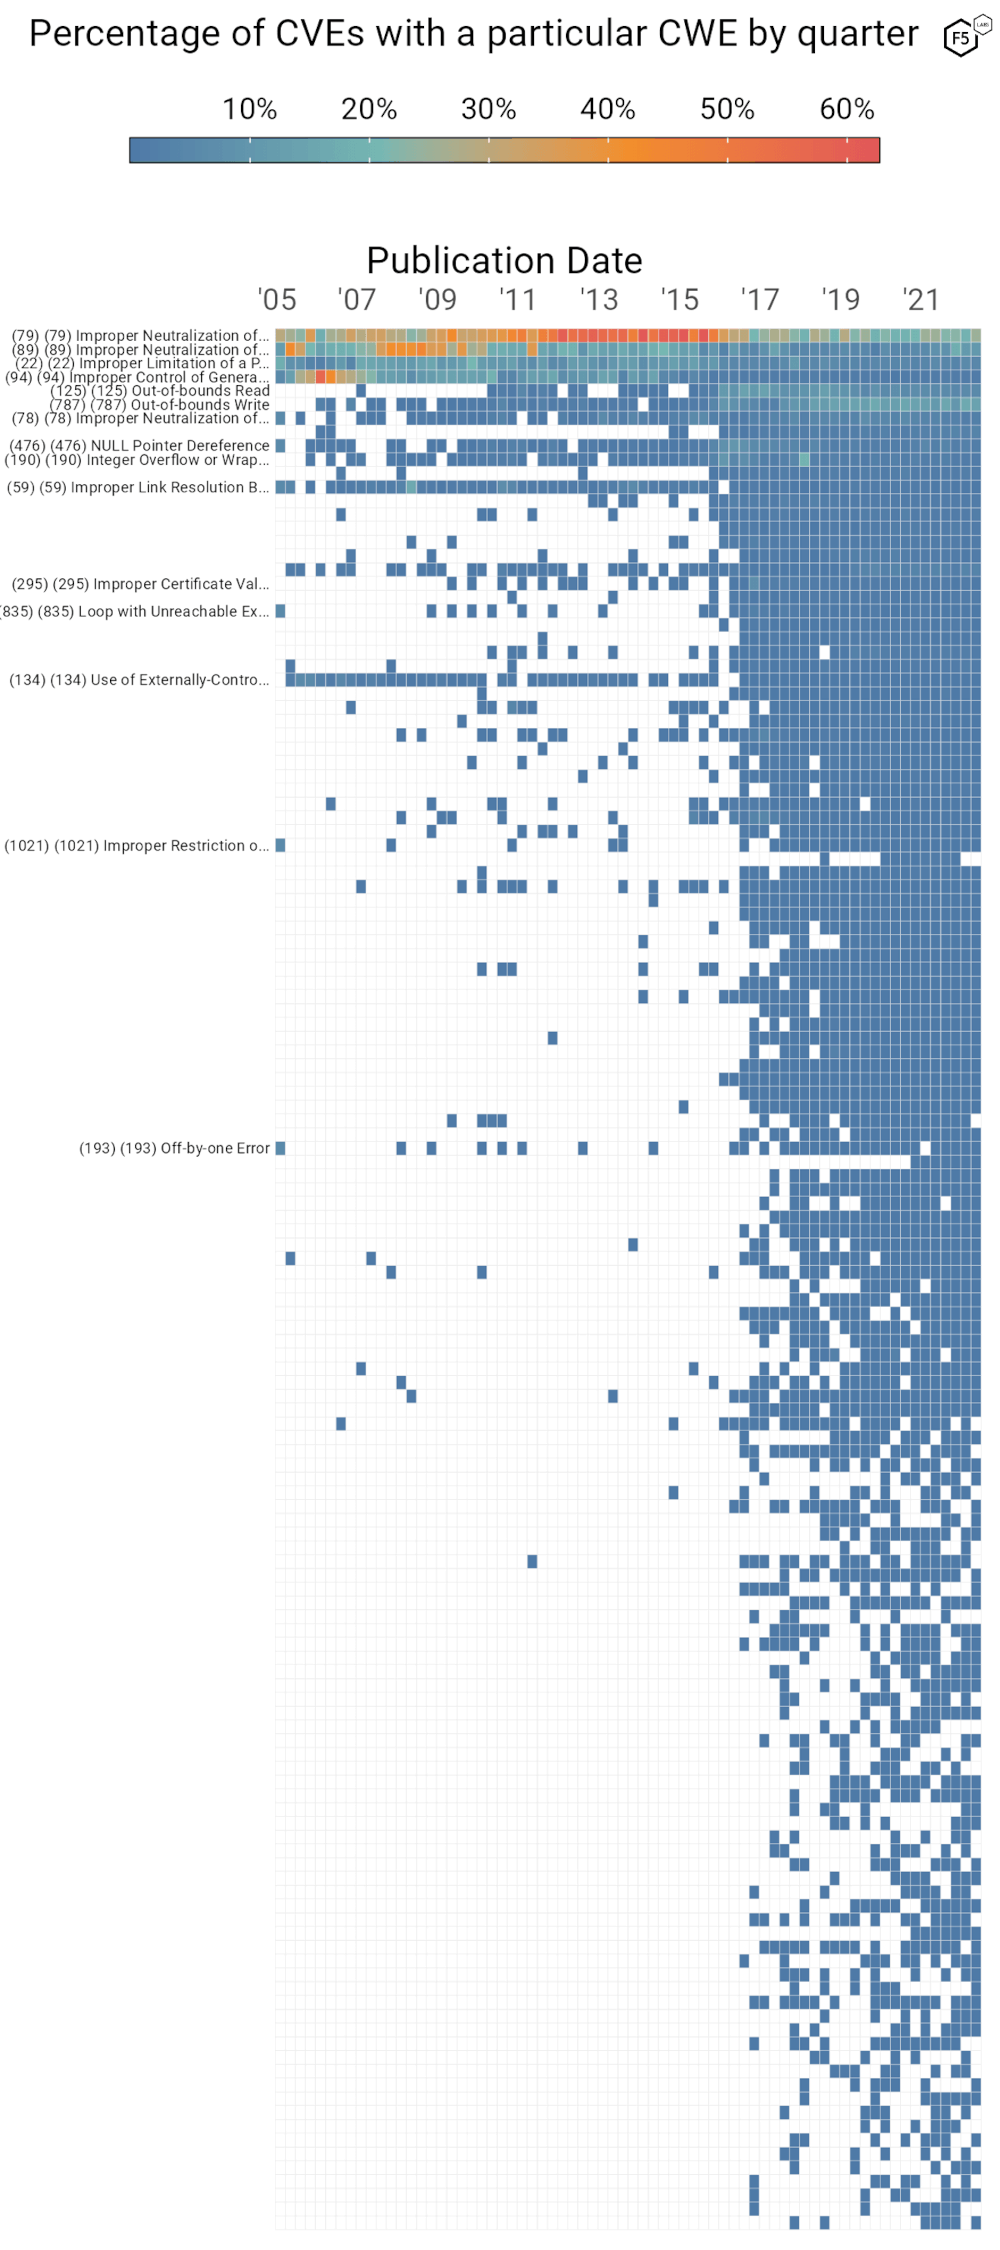
Figure 4. CWEs by percentage of CVEs published per quarter. Note the comparative diversity of CWEs in more recent CVEs as compared with the period 2005-2016.
The most glaring example of a predominant vulnerability type is visible in the top row, which is CWE-79: Improper Neutralization of Input During Web Page Generation, more commonly known as cross-site scripting (XSS). Cross-site scripting dominated the field of CVEs from 2011-2016, at times making up 60% of published vulns in a quarter. SQL injection was nearly as predominant from late 2007 to mid-2009.
In contrast to this, we currently abide in a period of expanding CWE diversity, with no one vulnerability type predominant. We haven’t yet had the time to explore the CWEs of the CVEs we track, but the trends in this latest traffic are also a reminder that old vulnerabilities never go away—witness the 10 year old Apache Solr CVE in our top ten this month. So while new vulnerabilities come from a much broader set of types, old favorites will most likely be one of these predominant types. We don’t have any answers on this line of inquiry at the moment, but we mention this CWE analysis just as another way to think about patterns and trends in terms of vulnerability management. And with that, we’ll see you in August, when the attackers will hopefully have done something more interesting.
Recommendations
- Scan your environment for vulnerabilities aggressively.
- Patch high-priority vulnerabilities (defined however suits you) as soon as feasible.
- Engage a DDoS mitigation service to prevent the impact of DDoS on your organization.
- Use a WAF or similar tool to detect and stop web exploits.
- Monitor anomalous outbound traffic to detect devices in your environment that are participating in DDoS attacks.


