Introduction
Black Friday is a popular shopping event throughout the United States of America and around the world. During Thanksgiving weekend and Cyber Monday (the Monday after Thanksgiving), thousands of companies offer steep product discounts that are not available at any other time, and consumers rush to buy these items while they are available. This can lead motivated buyers to resort to unethical techniques to purchase products, sometimes at the expense of other potential consumers, or carry out different forms of automated attacks.
Bot Automation Against Retailers
There is an expectation among security professionals that retail companies experience increased levels of bot attacks over the holiday shopping period, especially around Black Friday. We decided to look at 2022 data from online retailers around this period to test this expectation.
Using data from retail enterprises protected by F5 Bot Defense, we analyzed automated attacks against the online retail industry during the 2022 Black Friday period. This analysis covered automation patterns and trends over this period, using data spanning 8 weeks from July 28, 2022, to November 30, 2022. By leveraging this data, the fluctuations in automated attacks observed during the Black Friday period were compared against a baseline (before and after the black Friday and Cyber Monday sale periods).
Additionally, we explored attacker behaviors, including their testing and preparatory activities. This analysis provides a holistic understanding of attack trends against online retailers during this important shopping period.
We examined:
- The overall automated traffic targeting online retail companies in the weeks leading up to Black Friday.
- The daily percentage changes in automation on web and mobile platforms.
- The automation trends across different retail industry subcategories over this period.
- The distinct types of automated attacks that targeted each of these industry subcategories.
Online retailers are constantly exposed to unwanted automation. Automated bots are used against them in many ways, including credential stuffing/account takeover, gift card fraud, carding, scraping and checkout/reseller bots, to name just a few. Let’s start things off by defining the different kinds of automated bot attacks that retailers face, as well as some specific terms we use in our analysis.
Black Friday
When we refer to “Black Friday” in this article, we are referring to the day, November 25, 2022, while “Black Friday period” refers to the week leading up to and including the Black Friday weekend and Cyber Monday i.e. November 10th-30th, 2022.
Flows
When we refer to “Flows” in this article, we are referring to a category of endpoints on a website or mobile application. A group of endpoints related to authentication would be categorized as the Login flow.
Credential Stuffing
Credential stuffing is the use of stolen login credentials to gain unauthorized access to user accounts. This is sometimes the precursor to making fraudulent purchases.
Account Takeover
Account takeover is a form of attack where an unauthorized actor gains access to a user's online account without the account owner's permission. This can be achieved through several means including but not limited to credential stuffing, phishing, brute force, and malware.
Gift Card Fraud
Gift card fraud involves the use of bots to guess or brute force gift card numbers and PINs. This allows fraudsters to take over gift cards and spend them before the real owners of the gift cards have a chance to redeem them.
Scraping
Scraping involves the use of bots to collect information from an online retailer’s web or mobile application. This includes information about products for sale, their prices, variations, available inventory, discounts, deals, product specs and user reviews.
Reseller Bots
Reseller bots are designed to buy high-demand commodities faster than any human can, so that the reseller can sell them on the secondary market at a profit. Reseller bots were explored in detail by Tafara Muwandi in a recent article series.
Changes in Automation and Legitimate Traffic During the 2022 Black Friday
Our first analysis looked at the changes in both automated and legitimate traffic during the run up to the 2022 Black Friday period.
Legitimate Traffic Increased
Retail companies saw an increase in legitimate traffic leading up to Black Friday in 2022. This was to be expected as companies attracted customers with significant discounts. The steep rise in the green (legitimate) traffic in Figure 1 during the highlighted period indicates this increase as legitimate customers flocked to online retailers.
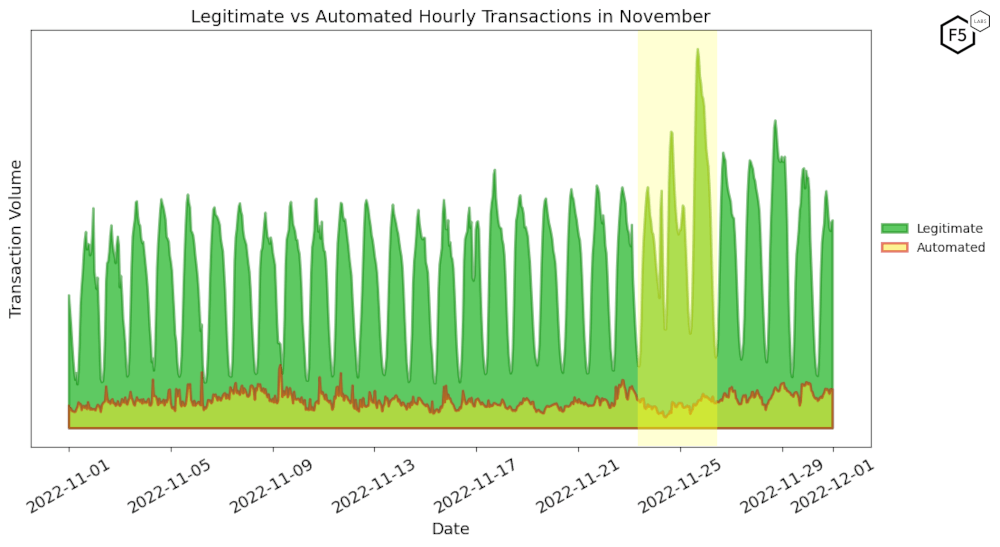
Figure 1: Legitimate vs. Automated Hourly Transactions in November 2022 showing an increase in legitimate traffic during the Black Friday period.
Automated Traffic Decreased
Over the same period, there does not seem to be a notable increase in the level of the automated (red-outlined) traffic. To evaluate if there was a change in automation levels over that time, we calculated the daily automated transaction volumes over the same period. It is evident that there was an unexpected decrease in the automation levels days before Black Friday (November 25) as highlighted in Figure 2.
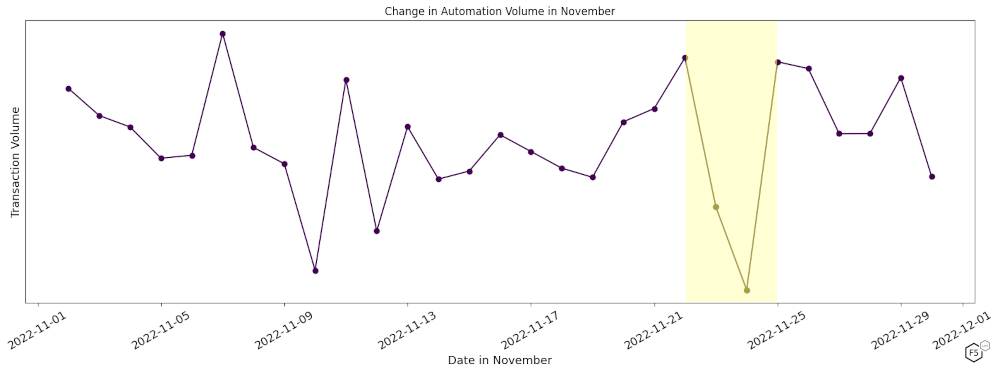
Figure 2: Change in Automation Volume in November 2022 showing a decrease in automation volume before Black Friday.
Daily Web Automation Percentage Increased
Additionally, we calculated the daily percentage of automation that online retailers faced over the same period. This percentage was calculated by dividing the total daily automated transactions identified by F5 Bot Defense, by the daily total transactions, both automated and legitimate.
This shows that the daily percentage automation that online retailers faced on web endpoints rose at least three weeks before Black Friday, while Mobile did not show any uptick in daily automation percentages during the same period. The uptick in web automation is shown in the highlighted area of Figure 3. This uptick in activity could be attributed to early testing of automated tools in preparation for Black Friday, or it may be that the automation simply aligns with previous fluctuations in web automation.
The yellow rectangle on the chart refers to the uptick in the automation targeting web platforms at the start of the Black Friday period. The Black Friday period spans the 10th to the 30th November, 2022 and is the time range where we expected to see the most automated activity related to Black Friday sales.
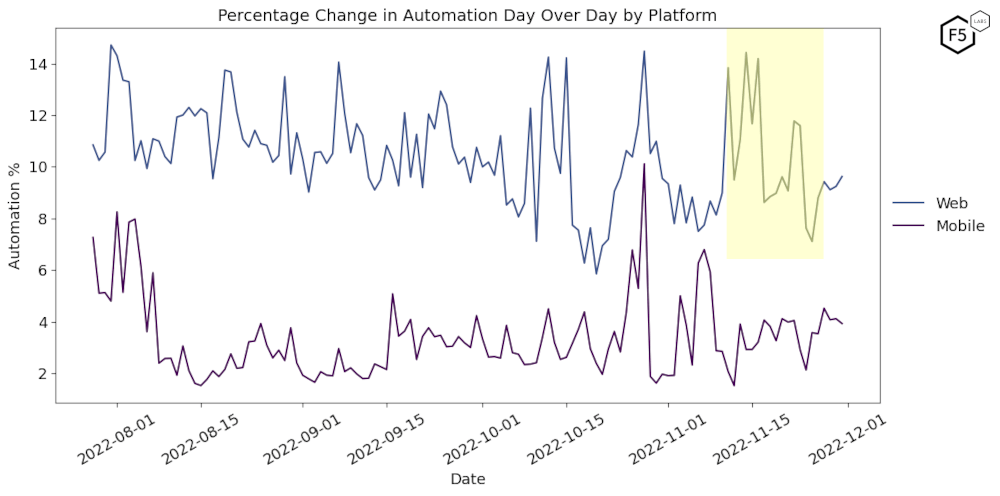
Figure 3: Percentage Change in Automation Day Over Day by Platform showing the uptick in automation targeting web platforms during the Black Friday period.
Breakout by Web vs. Mobile Endpoints and Industry
To best answer the question of what changes we observed during the 2022 Black Friday period, we have split the data into Web vs Mobile. This is because the experiences on these two platforms were different, as shown in Figure 3 above. Web experienced a significant increase in automation leading up to Black Friday while Mobile did not.
Additionally, we also split the data into industry subcategories. The online retail industry includes different kinds of enterprises from quick service restaurants offering food delivery to large grocery chains, to eCommerce marketplaces, along with many other kinds of businesses. Their experiences during the Black Friday period are also markedly different; hence it made sense to split them out to give a clearer picture.
We split up online retailers into the following subcategories:
- Fashion: this section of retail business that acts as an intermediary between clothing manufacturers and customers.
- Quick Service Restaurants (QSR): these are restaurants categorized by fast service, a casual atmosphere, limited seating, and a focused menu.
- eCommerce: these companies buy and sell goods and services not limited to clothing over the Internet.
- Grocery: operations that sell food to consumers for off-premise consumption.
Web Automation
Figure 4 shows Web automation percentage for each industry subcategory over the entire period, with the Black Friday period highlighted in yellow. Note the dramatic increase in automation against the Grocery sub-category.
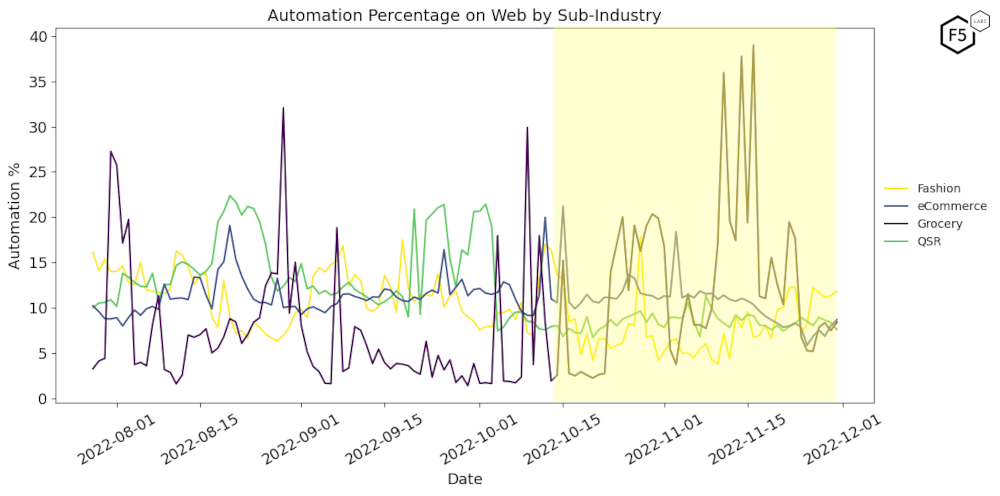
Figure 4: Automation Percentage on Web by Subcategory, August-November 2022, showing a dramatic increase in automation against the Grocery subcategory.
To gain a deeper understanding of the daily fluctuations in the level of automation for various subcategories of retail companies in November 2022, we computed the absolute difference in the percentage of automation between all consecutive days in November 2022. This automation change was determined by subtracting the automation percentage of the previous day from the current day. For example, if one day exhibited 15% automation and the day before had 10%, the automation change would be 5% (15% - 10%). We conducted this analysis for all subcategories within the industries and present the findings in Figure 5 below.
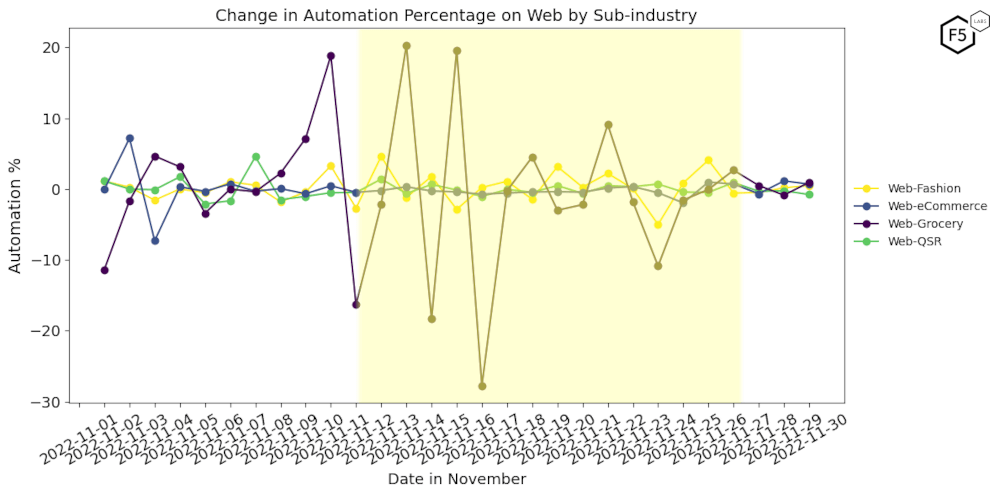
Figure 5: Change in Automation Percentage on Web by Subindustry in November 2022, showing great change in automation percentage against the Grocery subcategory.
Grocery Saw the Largest Increase in Automated Attacks
Figure 4 above shows that Grocery companies' websites experienced the largest increase in automation during the Black Friday period. Automation levels for the Grocery subcategory increased from low single digit percentages (the lowest automation across all subcategories) in the weeks leading up to Black Friday, to peaking at above 35% (the highest of all subcategories) during the 2022 Black Friday period.
As depicted in Figure 5 above, the Grocery subcategory also experienced the highest fluctuations in Web automation levels during the month of November 2022. The surge in automation percentage was particularly prominent in the weeks leading up to Black Friday, possibly associated with preparatory actions undertaken by threat actors for the impending Black Friday shopping period. Moreover, most businesses begin their promotional campaigns well in advance of the holiday season. This could be a factor in the absence of clear seasonal patterns in automation trends during the holiday period. Once the holiday is over, there is often a notable decline in enthusiasm for holiday-specific foods, which likely contributes to the observed decrease in automation levels beginning from Thanksgiving.
eCommerce Saw an Initial Increase in Automation
Figure 4 above shows that eCommerce companies also experienced an increase in automation a week before the Black Friday period began on their Web platforms. However, this increase in automation was only observed on November 3rd with a peak of 19%. After the uptick in automation, we saw a gradual decline in the percentage of automation seen by eCommerce companies throughout the remainder of November.
The previously observed increase in automation on November 3rd can be seen in Figure 5 with an increase of 8% from the automation percentage on the previous day. In addition, the percentage of automation stayed constant with the only significant decrease in automation being on November 25th (Black Friday).
Quick Service Restaurants Saw an Initial Increase in Automation, Just Like eCommerce Companies
QSRs showed the same pattern exhibited by eCommerce companies on their web platforms. Just like the uptick observed in Figure 4 for eCommerce companies before the Black Friday period began, two increases were also seen on QSRs web endpoints. These increases had a peak of 10.5% on November 4th and 11% on November 7th. The increases in automation were not as significant as that of eCommerce companies which reached a peak of 19%. Throughout the month of November, QSRs, just like eCommerce companies, saw a decline in their automation percentage.
Fashion Saw a Gradual Increase in Automation
Fashion companies saw a gradual increase in automation during the Black Friday period highlighted in Figure 4. This increase could be in line with the gradual anticipation of Black Friday sales and promoted discounts on Fashion websites. The automation that Fashion companies experienced was observed at 5% on November 10th, and gradually increased to a peak of 12% on November 25th (Black Friday). Also, looking into the month of November in Figure 5, it is also clear that Fashion companies saw a decline in automation on November 24th (Black Friday eve) with a decrease of approximately 5%, only to increase again on Black Friday itself (November 25th).
Overall Distribution of Attack Types Did Not Change
Further investigation revealed that the types of attacks and their proportions targeting retail websites did not change significantly during the Black Friday period. This is shown in Figure 6 which displays the Flows/endpoints targeted by the automation.
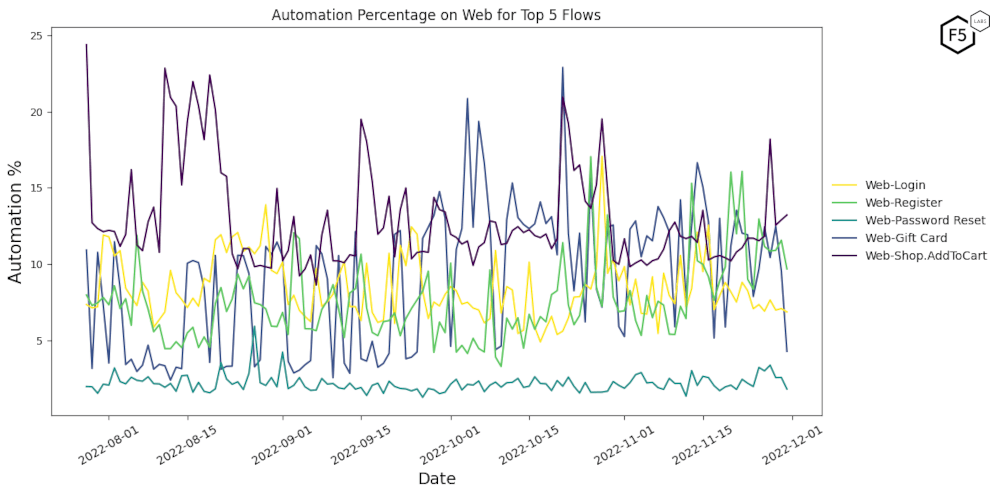
Figure 6: Automation Percentage on Web for top 5 flows including login, register, password reset and shopping cart functions.
Increase in Web Grocery Automation Due to Attacks Against Login and Register Flows
Figure 7 looks at the Flows/endpoint distribution of attacks against the Grocery subcategory. This sheds more light on the objective of the large spikes in Web automated traffic hitting this online retail subcategory.
Although Grocery companies experienced fluctuations in their automation (Figure 7), it is visible that most of the automation targeting the Grocery companies was aimed at the Login and Register flows. This means that there were credential stuffing and account takeover attacks attempted on Grocery company websites, or that fake account creation bots were trying to access their own accounts.
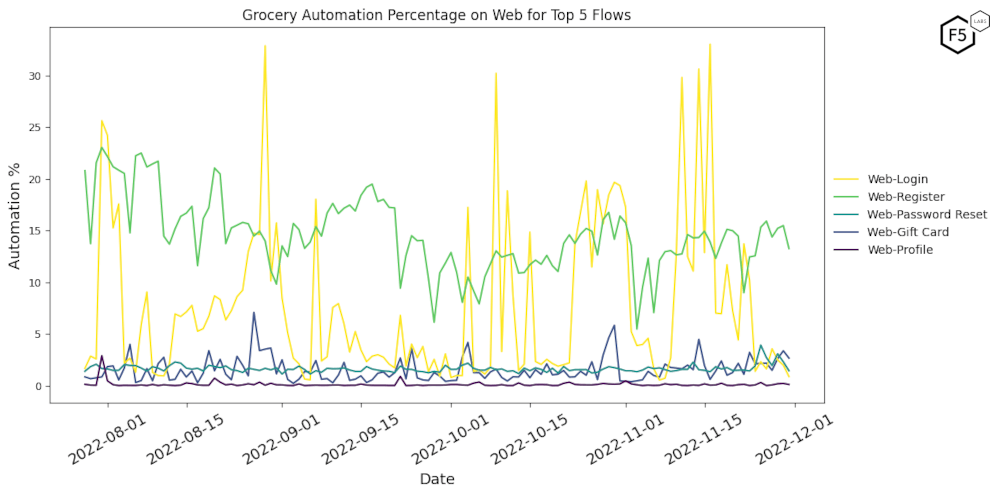
Figure 7: Grocery Automation Percentage on Web for top 5 flows including login, register, password reset and shopping cart functions.
Mobile Automation
Mobile was also sub-divided into the same industry subcategories. Figure 8 below shows the Mobile percentage automation across these 4 industry subcategories for the analysis period.
Fashion and eCommerce Experienced the Largest Surges in Mobile Automation
Figure 8 shows that Fashion companies witnessed a peak automation level of 24% on October 28th and 15% on November 6th. Meanwhile, eCommerce entities also experienced a peak automation rate just before November, at 16% on October 27th. The automation that Fashion enterprises faced during the highlighted Black Friday period exhibited a gradual increase, only to drop once the sales ended. Additionally, eCommerce endpoints had a significant spike attaining a peak of 11% automation on November 25th (Black Friday) only to drop after the sales concluded.
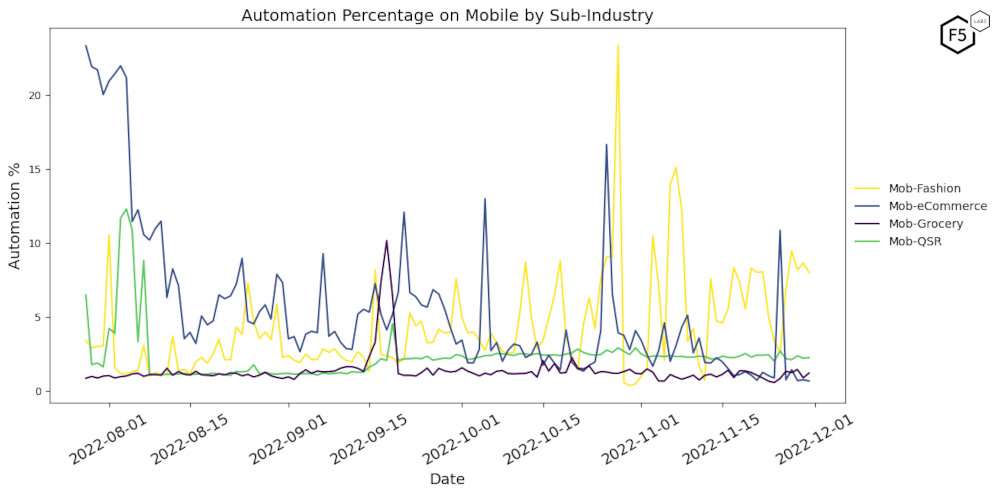
Figure 8: Automation Percentage on Mobile by Sub-industry, August-November 2022.
Like Figure 5 in the Web section, Figure 9 below computes the absolute difference in the percentage of Mobile automation between all consecutive days in November 2022. This automation change was determined by subtracting the automation percentage of the previous day from the current day.
In Figure 9, the Fashion subcategory saw above-average increases in automation at several points in November 2022, with the largest increases observed on November 3rd (8%) and November 6th (12%). These increases spanned across the three-week period directly preceding Black Friday. One would generally expect automation to peak when sales are happening and not weeks before. Additionally, the automation that Fashion industries faced appears to be much more stable around the Black Friday period than it was in early November. Another notable outlier was the eCommerce subcategory, which saw a 10% increase in automation on November 25th. This lines up with the dates for Black Friday sales.
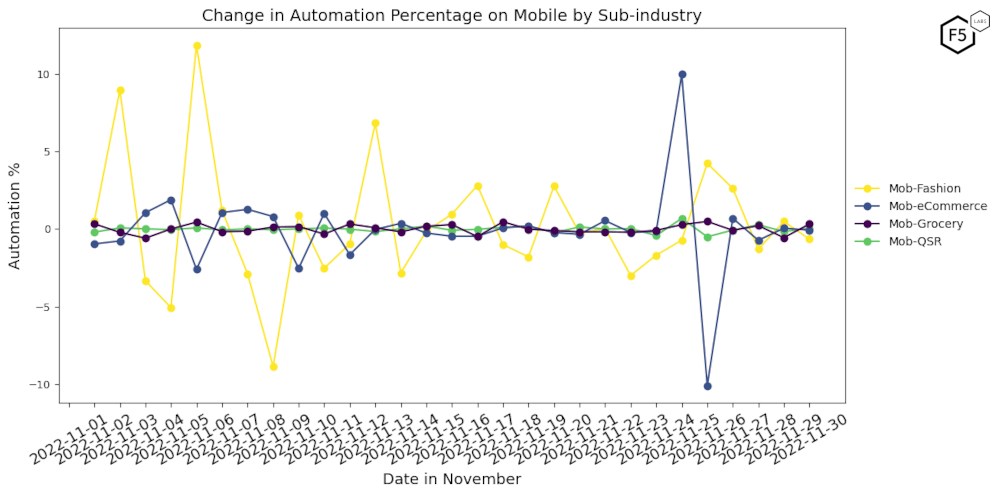
Figure 9: Change in Automation Percentage on Mobile by Sub-industry, November 2022.
Figure 10 below dives deeper into the Mobile automation targeting the Fashion subcategory. It analyzes the automation by different flows/endpoints like Figure 7 above (for Web automation in the Grocery subcategory). This is also to allow a deep dive into the objective of the large increase in Mobile automation targeting the Fashion online retail subcategory.
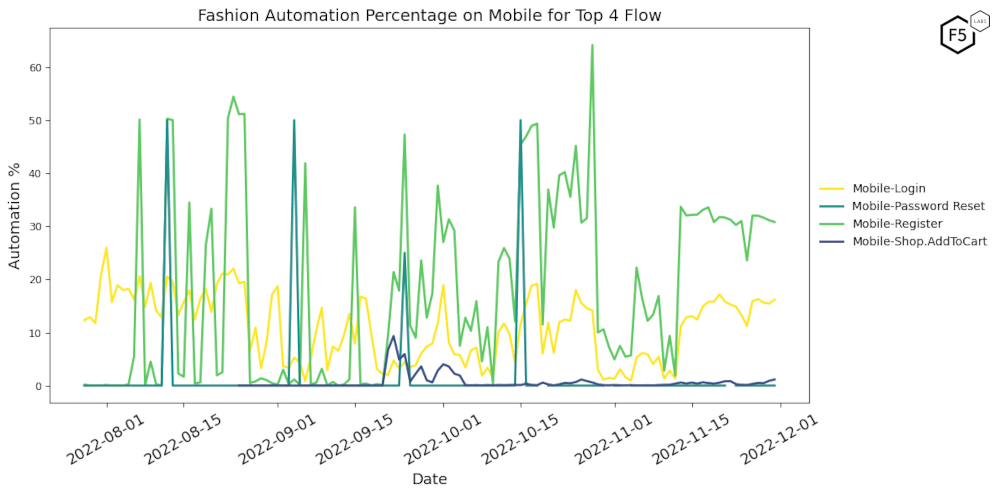
Figure 10: Fashion Automation Percentage on Mobile for top 4 flows, August-November 2022.
Mobile Automation in the Fashion Subcategory Also Targeted Login and Register Flows
Further investigation in Figure 10 above revealed that most of the Fashion industries automation was targeting the Login and Reset Registration flows/endpoints during the highlighted Black Friday period. The targeting of the Login and Register flows shows a continued pattern of either threat actors attempting to carry out Credential Stuffing and Account Take Over attacks, or fake account activity as seen in Figure 7. With that being said, Figure 10 does reveal a downtick in attacks during Black Friday.
Figure 11 is similar to Figure 10 and dives deeper into Mobile automation targeting the eCommerce subcategory. It analyzes the automation by different flows/endpoints. This is also to allow more light to be shed on the objective of the large increase in Mobile automation targeting this retail subcategory.
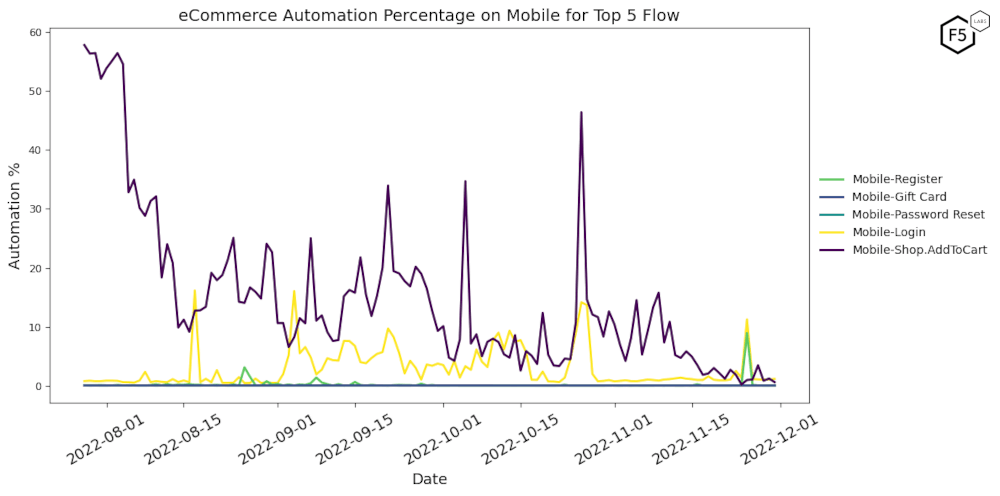
Figure 11: eCommerce Automation Percentage on Mobile for top 5 flows, August-November 2022.
Mobile Automation in eCommerce Against Login and Register Flows Decreased
The eCommerce industry saw the opposite trend in Figure 11 to that seen on the Fashion industries mobile flows in Figure 10. The automation targeting Login and Register flows decreased weeks leading up to Black Friday but had an uptick on November 25th (Black Friday). This means that eCommerce companies largely saw a decrease in fake account creation, credential stuffing and account takeover attacks on their mobile endpoints in November 2022, except for the actual day of Black Friday sales when they saw a marked jump.
Mobile Automation Difference Between Fashion and eCommerce
The different trends observed on Mobile between the Fashion and eCommerce subcategories may be due to the fact that Fashion companies usually advertise and start sales early in order to be “first to wallet”, that is, to entice customers to spend their perhaps limited budget for clothes with the retailer who advertises to them first. This could be why we saw consecutive bot attacks throughout the month of November leading up to and including the Black Friday period. eCommerce companies tend to have their sales around Cyber Monday which is the Monday after Black Friday. This difference in the timing of sales and promotions may explain the different automation trends experienced by these online retail industry subcategories.
Sophistication of Automation Against Websites and Mobile Applications
Automation was divided and classified into 3 sophistication levels, low, medium, and high.
- Low sophistication: Unsophisticated automation is not capable of actually loading any content of a webpage or mobile application and conducts interactions using only basic HTTP requests.
- Medium sophistication: Automation at this level successfully presents information consistent with the presence of a browser or mobile device, such as executing JavaScript, but lacks the capability to mimic legitimate users in any advanced way.
- High sophistication: Automation considered high sophistication typically interacts with a web page or mobile application with frameworks which mimic legitimate devices and human behaviors including mouse movements and semi-random timing.
Web Automation Sophistication Level Increased From Low to High
Figure 12 refers to the proportions of the different levels of attacks endured by retail companies’ websites from August to November 2022. In the chart below, the yellow bars represent the proportion of the daily traffic that was of low sophistication, blue represents the medium sophisticated automation and purple refers to the highly sophisticated bot automation. Analyzing the long term trend captured by Figure 12, it is clear that the proportion of low automation gradually decreased as the proportion of highly automated traffic increased.
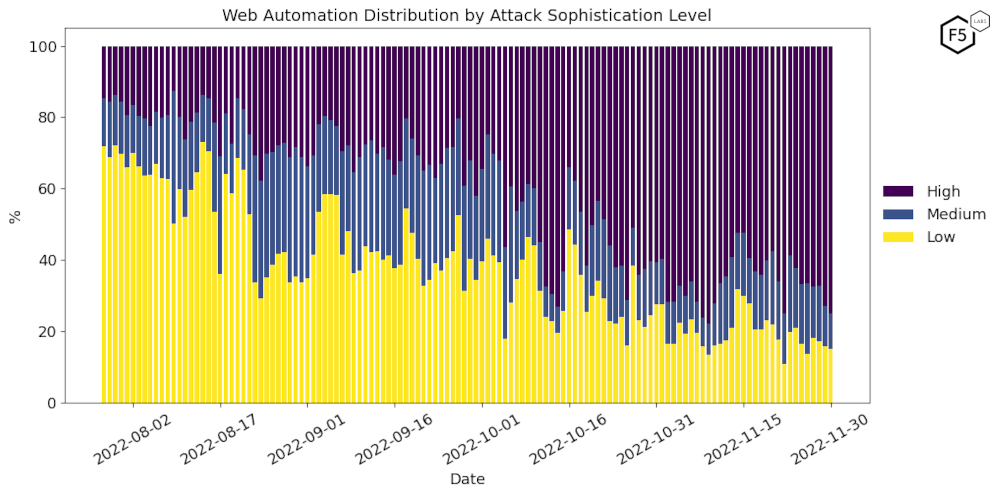
Figure 12: Web Automation Distribution by Attack Sophistication Level, August-November 2022.
At the beginning of the reporting period, low sophistication bot automation made up 70% of the daily transactions on retail websites and 15% of the automation was attributed to highly sophisticated automation. At the end of the highlighted reporting period, 70% of the daily transactions on retail websites were of the highest sophistication with approximately 15% being of low sophistication. This means that bot automation previously on the HTTP level turned into automation that mimics legitimate devices and human behaviors. With that being said, the proportion of medium sophisticated automation did not have any significant change while comparing the beginning and end of the reporting period.
Mobile Automation Sophistication Level Increased From Low to Medium
Figure 13 refers to the proportions of the different levels of attacks endured by retail companies’ mobile properties from August to November 2022. In the chart below, the yellow bars represent the proportion of the daily traffic that was of low sophistication, blue represents the medium sophisticated automation and purple refers to the highly sophisticated bot automation. Analyzing the long term trend captured by Figure 13, it is clear that the proportion of low automation gradually decreased as the proportion of medium automated traffic increased.
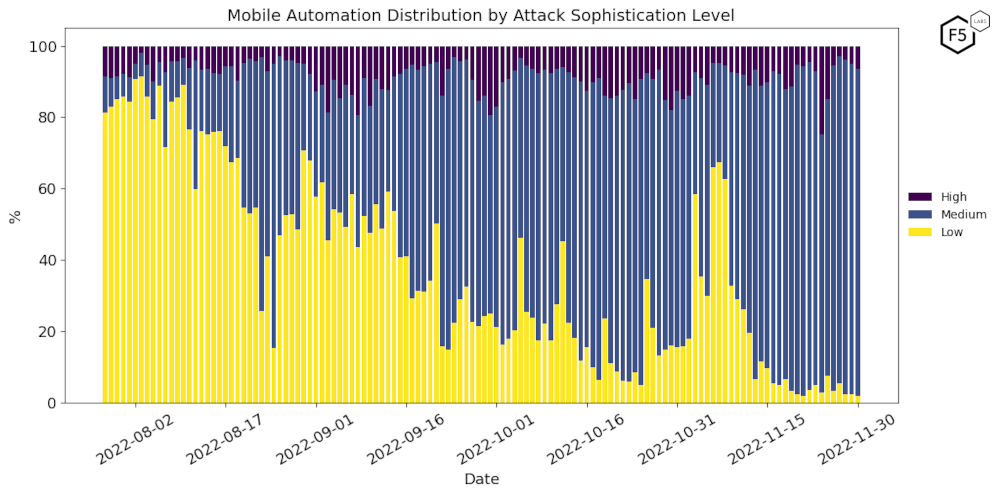
Figure 13: Mobile Automation Distribution by Attack Sophistication Level, August-November 2022.
At the beginning of the reporting period, low sophistication bot automation made up 82% of the daily transactions on retail mobile properties and 8% of the automation was attributed to medium sophisticated automation. At the end of the highlighted reporting period, 2% of the daily transactions on retail websites were of low sophistication with approximately 90% being of medium sophistication. This means that bot automation previously on the HTTP level turned into automation that successfully presents information consistent with the presence of a browser or mobile device. With that being said, the proportion of highly sophisticated automation did not have any significant change while comparing the beginning and end of the reporting period.
Why Automation During the Black Friday Period Was of the Highest Sophistication
This decrease in the volume of low sophistication automation on web and mobile properties can be ascribed to a few reasons. These include greater risk of detection as low-level automation can be more easily detected by security systems. Additionally, a shift in attack objectives as attackers may shift their focus away from low-level automation for different purposes, such as the use of reseller bots, which can be more lucrative and damaging. Furthermore, retail companies and the cyber security community are becoming better at sharing information about threats and vulnerabilities. This collective knowledge can lead to more effective defenses against low-level automation over a longer time frame. With that being said, the previously stated reasons may have consequently led to retail companies experiencing their highest levels of medium-high sophisticated automation during the Black Friday period.
Conclusion
In our investigation into whether security professionals’ expectations that online retailers experienced higher levels of unwanted automation during the black Friday shopping period, we discovered some interesting and unexpected insights. For starters, the demand for online goods led to an increase in the volume of legitimate users during this period. Additionally, there were differences in the automation trends on Web and Mobile properties.
Regarding Web platforms, we observed that most industry subcategories did not experience a significant increase in automation activity except for Grocery which saw a large increase in attacks against Login and register flows/endpoints during the Black Friday period. Ecommerce on Web also saw an increase in automation, though not as drastic as Grocery enterprises. Mobile Fashion and Mobile eCommerce subcategories saw the largest surges in automation, both mainly in automation against login and register flows/endpoints. The timing of the increase in Mobile automation in these two subcategories differed significantly, likely due to the differences in the timing of the sales between these industry subcategories.
Lastly, there was a substantial increase in the level of automation sophistication during the Black Friday period. On Web, attacks moved from low to high sophistication, while on Mobile they increased from low to medium sophistication. Overall, though there are some instances where attacks do increase during the Black Friday shopping period for specific subcategories and flows/endpoints, on aggregate there is no strong evidence of such a trend across the retail landscape.


