In July 2018, F5 released its first annual Application Protection Report based on the results of an F5-commissioned Ponemon survey of 3,135 IT and security practitioners across the globe. Additional research conducted by Whatcom Community College, University of Washington Tacoma, along with data from White Hat Security and Loryka served to make this one of the most comprehensive application protection reports available today. In it, we provide a practical model for understanding the complexities of web applications; we look at the cold, hard facts about how, why, where, and how frequently apps are attacked; and we suggest concrete steps that security professionals can take today to protect their applications.
Based on the breadth of data examined, the full report provides aggregate global averages of our findings across all industry sectors. Yet, there were clearly distinct differences in data collected and survey responses across specific industries that are useful to examine more closely. This article explores those differences in greater depth.
Industry Breakdown
The 3,135 cyber-security professionals we surveyed in the US, Canada, United Kingdom, Brazil, China, Germany, and India represented 16 industries in total. By far, most respondents were from the Financial Services, Industrial & Manufacturing, Public Sector, Health & Pharmaceuticals, and Technology & Software industries. A fair number of respondents represented Retail, Services (that is, companies providing consulting and/or business services rather than tangible goods), Energy & Utilities, Consumer Products, Communications (typically, voice, data, and video-transmission providers), and Entertainment & Media companies. Individual industries that represented less than 1% of respondents—Defense & Aerospace, Agriculture & Food Service, and Transportation—are represented as “Miscellaneous” in Figure 1.
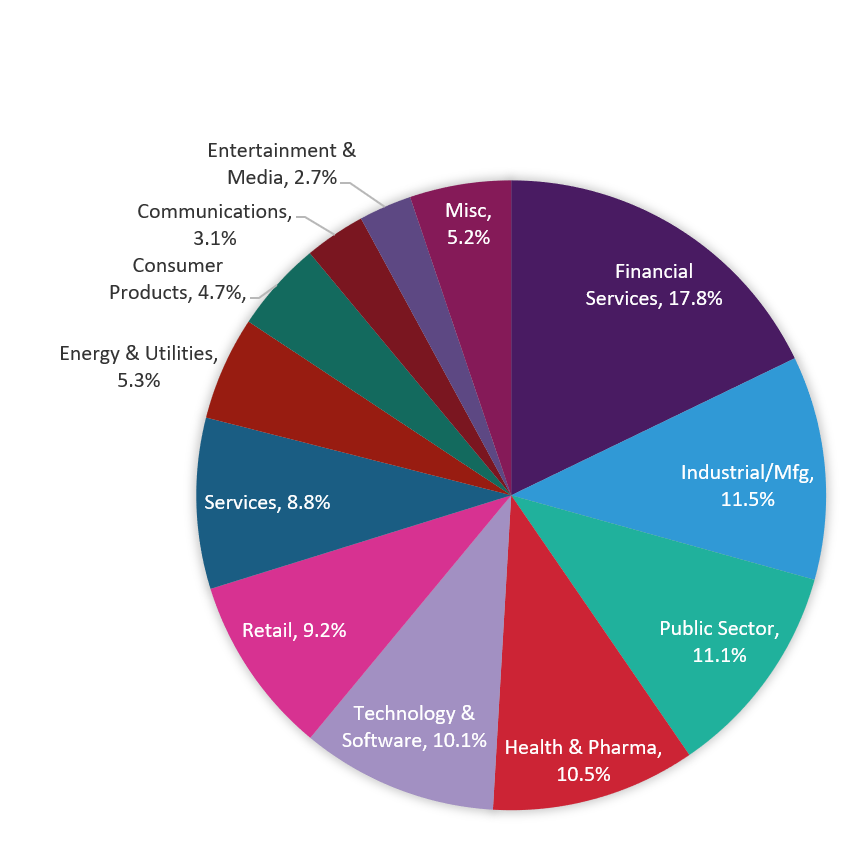
Figure 1: Industry breakdown of survey respondents
It’s not surprising that most respondents (17.8%) represent the Financial Services sector as it is the most mature in terms of cyber-security posture1—and it is among the most targeted.2
Application Usage
To set the context for any discussion of risk, we need to understand what applications organizations are using and their criticality to the organization. Our first group of survey questions focused along these lines, and we saw some interesting differences in how industry sectors answered.
How many web applications does your organization use today?
The number of applications in use tells us a lot about an organization’s dependence on applications and technology. Across industry sectors, there was significant variation in number of applications in use. The average was found to be 760, with Financial Services reporting the most (1,106), and Energy & Utilities reporting the least (485), as shown in Figure 2. By any measure, 485 is no small number. The fact that all industries surveyed use 485 or more apps reveals how heavily today’s organizations depend on web applications. But clearly, the Financial Services number stands out, being significantly higher than other industries. This might be due to size and sophistication required in processing financial transactions, loan origination, and accounting.
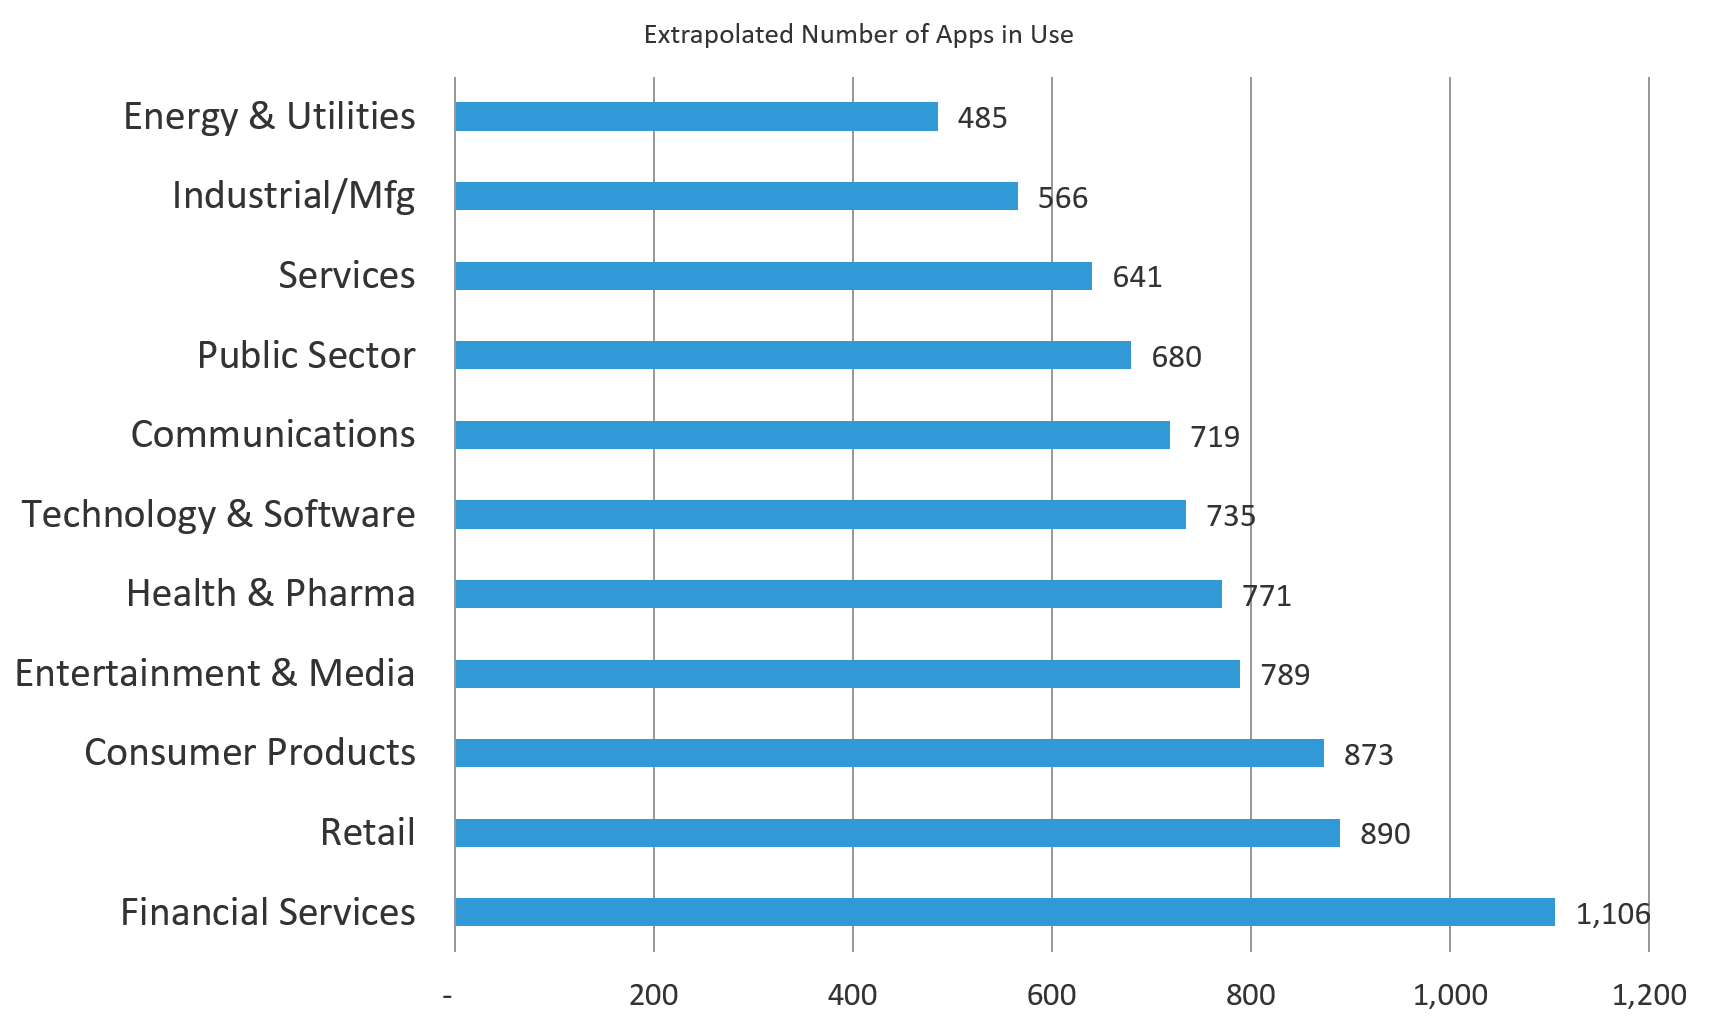
Figure 2: Financial Services firms use more than twice as many applications as the Energy & Utilities companies
What percentage of Web applications do you consider mission-critical?
We all know that some applications are more important than others within any organization, but what percentage did respondents consider mission-critical? For the most part, the percentage identified by respondents seems to match up with the number of applications in use—Financial Services reported the highest percentage (44%) while Industrial/Manufacturing reported the lowest (30%). A notable exception was the Technology & Software sector, identifying 42% of its apps as mission-critical, coming in just behind Financial Services. Given the nature of their business, it’s not a surprise that tech companies depend on a lot of technology to function.
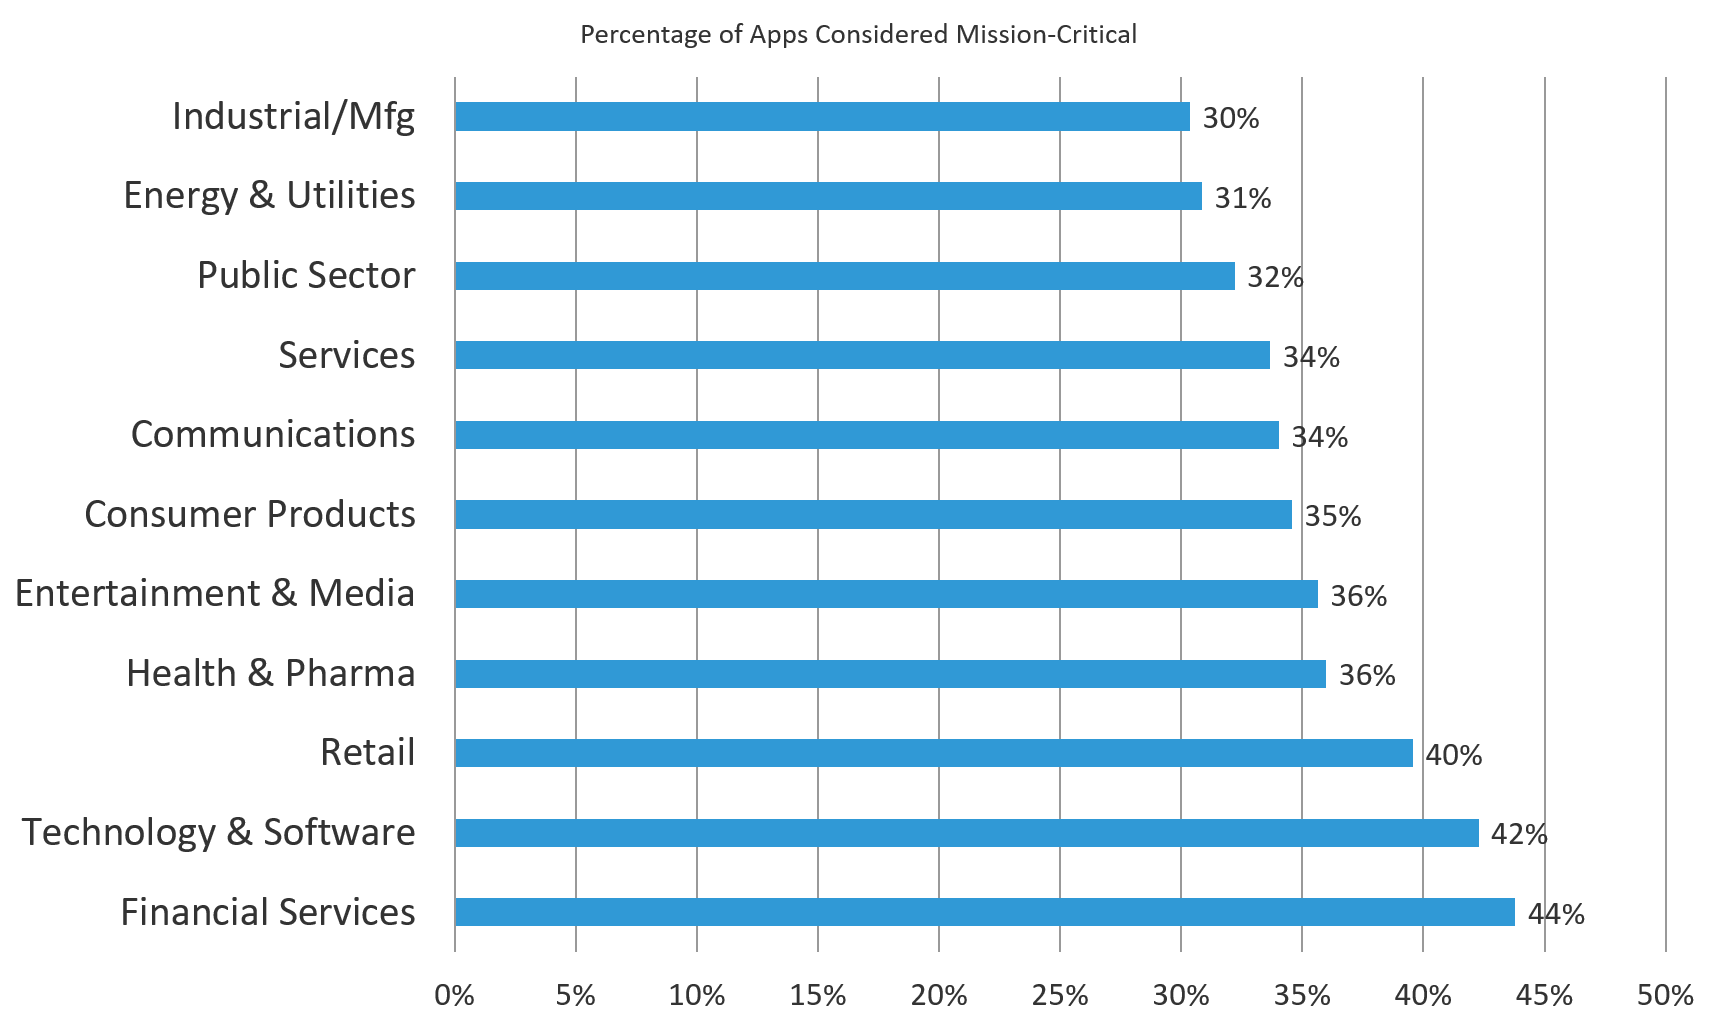
Figure 3: Nearly all industries identified one-third or more of their apps as mission-critical
What are the top three web applications most important to your organization’s mission?
We also asked respondents to identify the three most important applications to their organizations’ mission. In general, the top three choices were consistent across all industries, but their prioritization differed. Table 1 shows how different sectors ranked their three most important apps.
| Web App Type | Most chosen as #1 | Most chosen as #2 | Most chosen as #3 |
| Document management & collaboration |
|
|
|
| Office suites |
|
| |
| Communication apps (such as email, texting) |
|
|
|
Table 1: How different industries ranked the top three apps to their organization
How many web application environments/frameworks are in use?
With large numbers of applications comes increases in complexity. If you’ve got a lot of applications, then you end up having to support multiple infrastructures—which means additional developers, patching cycles, and control strategies. In short, the more web application environments and frameworks you use, the higher your defense costs.
What’s interesting in these responses is that Energy & Utilities, which uses the least number of apps, tops the list with the most number of environments. In contrast, heavy app users like the Technology & Software and Financial Services sectors have smaller footprints. This may be due to specific requirements of the Energy & Utilities industry, which could be more varied than Technology & Software or Financial Services, where single-vendor solutions are often preferred. In terms of hard numbers, however, Figure 4 shows there still isn’t a lot of spread between the different sectors—most use somewhere between 8 and 10 web app environments or frameworks.
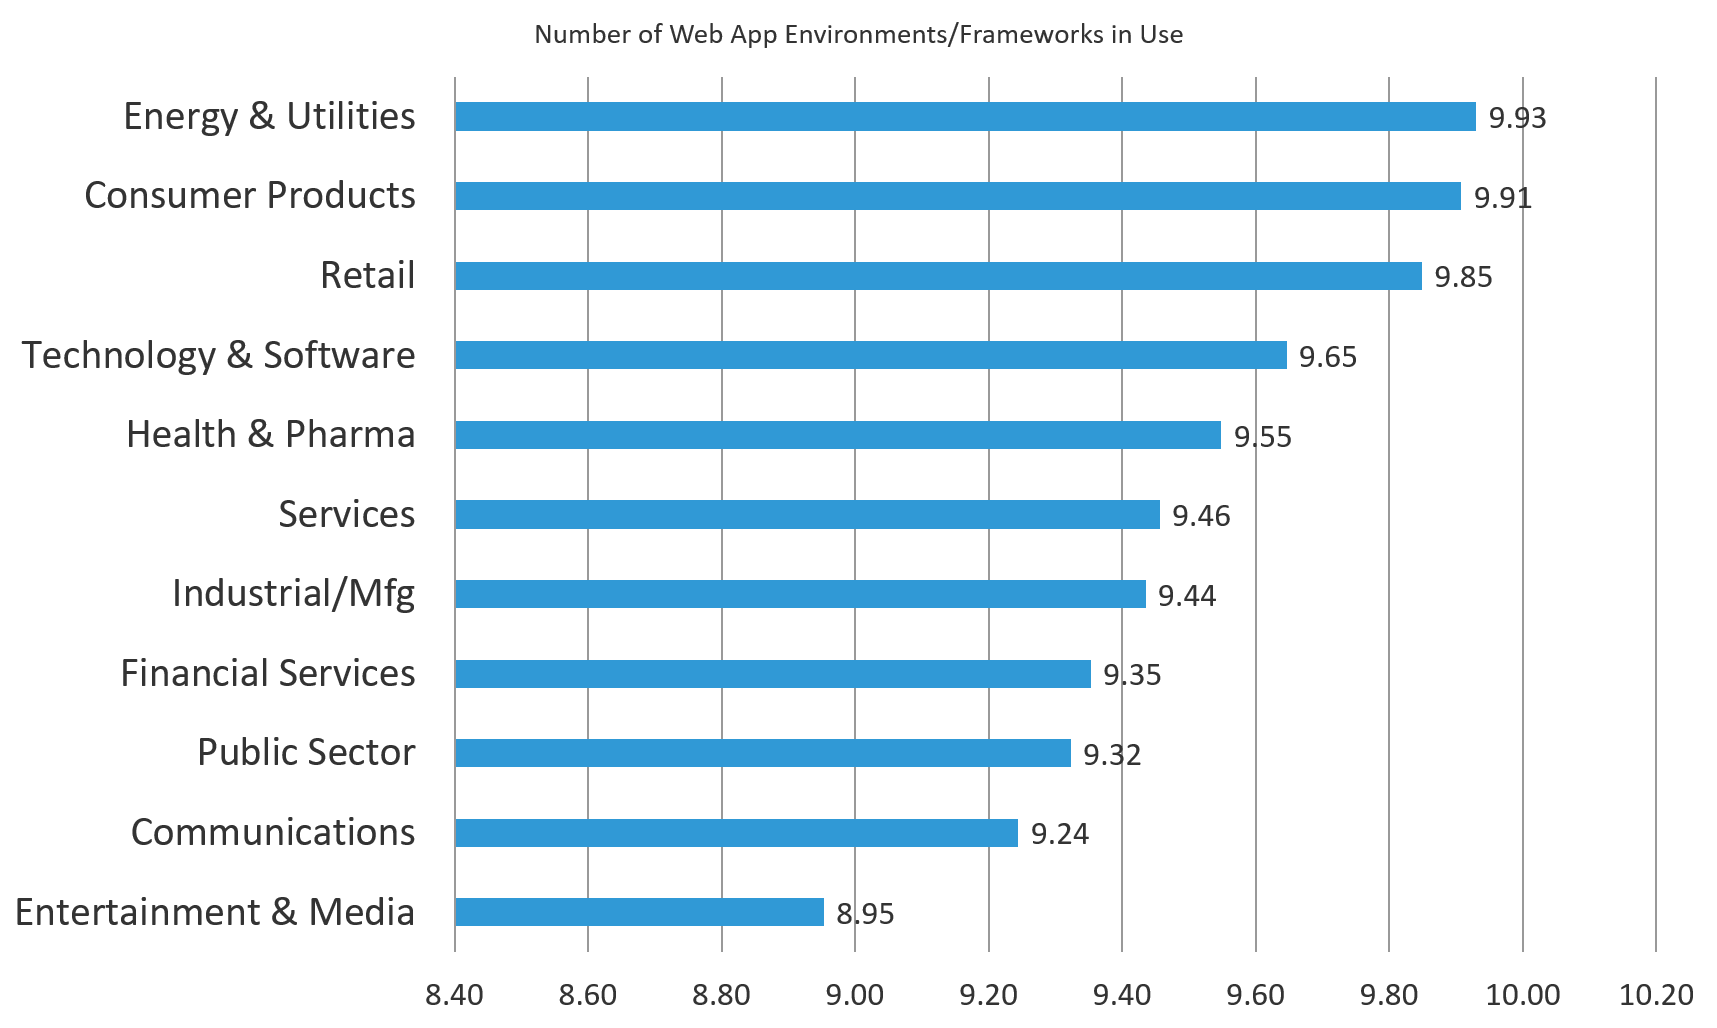
Figure 4: Nearly every industry uses nine or more web app environments or frameworks
Top three web applications that store the most critical data
Sometimes the most mission-critical applications don’t store the most important data. For example, Backup and Storage make an appearance in the list of top apps holding critical data, but it wasn’t identified as a mission-critical application itself. However, like before, the same top three apps were chosen for storing critical data, albeit in differing priority.
| Which apps store your most critical data? | Most chosen as #1 | Most chosen as #2 | Most chosen as #3 |
| Document management & collaboration |
|
|
|
| Office suites |
|
|
|
| Backup and storage |
|
|
|
Table 2: The top three applications that store most organizations’ data — by industry
Apps that require near perfect availability
Some applications can never go down. You’d think these would match with the mission-critical applications and, for the most part, they do. How
ever, remote access is a high priority for many sectors. This likely reflects the increased importance and prevalence of a remote workforce, especially in Technology & Software and Communications. Interestingly, only the Services industry identified Backup and Storage as an app that must be always available.
| Apps requiring 100% availability | Most chosen as #1 | Most chosen as #2 | Most chosen as #3 |
| Communication apps (such as email, texting) |
|
|
|
| Remote access |
|
|
|
| Office suites |
|
| |
| Document management & collaboration |
|
| |
| Backup and storage |
|
Table 3: Types of apps requiring 100% availability — by industry
Impacts of Attacks
Now that we understand what applications are in use, we can look at what happens when those applications are attacked. We asked respondents what kinds of cyber-attacks would affect their organizations the most. One set of answers that was noteworthy is how different sectors ranked the estimated incident cost for each kind of attack.
It was not surprising that Financial Services reported the highest potential dollar impact for leakage of customers’ personally identifiable information (PII), leakage of internal confidential information, and denial-of-service attacks.
What did surprise us was how the Public Sector ranked the impact of attacks. What do we mean? Read on.
Cost of leakage of confidential or sensitive information
Our first question was about the cost of leakage of internal confidential information. The extrapolated average impact across all sectors was $9.08 million. Financial Services topped the list while Communications was at the bottom. Nothing too earthshattering in these results, but let’s keep going.
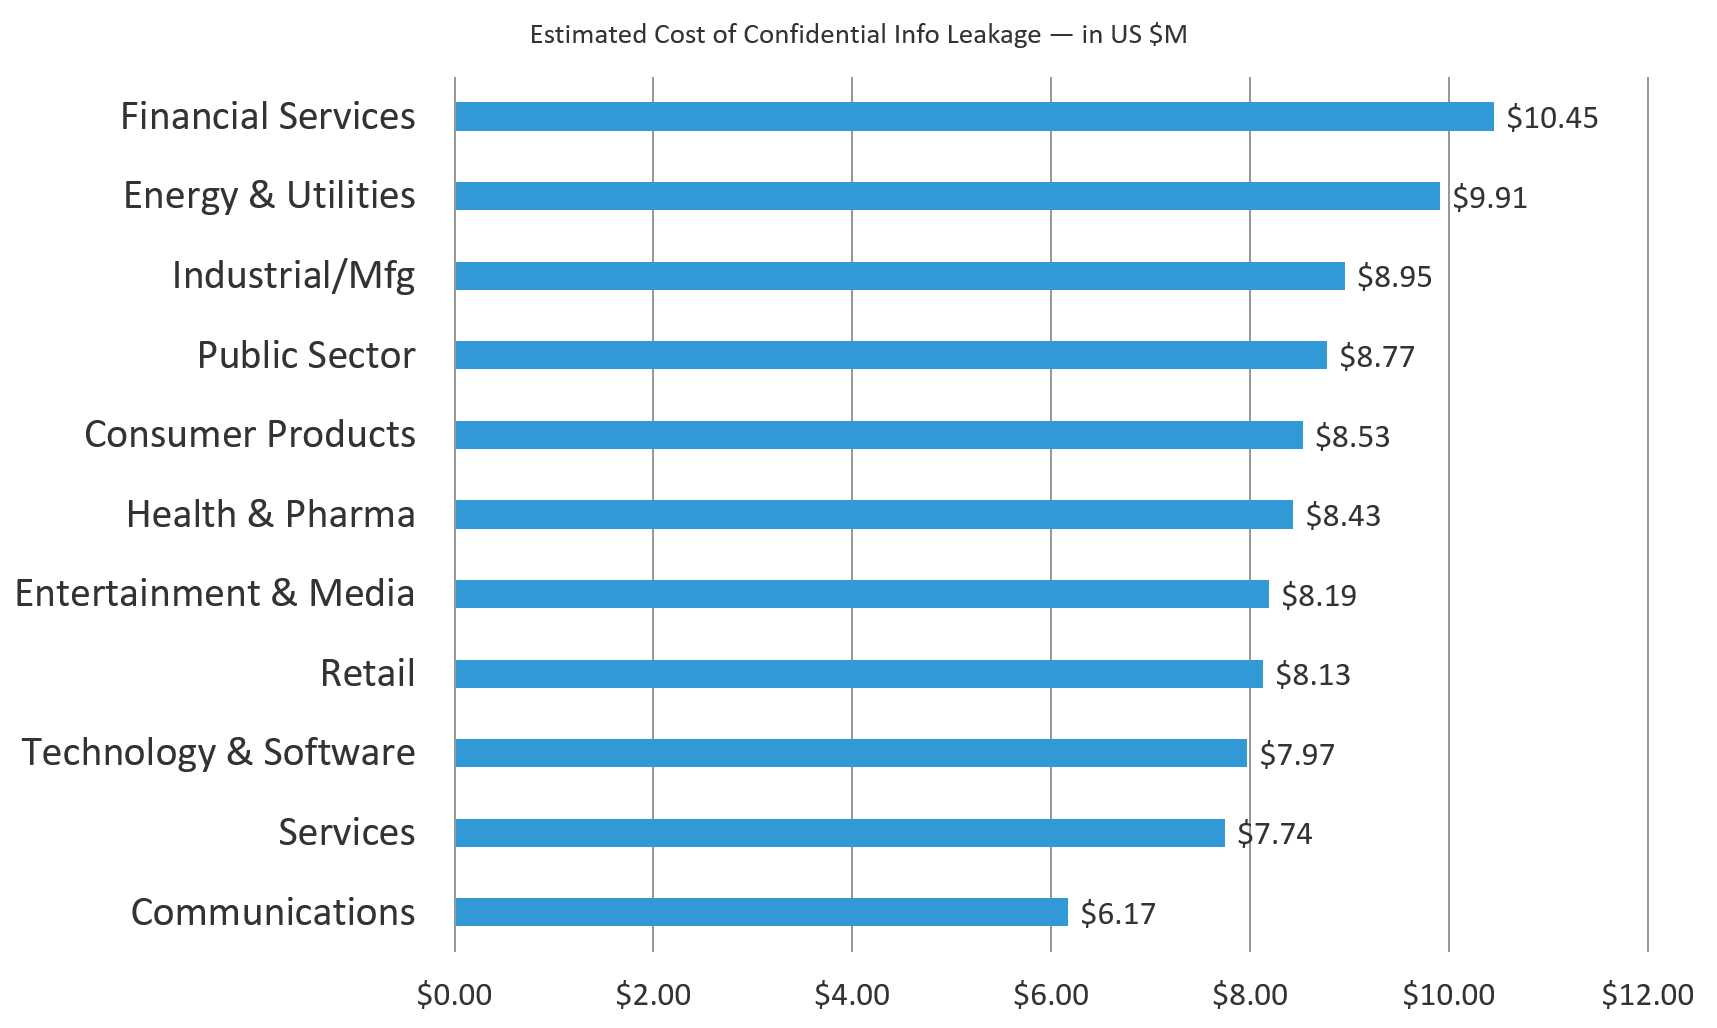
Figure 5: Financial Services estimated breach cost of confidential information is nearly 70% higher than the Communications sector
Cost of leakage of personally identifiable information (PII)
For leakage of PII, the extrapolated average estimated impact across all industries was $6.57 million. Indeed, the Financial Services sector estimate is not only the highest but is an outlier when compared to the rest—34% higher than the average. But the lowest, the Public Sector estimate, is also an outlier in the opposite direction—38% below average. In fact, this is the lowest damage estimate across all sectors. From the highest at $8.79 million to the lowest at $4.05 million, that’s quite a divergence in the impact of the breach of individuals’ personally identifiable information.
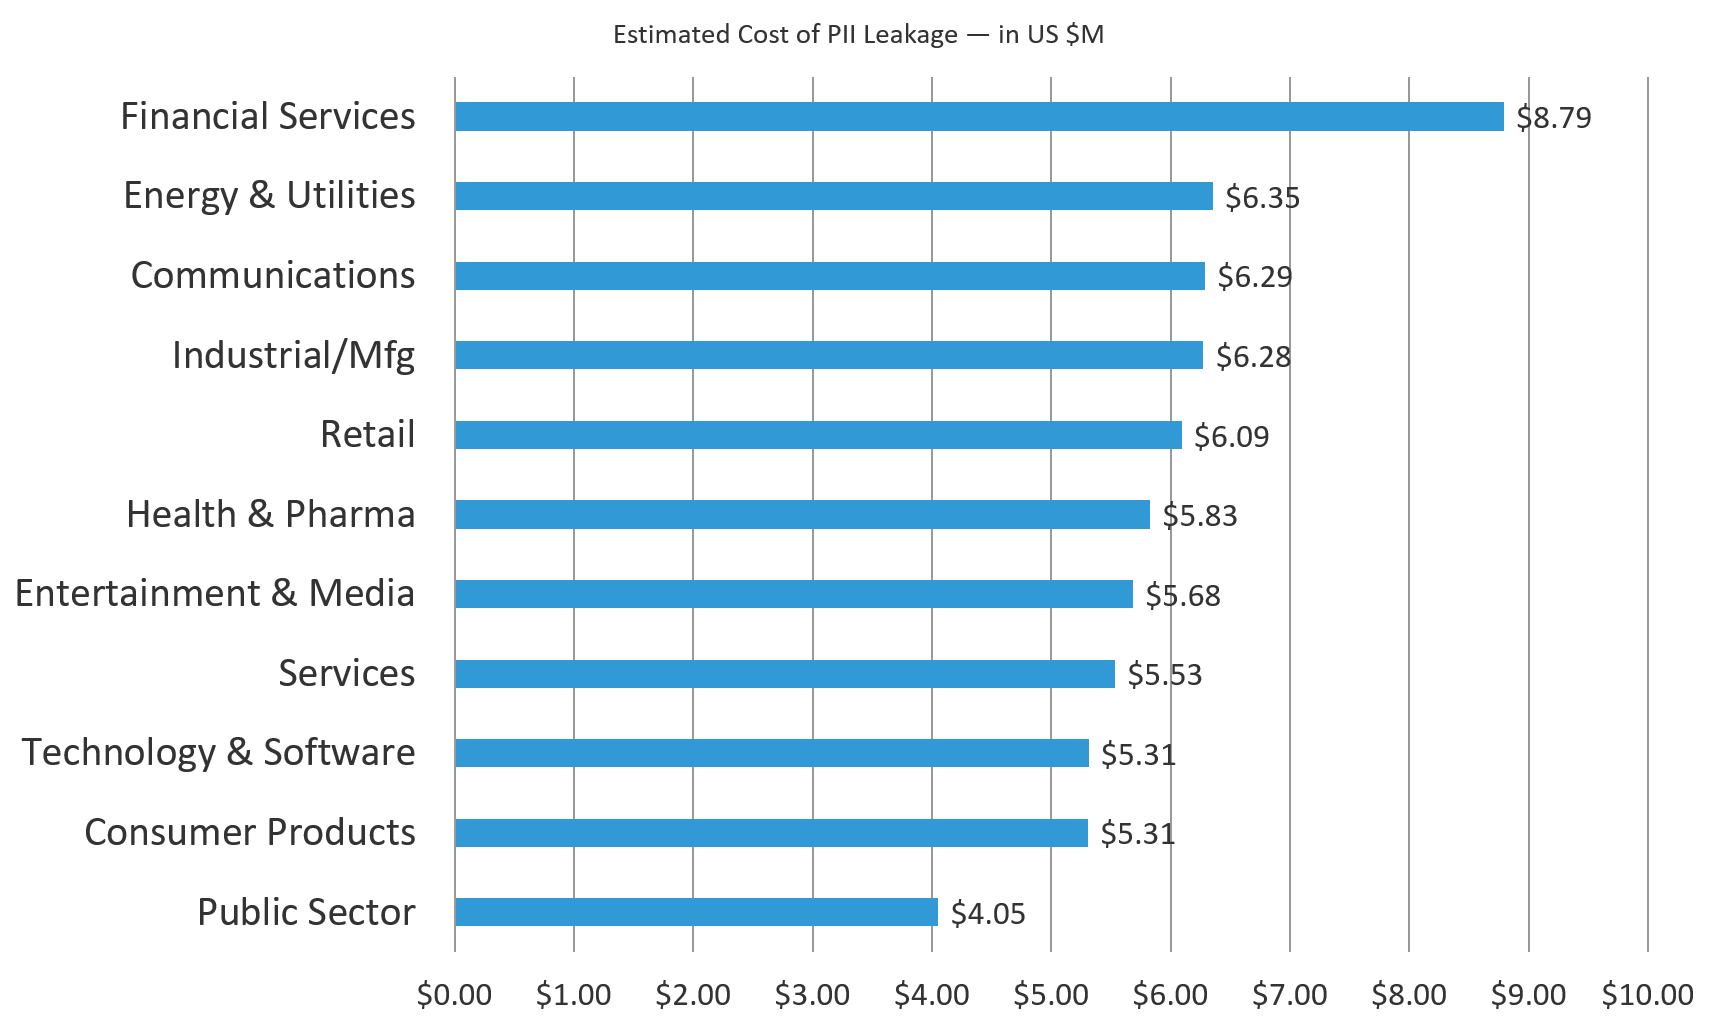
Figure 6: Financial Services estimated breach cost of leaked PII is more than double that of the Public Sector
What’s ironic about these numbers is that the public sector is not immune to huge breaches of personal data. In 2015, the United States Office of Personnel Management (OPM) was breached and lost the detailed background check records of 21.5 million people.3 Similar breaches in the private sector have resulted in lawsuits and regulatory fines in the millions but, to date, the public sector hasn’t suffered any civil penalties.4
Cost of lost availability to apps and data
This survey stat is all about the effects of denial-of-service attacks. The extrapolated average impact was $7.19 million. When applications can’t be accessed, once again we see the Financial Services sector taking it on the chin with estimated impacts higher than any other sector at $9.29 million (29% above average). But also, once again, the Public Sector estimates are at bottom at $5.07 million (29% below average). So, when Financial Services companies experience DOS attacks, they lose lots of money. Public sector organizations lose about half as much. If any bad guys are reading this report, protip: DoS the banks and not the government. You’ll get bigger ransoms.
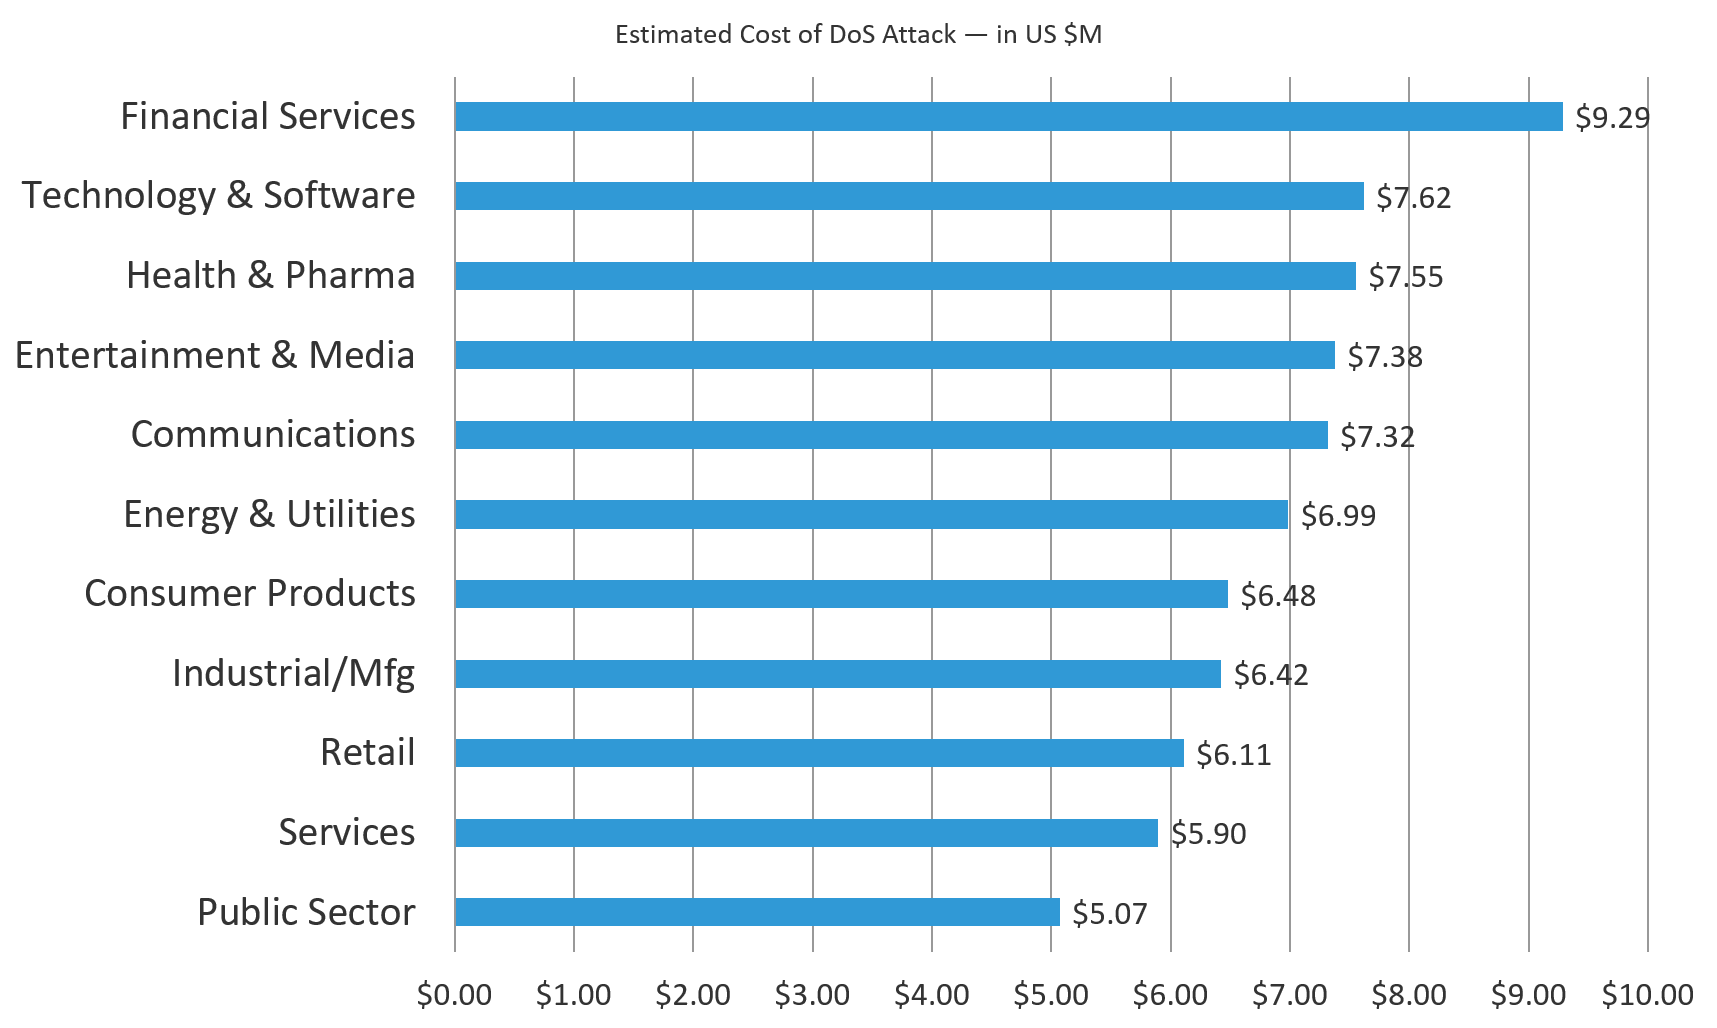
Figure 7: Financial Services estimated cost of a DDoS attack is 83% higher than that of the Public Sector
Cost of tampering with or modifying applications
Just when you think you’ve got this figured out, here comes a twist. The extrapolated average impact was $8.54 million for tampering and unauthorized modification to applications. But, in this case, the Public Sector leads in estimated impacts at $9.64 million (13% above average). At the bottom is Energy and Utilities at $6.7 million (7% below average).
Why does the public sector care so much about tampering with their applications? Well, most public sectors directly serve their population. The OPM notwithstanding, a majority of the public sector’s information and services are meant to be consumed by the general public. If you don’t think those applications shouldn’t be tampered with, here are three words to change your mind: online voter registration.5
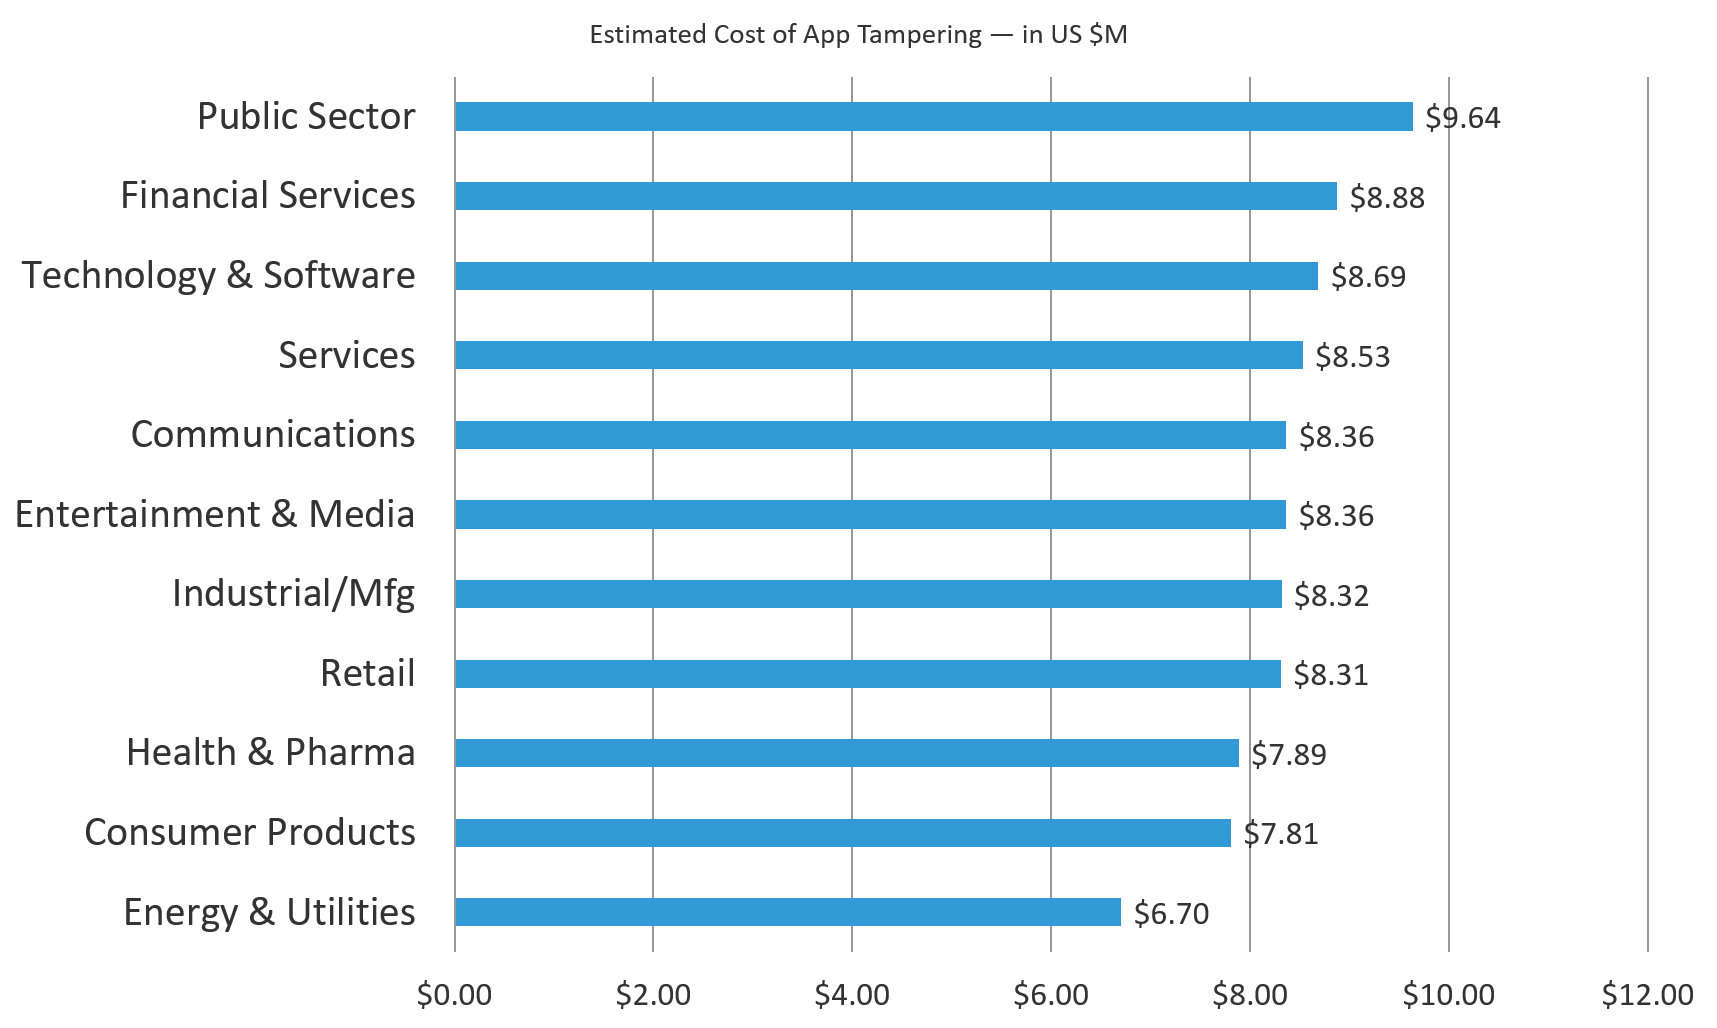
Figure 8: Public Sector estimated cost of app tampering is 44% higher than that of Energy & Utilities
Types of attacks that would be the most devastating to your organization
We also asked what specific types of application attacks would be the most damaging to organizations. Like many of these questions, the top three responses remained the same across the board, but with different industries placing different priorities on those attacks.
| Most devastating attack | Most chosen as #1 | Most chosen as #2 | Most chosen as #3 |
| DDoS |
|
| |
| Man-in-the-Middle/Browser and Credential theft |
|
| |
| Web fraud |
|
Table 4: Most devastating attack types — by industry
Application Defense
We’ve covered application usage and impacts of attacks, let’s look at how different sectors structure their defenses.
Who owns your organization’s application security risk management process
When it comes to app defense, one of the most important questions we asked is who is ultimately responsible for taking ownership of application risk. In my own Application Security Utopia, there would be a single role across the board that makes all the key decisions about application risk: what apps to put online, how securely they’re designed, how to measure the risk, deciding when to take apps offline for patching, and determining how much should be spent defending each one.
The survey responses we got reflect the ground truth we see: different departments are responsible for different aspects of app security, and that becomes their center of gravity. Here, we have the top three answers for each sector and, once again, they all seem to hit four possible answers: CIO/CTO, Head of App Development, Business Units, and “No one person or department.” In many ways, CIO/CTO and “No one person or department” are the same answer since when things go pear-shaped, the blame will rise up to the highest position in IT: the CIO/CTO. It’s interesting and somewhat surprising to note that the CISO is not on this list—it fell in at fifth place across the board.
| App Risk Owner | Most chosen as #1 | Most chosen as #2 | Most chosen as #3 |
| CIO or CTO |
|
| |
| Head of application development |
|
|
|
| Business units (LOB) |
|
| |
| No one person or department |
|
|
Table 5: Who owns responsibility for protecting applications — by industry
Organizations’ primary means of securing applications
We also asked survey participants about the specific security technology they use to defend applications. The top three answers were universally the same across industries with some variation in priority. Seems that everyone’s go-to tool is a web application firewall. Beyond that, there’s a slight difference in prioritization between penetration testing and application scanning although percentage-wise, there was only a 1% difference in choice between these two.
| How organizations secure apps | Most chosen as #1 | Most chosen as #2 | Most chosen as #3 |
| Web application firewall (WAF) | All Sectors | ||
| Penetration testing |
|
| |
| Application scanning |
|
|
Table 6: Top three defensive mechanisms — by industry
Conclusion
Overall, although the various industry sectors differed in their application usage, dependence, and estimated cost of an attack or breach, their defensive stances were about the same. In addition, all sectors seem to suffer from the same problem of application risk ownership, something we need to improve upon industry-wide as long as we remain dependent on our applications. And application dependence seems to be growing, not shrinking. Hopefully this gives you some insights and ideas on how to improve your defenses in your sector. If you’ve got questions or theories on the origins of these numbers, drop us a line. We’d love to hear.


