Introduction
Welcome to F5 Labs’ Application Protection Report for 2022. As in years past, the goal of this report is to document the evolution of the threat landscape over the previous year so that security practitioners can tune their defenses to suit. More specifically, this report is intended to clarify the relationship between target characteristics and attacker behavior so that each organization can focus on the threats most applicable to them.
Every organization should expect frequent attacks of some sort, but neither organizations nor attackers are uniform groups. Organizations run different applications on different networks, store different types of data, and have different customers, controls, regulatory regimes, and risk appetites. Application architectures are increasingly distributed and decentralized for performance and resilience, which in turn introduces multiple intersecting responsibilities with respect to protecting data.
For their part, attackers vary by motivation, sophistication, level of resources, and depth and breadth of specialization. Not all combinations of attacker and target characteristics manifest with equal frequency. An improved understanding of which combinations are common and which are rare can help organizations select and implement controls to suit their needs.
Executive Summary
- Malware incidence in data breaches continued to increase, constituting nearly a third of known U.S. breach causes in 2021.
- While ransomware events continued to grow in frequency, nonencrypting malware grew even more rapidly. Both malware strategies made heavy use of exfiltration methods to remove data from victims’ environments.
- Web exploits for cybercrime declined in prevalence, dropping from 19% of known breach causes in 2019 to 10% in 2021.
- Formjacking attacks, such as Magecart, constituted the bulk of web exploits that led to breach disclosures and were heavily focused on the retail industry.
- Access attacks, that is, attacks against user-facing authentication surfaces, were the single most frequent cause of breaches.
- High rates of business email compromise (24% of all breaches), combined with low reporting rates for credential stuffing and phishing attacks, suggest that these attacks are difficult to detect and/or are underreported—not that credential stuffing or phishing are low-grade threats.
- Cloud breaches occur most frequently through misconfigurations, although the risk of third-party breaches emerging for cloud customers is significant, and traditional attack vectors such as web exploits or credential stuffing still apply in the cloud.
A Brief Note on Sources
This report aggregates findings from several disparate, complementary sources to gain a wide view of the threat landscape. The following section, “2021 Data Breach Analysis,” contains findings from examining nearly a thousand data breach notifications to assess the tactics cybercriminals use most in successful attacks. Following that is an analysis of cloud security trends using several different sources. Finally, the “Recommended Mitigations” section contains guidance for deterring the attack vectors documented in the report. For more information on methodology and sources, see “Appendix A: Breach Analysis Methodology and Data Models.”
2021 Data Breach Analysis
As in years past, this report uses public data breach disclosures that organizations send to U.S. state attorneys general to analyze the characteristics of successful attacks. The analysis included three data models that revealed different findings, which can be summed up as follows:
- Use of malware in attacks continued to grow in 2021.
- In addition to the growth of ransomware, nonencrypting malware use grew significantly.
- Incidence of exfiltration techniques increased significantly, both in conjunction with malware and on their own.
- Web exploits for cybercrime declined in prevalence.
- Formjacking attacks, such as Magecart, constituted the predominant web exploit that led to breach disclosures.
- Retail organizations and associations with membership payment surfaces online were by far the most likely to experience formjacking attacks.
- The manufacturing sector saw significant growth in ransomware attacks.
- Access attacks were prominent against the Finance and Insurance; Professional, Scientific, and Technical Services; and Health Care and Social Assistance sectors.
- Malware attacks were prominent against the Wholesale Trade; Manufacturing; Professional, Scientific, and Technical Services; and Finance and Insurance sectors.
Breach Characteristics (Flat Tag Model)
Most of the key breach characteristics actually declined proportionally compared with 2020 (see Figure 1). The incidence of web exploits in breaches dropped by nearly a third. Business email compromise and ransomware, the two most common breach characteristics in both years, saw a small dip. Third-party breaches decreased by nearly a third, although the bulk of third-party breach notifications in both 2020 and 2021 were driven by the same event, the Blackbaud cloud ransomware attack that was detailed in the 2021 Application Protection Report. The same goes for cloud events. Most of the cloud events in both years were the same Blackbaud breach cascading through hundreds of customers, although the “Publicly Disclosed U.S. Cloud Breaches” section details some other interesting cloud events.
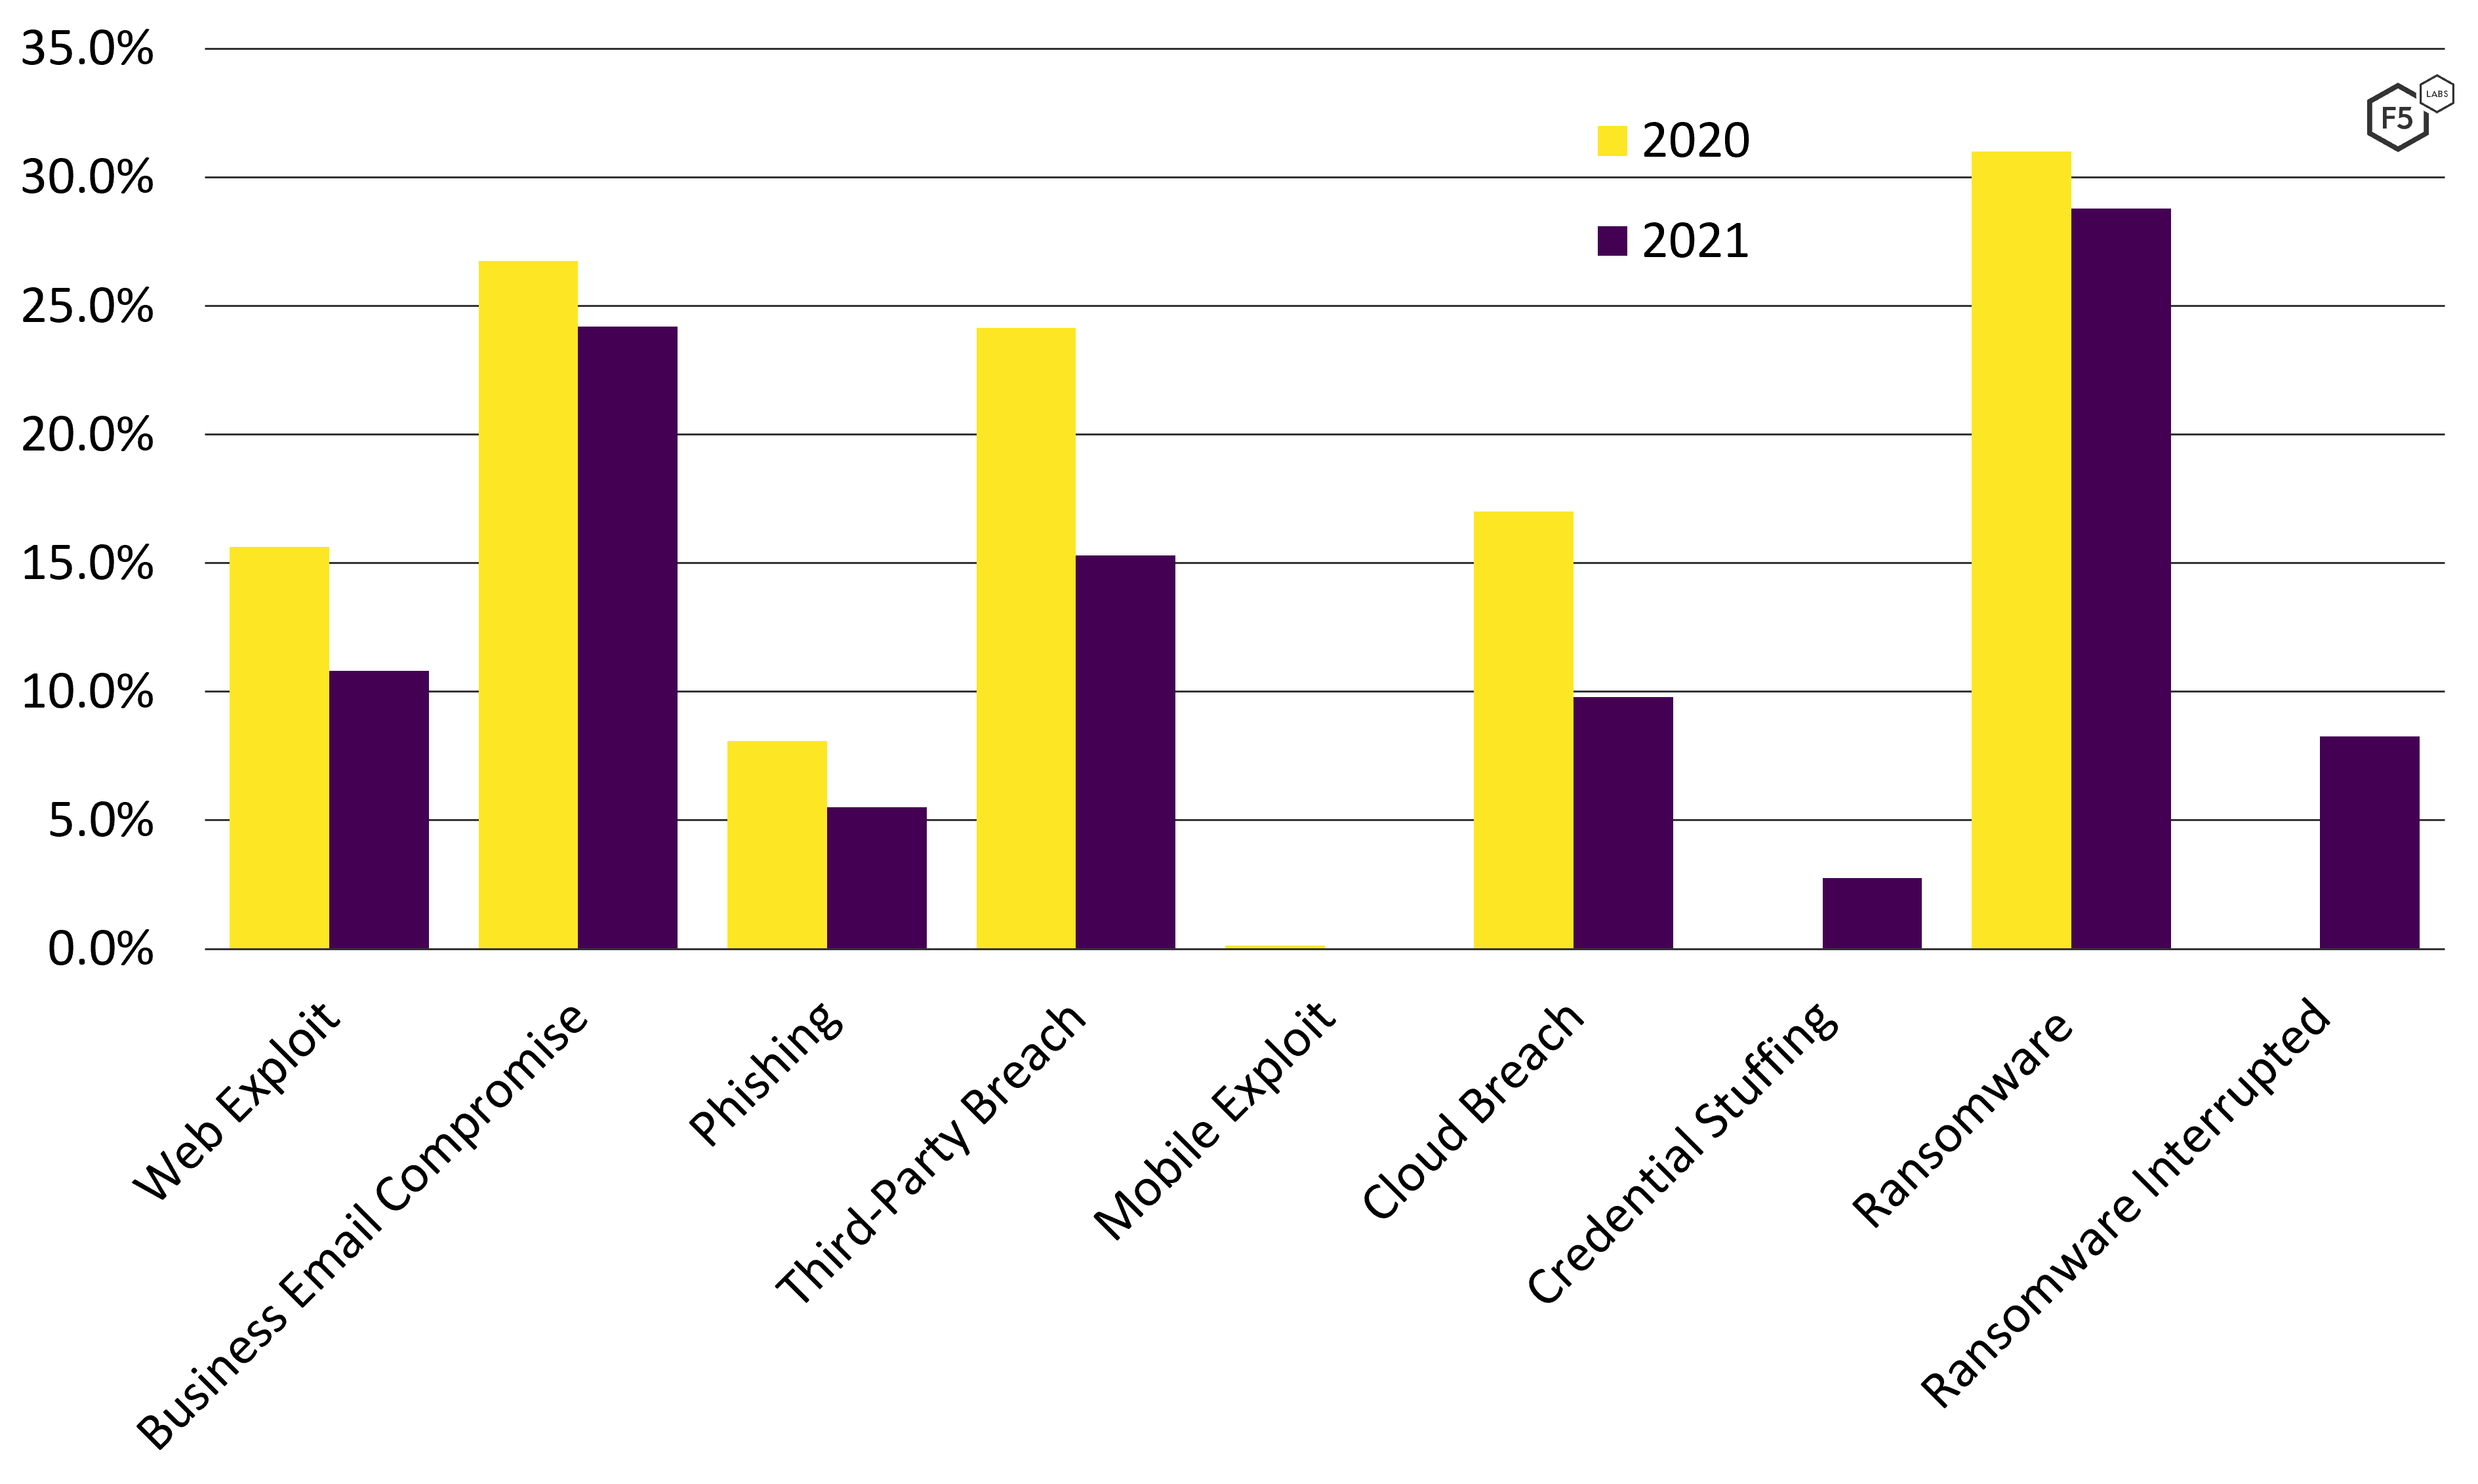
Figure 1. Data breach characteristics for 980 U.S. breaches. Every breach characteristic tracked in 2020 decreased in 2021.
The explosion of ransomware over the course of the COVID-19 pandemic has been well documented, and F5 Labs hypothesized in early 2021 that monetization strategies were shifting. While ransomware remained a common tactic in data breaches in 2021, it dipped slightly compared with 2020. This is partly due to trends within malware tactics, which will be covered in the “Malware Growth” section. However, this apparent trend downward in ransomware also provides a clue as to why numbers dipped across the board.
In many breach disclosures in 2021, the organization disclosed the presence of malware in the system and that data had been exfiltrated, but did not specify a ransom demand or an encryption event. This means that many malware incidents were suspected as ransomware, but not confirmed. The lower level of detail persisted across the different categories and into the other data models as well. In the 2021 Application Protection Report, 125 out of 728 breaches (17.2%) had no breach characteristics associated with them for lack of any meaningful details in the disclosures. For this report, 262 out of 980 breaches (26.7%) had no noted characteristics. In other words, the dips in these characteristics are at least partly due to organizations disclosing fewer details about the breaches. Because of this, the larger declines, such as in web exploits, are probably more reliable indicators than the smaller dips in ransomware and business email compromise.
Data Breach Causes
The following breach cause analysis uses F5 Labs’ internal Application Tiers data model. For a refresher on the categories, see “Appendix A: Breach Analysis Methodology and Data Models.” For a detailed explanation of the Application Tiers model and the thinking behind it, see the 2018 Application Protection Report.
Figure 2 shows the proportional distribution of breach causes in 2021. The first thing that stands out is the large number of events with an unknown breach cause. From 2018 through 2020, the proportion of breaches with an unknown cause ranged from 13-17%. In 2021, 22.6% of breaches had unknown causes, which fits with the observation in the “Breach Characteristics” section about the misleading cause for those values declining in 2021.
Access breaches (i.e., phishing, brute force, credential stuffing, and the like) remained the most common cause of breaches at 25.2%. Malware of all types followed close behind at 23.3%. Third-party data losses constituted just under 13%, and web exploits, surprisingly, constituted only 8.1% of the breach share in 2021. Figure 3 shows the historical change in breach cause distributions, 2018-2021.
In historical comparison, three trends are immediately apparent.
Trend 1: Web Exploits Showed a Decreasing Breach Share
While the proportion of breaches attributable to web exploits dropped, formjacking remained the most prominent web exploit by far. From 2018 through 2019, web exploits made up 17-19% of breaches. Eighty-seven percent of those web attacks were formjacking, of which Magecart and its variants were the most common example. In 2020, web breaches dropped to 14.4% of breach share, and while formjacking attacks remained common, other exploit campaigns also made up a significant proportion of web attacks.
In 2021, web exploits in the disclosures made up 10.4% of known breach causes, and these exploits primarily took two forms: formjacking attacks to skim payment cards, and the exploitation of any of four separate vulnerabilities to compromise the Accellion FTA appliance (which began in late 2020 and continued into February 2021).1 The breach of Accellion customers through the FTA appliance was widespread, and a larger number of those disclosures are expected to arrive over the course of 2022.
On the surface, this finding about formjacking contradicts more detailed findings about Magecart from other researchers, who noted a number of phenomena indicating the growing popularity of formjacking.2 The growing demand for stolen card-not-present records, the proliferation of unique attacker domains in 2021, and a 20-fold increase in the number of unique malicious scripts indicate that Magecart-style attacks are still popular.
However, another report from the same researchers noted a number of new defense-evasion techniques, such as the use of trojanized Google Tag Manager containers, made detecting Magecart infections more difficult.3 Furthermore, the proliferation of unique scripts lowers the likelihood that signatures are going to detect novel attacks.
With this research in mind, it appears more likely that the diminished incidence of web exploits in this data indicates both the predominance of formjacking attacks over other web attacks as well as the difficulty of detecting and reporting such attacks. These findings should not, therefore, be taken as a sign that formjacking is less of a threat—in all likelihood it is the most significant web exploit–based attack facing organizations at the moment, barring another industrywide vulnerability in the vein of Log4Shell.
Trend 2: Access Breaches Appeared to Drop
The second trend apparent in Figure 3 is the drop in access breaches in 2019 and 2020, with the percentage staying largely consistent into 2021. Unfortunately, these are often breaches that have very little detail other than the fact that employee emails were compromised, illustrating the enduring appeal of access attacks as a first step in many other attack chains.
Trend 3: Malware Showed Substantial Growth
The one category that grew significantly was malware. With unknown breach causes scoped out of Figure 3, malware made up 30.1% of 2021 breaches, up from 17.4% in 2020 and 6.6% in 2019. As noted earlier, in 2021 a smaller proportion of these malware events were identifiable as ransomware events. Of these nonransomware malware attacks, some clearly did not pursue a ransomware tactic, some were suspected but undisclosed ransomware attacks, and some were unsuccessful and undisclosed. The relationship between malware in general and ransomware will be explored in the “Attack Chain Analysis” and “Recommended Mitigations” sections. For now, suffice to say that in 2021, malware grew at the expense of all other breach causes.
A quick note on the nonapplication attack vectors: this model tracks accidents, malicious physical breaches, insiders, and third-party breaches because CISOs and other security stakeholders need to understand how losses from malicious activity compare with nonmalicious breaches. Leaving aside the skew in third-party breaches in 2021 due to the Blackbaud breach of 2020, all of these nonapplication attacks trended downward or have held mostly steady at low numbers, such as 2.5% for insiders and 1.6% for physical breaches.
Industrial Analysis
Figure 4 shows the distribution of breaches across the 20 top-level industrial sectors in the U.S. Census Bureau’s North American Industry Classification System (NAICS). Finance and Insurance; Health Care and Social Assistance; and Professional, Scientific, and Technical Services led the top three, with Educational Services next. Note that law firms and certified public accountants, both of which see a large number of attacks, fall into the Professional, Scientific, and Technical Services sector, and a large number of nonprofit social advocacy or social support organizations share the Health Care and Social Assistance sector with hospitals, doctors’ offices, and optometrists.
Figure 5 shows data breach causes broken down proportionally by sector. However, both the 2021 Application Protection Report and a sector-focused follow-up found that sectors are not a reliable predictor of attack vector, except when they correlate with the types of data or software versions that organizations run. In other words, financial organizations experience attacks that specialize in exfiltrating financial information because financial information is what financial organizations house. It sounds obvious, but attackers have used Magecart attacks to skim credit cards from stores in niche subsectors, such as university bookstores, even though nobody would think of a university as a retail enterprise. Therefore, consume this intelligence with an eye toward your own relationship between the data you work with, the software you use, and the threats you’re likely to encounter. If your local conditions differ from these observations, you should prioritize local conditions.
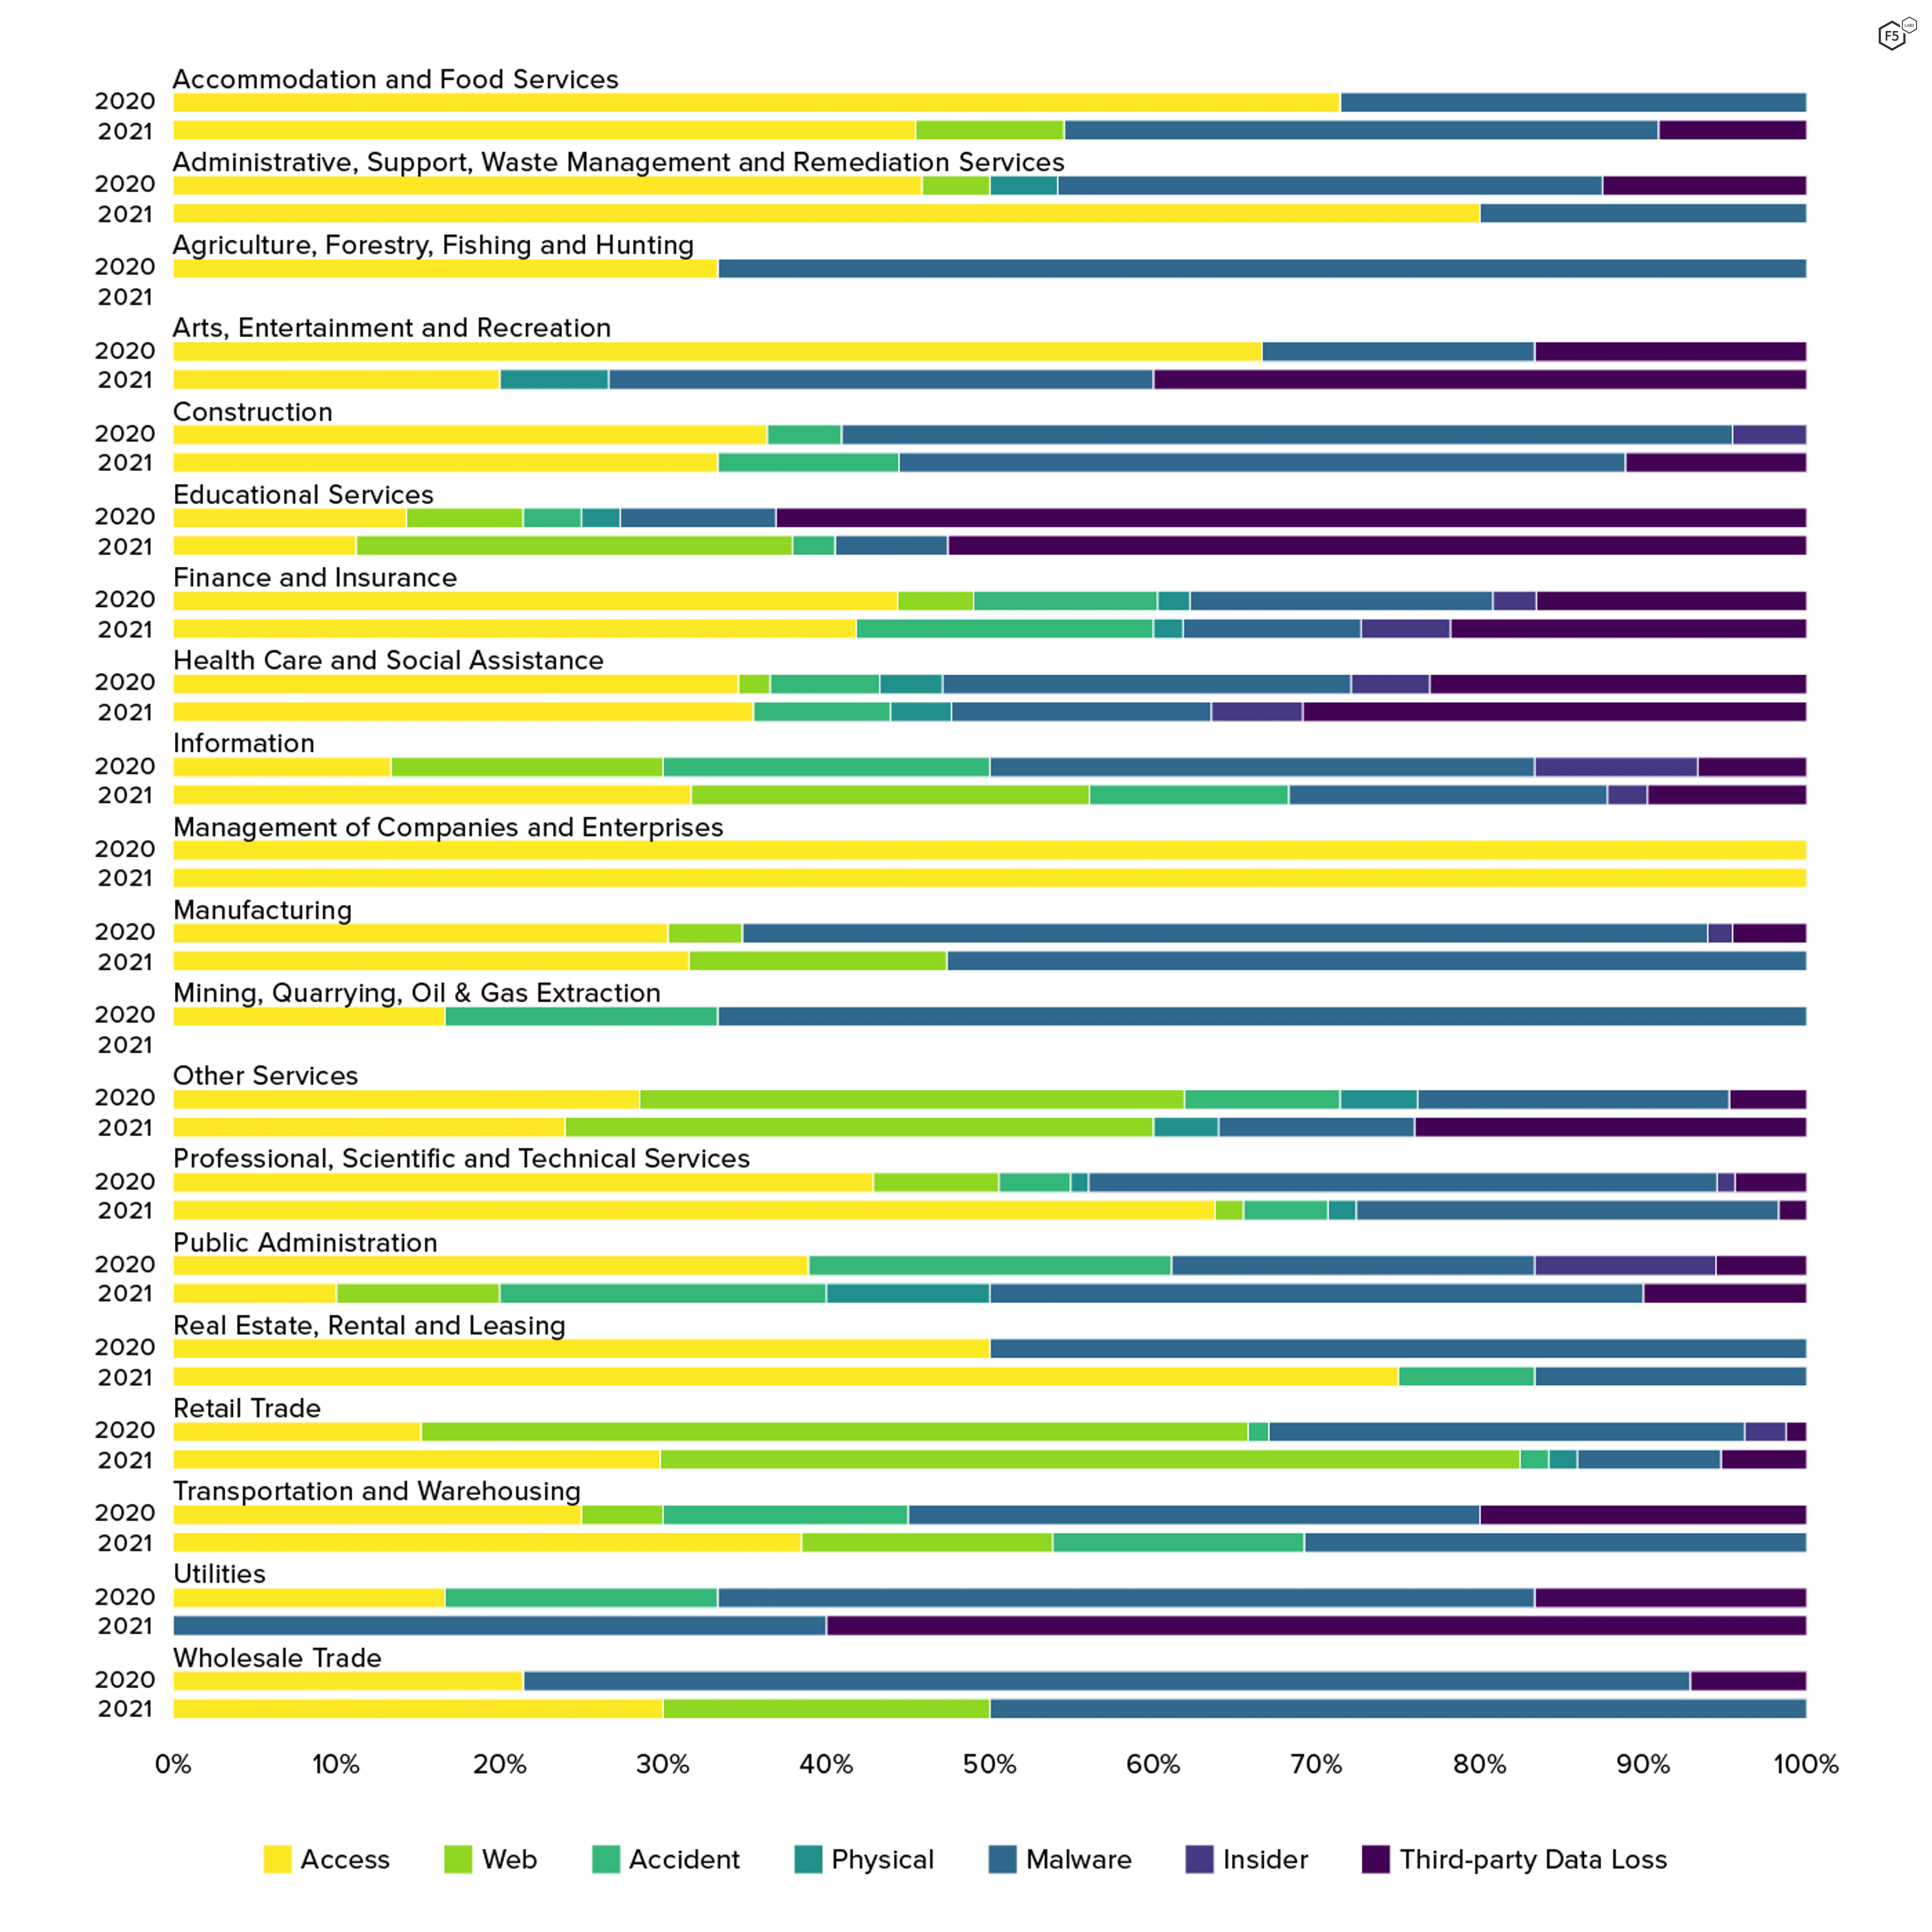
Figure 5. Data breach causes by sector, 2020-2021. Retail organizations saw greater incidences of web exploits and fewer malware attacks than other sectors. For most other sectors, access attacks and malware represented the most common breach causes.
The two sectors most likely to experience web exploits like formjacking were, unsurprisingly, Retail Trade, which is the type of target for which this kind of attack was developed, and Other Services, which is a catchall category in the NAICS system that includes professional associations and trade unions. In both 2020 and 2021, several of these organizations had their membership renewal payment pages formjacked, illustrating F5 Labs’ 2019 observation that if you act like retail, you’ll be attacked like retail.
For all other sectors, either access breaches or malware attacks constituted the predominant attack mode, or in some cases like the Information sector, breach causes were equally distributed. Leaving aside those sectors whose events made up less than 2% of the total breaches,4 the industry that saw the greatest proportional incidence of access attacks was Administrative, Support, Waste Management, and Remediation Services, followed by Finance and Insurance, and Professional, Scientific, and Technical Services. Those sectors most likely to see a malware attack rather than an access attack were Wholesale Trade, Manufacturing, and Construction.
Of course, the different number of incidents per sector can make these percentages a little misleading. These numbers represent the probability that an attack against a given sector would be a certain type—it does not mean that a given attack type is most likely to occur in that sector. In terms of raw counts, Finance and Insurance was most likely to see an access attack and the Manufacturing and Professional, Scientific and Technical Services sectors were most likely to see malware.
Figure 6 shows the count of each attack cause by sector, rather than proportional incidence, to help understand how the n of each sector relates to different breach causes. This illustrates how Finance and Insurance can be ranked 12th in proportional incidence of malware but ranked third in terms of the actual number of incidents. Both of these views are useful, depending on the approach. The proportional view is useful for readers who want a breakdown of attacks given a sector. The raw counts reveal which sectors any given attack are most likely to target.
Attack Chain Analysis
Beginning with the 2021 Application Protection Report, F5 Labs began using a modified version of the MITRE ATT&CK framework to model attack chains, avoiding the pitfall of reducing a data breach to a single cause.
Figure 7 shows the attack flow diagram for all 2020 events, and Figure 8 shows the corresponding diagram for 2021. While the 2021 diagram looks superficially similar to the 2020 one, some critical differences show how attackers have changed tacks.
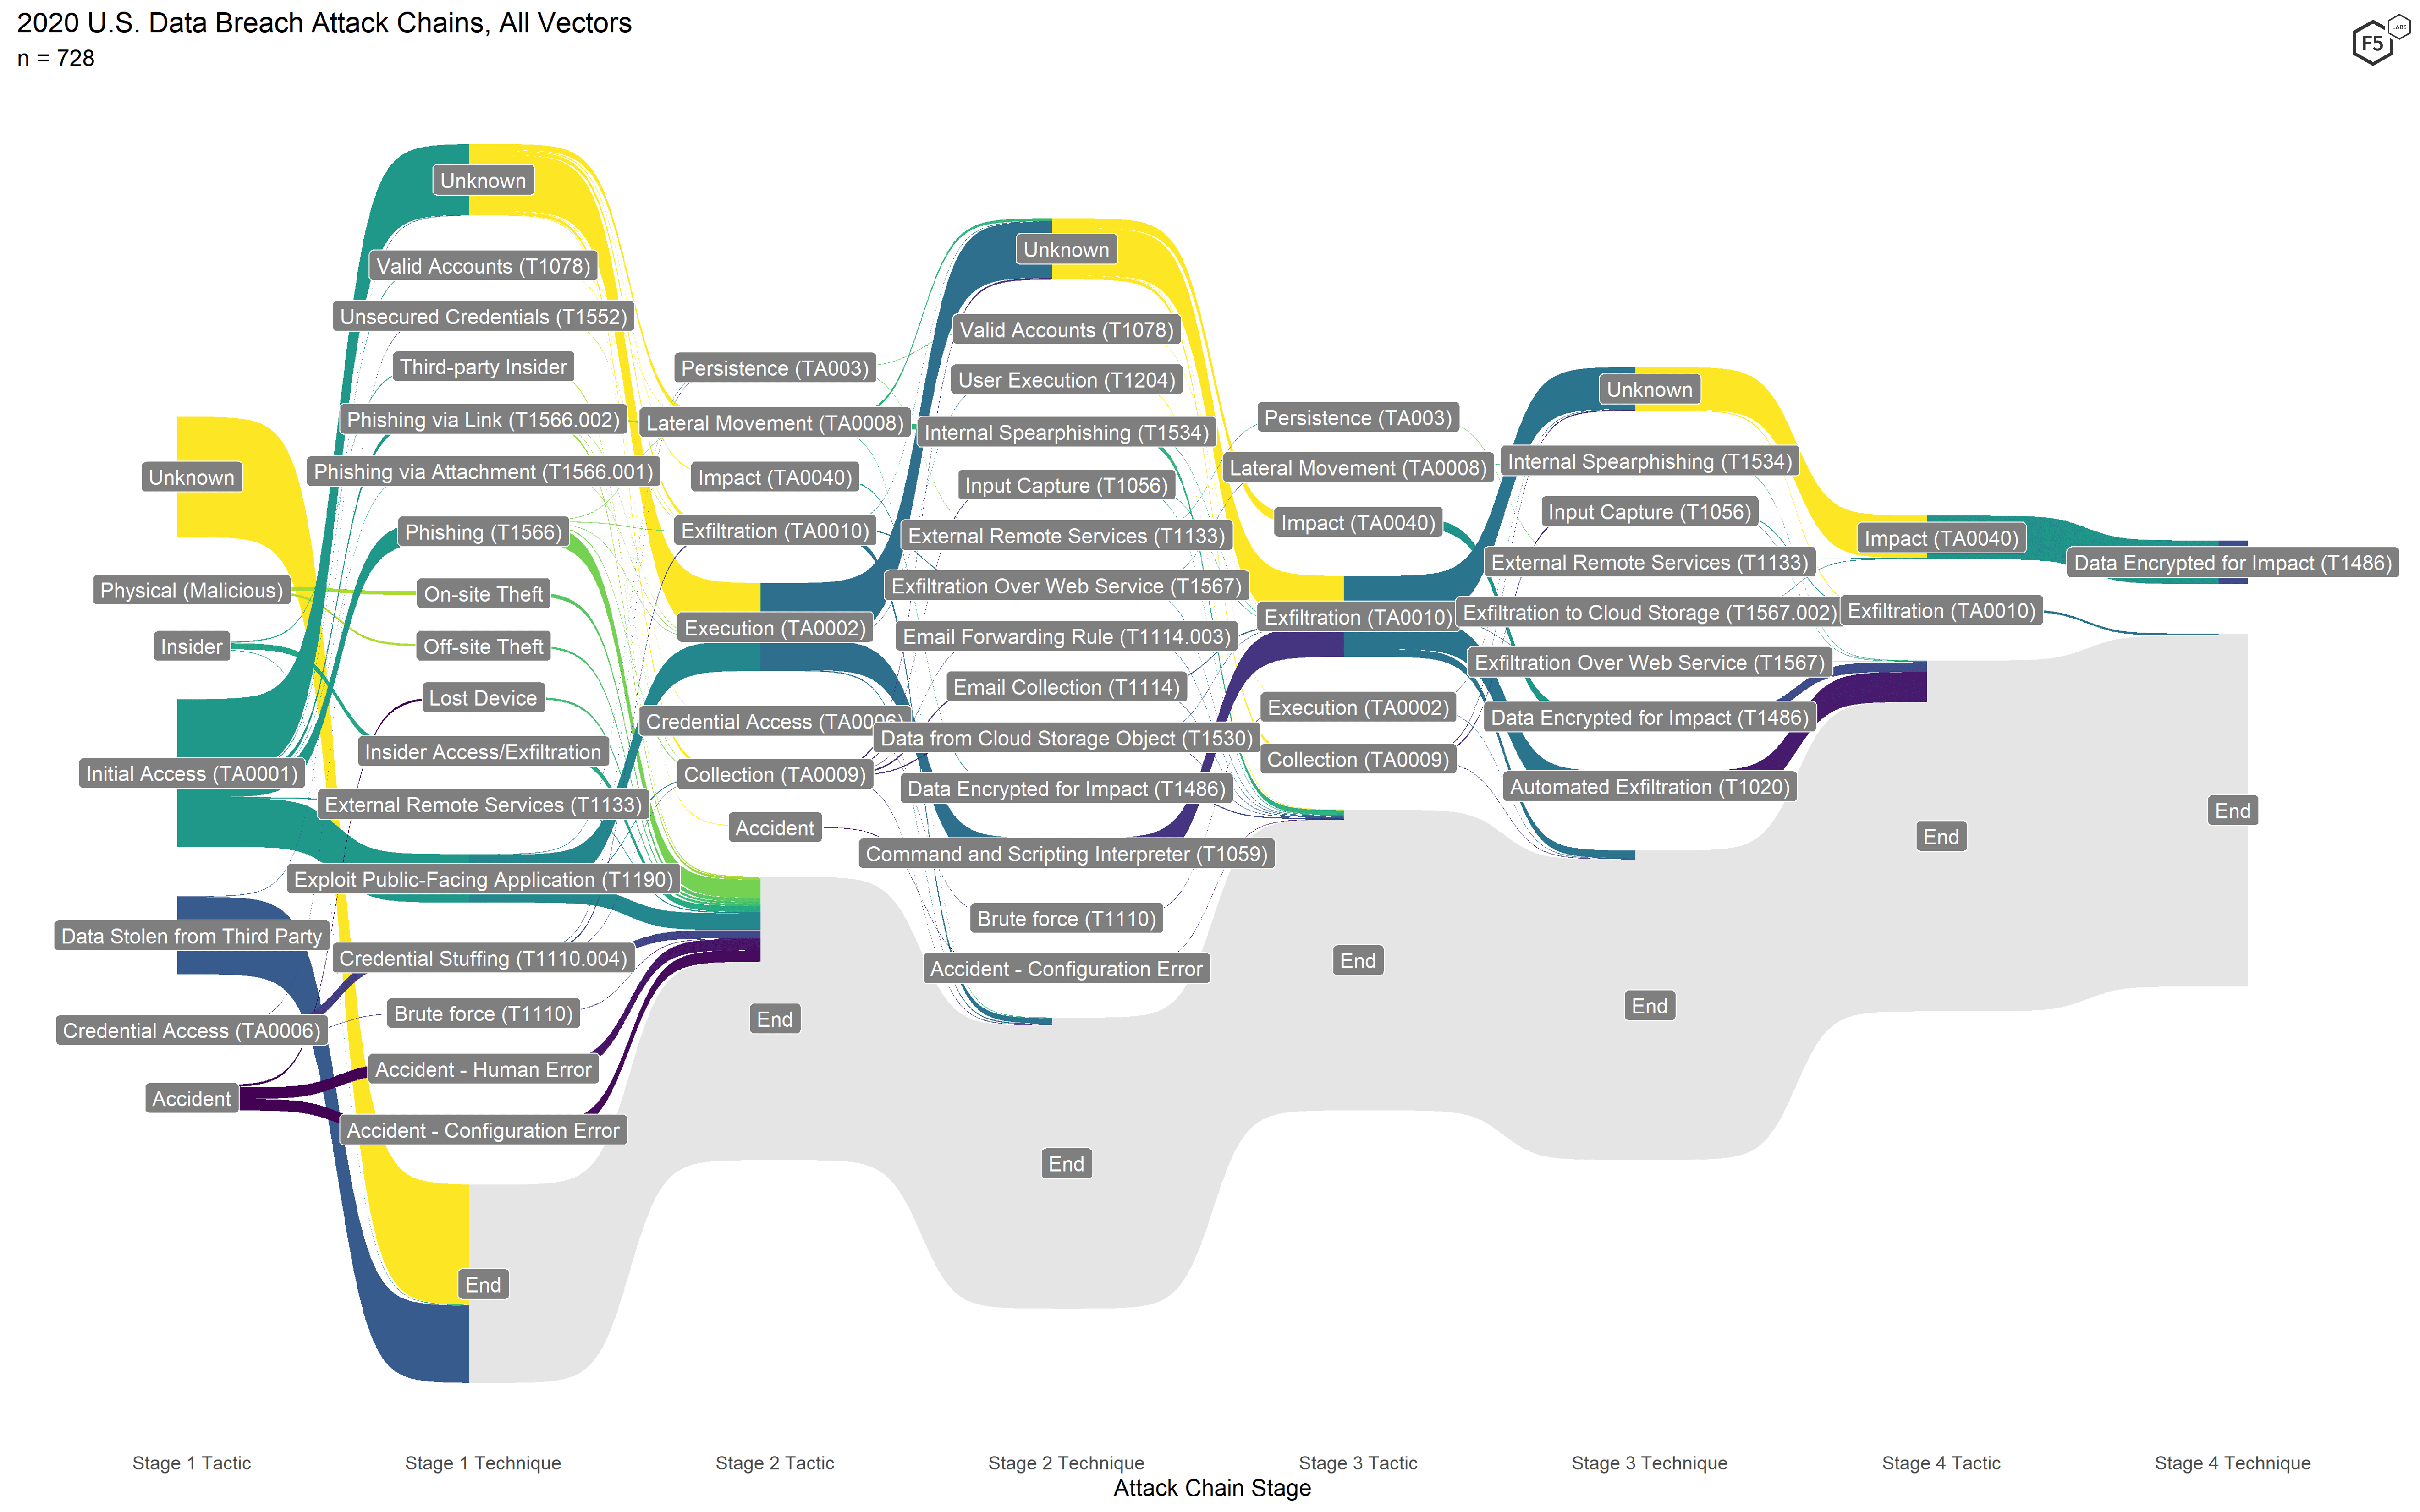
Figure 7. Attack chains for all 2020 events. The two highest-frequency attack chains visible are formjacking in the center and ransomware at the top.
The attack chains from 2020 featured some variation, but most of the attack chains fell into one of two types: ransomware attack chains (running across the top) and formjacking attacks (running through the center). The ransomware attacks are easily identifiable by the Stage 4 tactic Impact and the corresponding Stage 4 technique Data Encrypted for Impact. The formjacking attacks were the only web exploit–based campaign (easily recognized by the Stage 1 technique Exploit Public-Facing Application) that had enough information to interpolate the exfiltration method Automated Exfiltration (Stage 3).
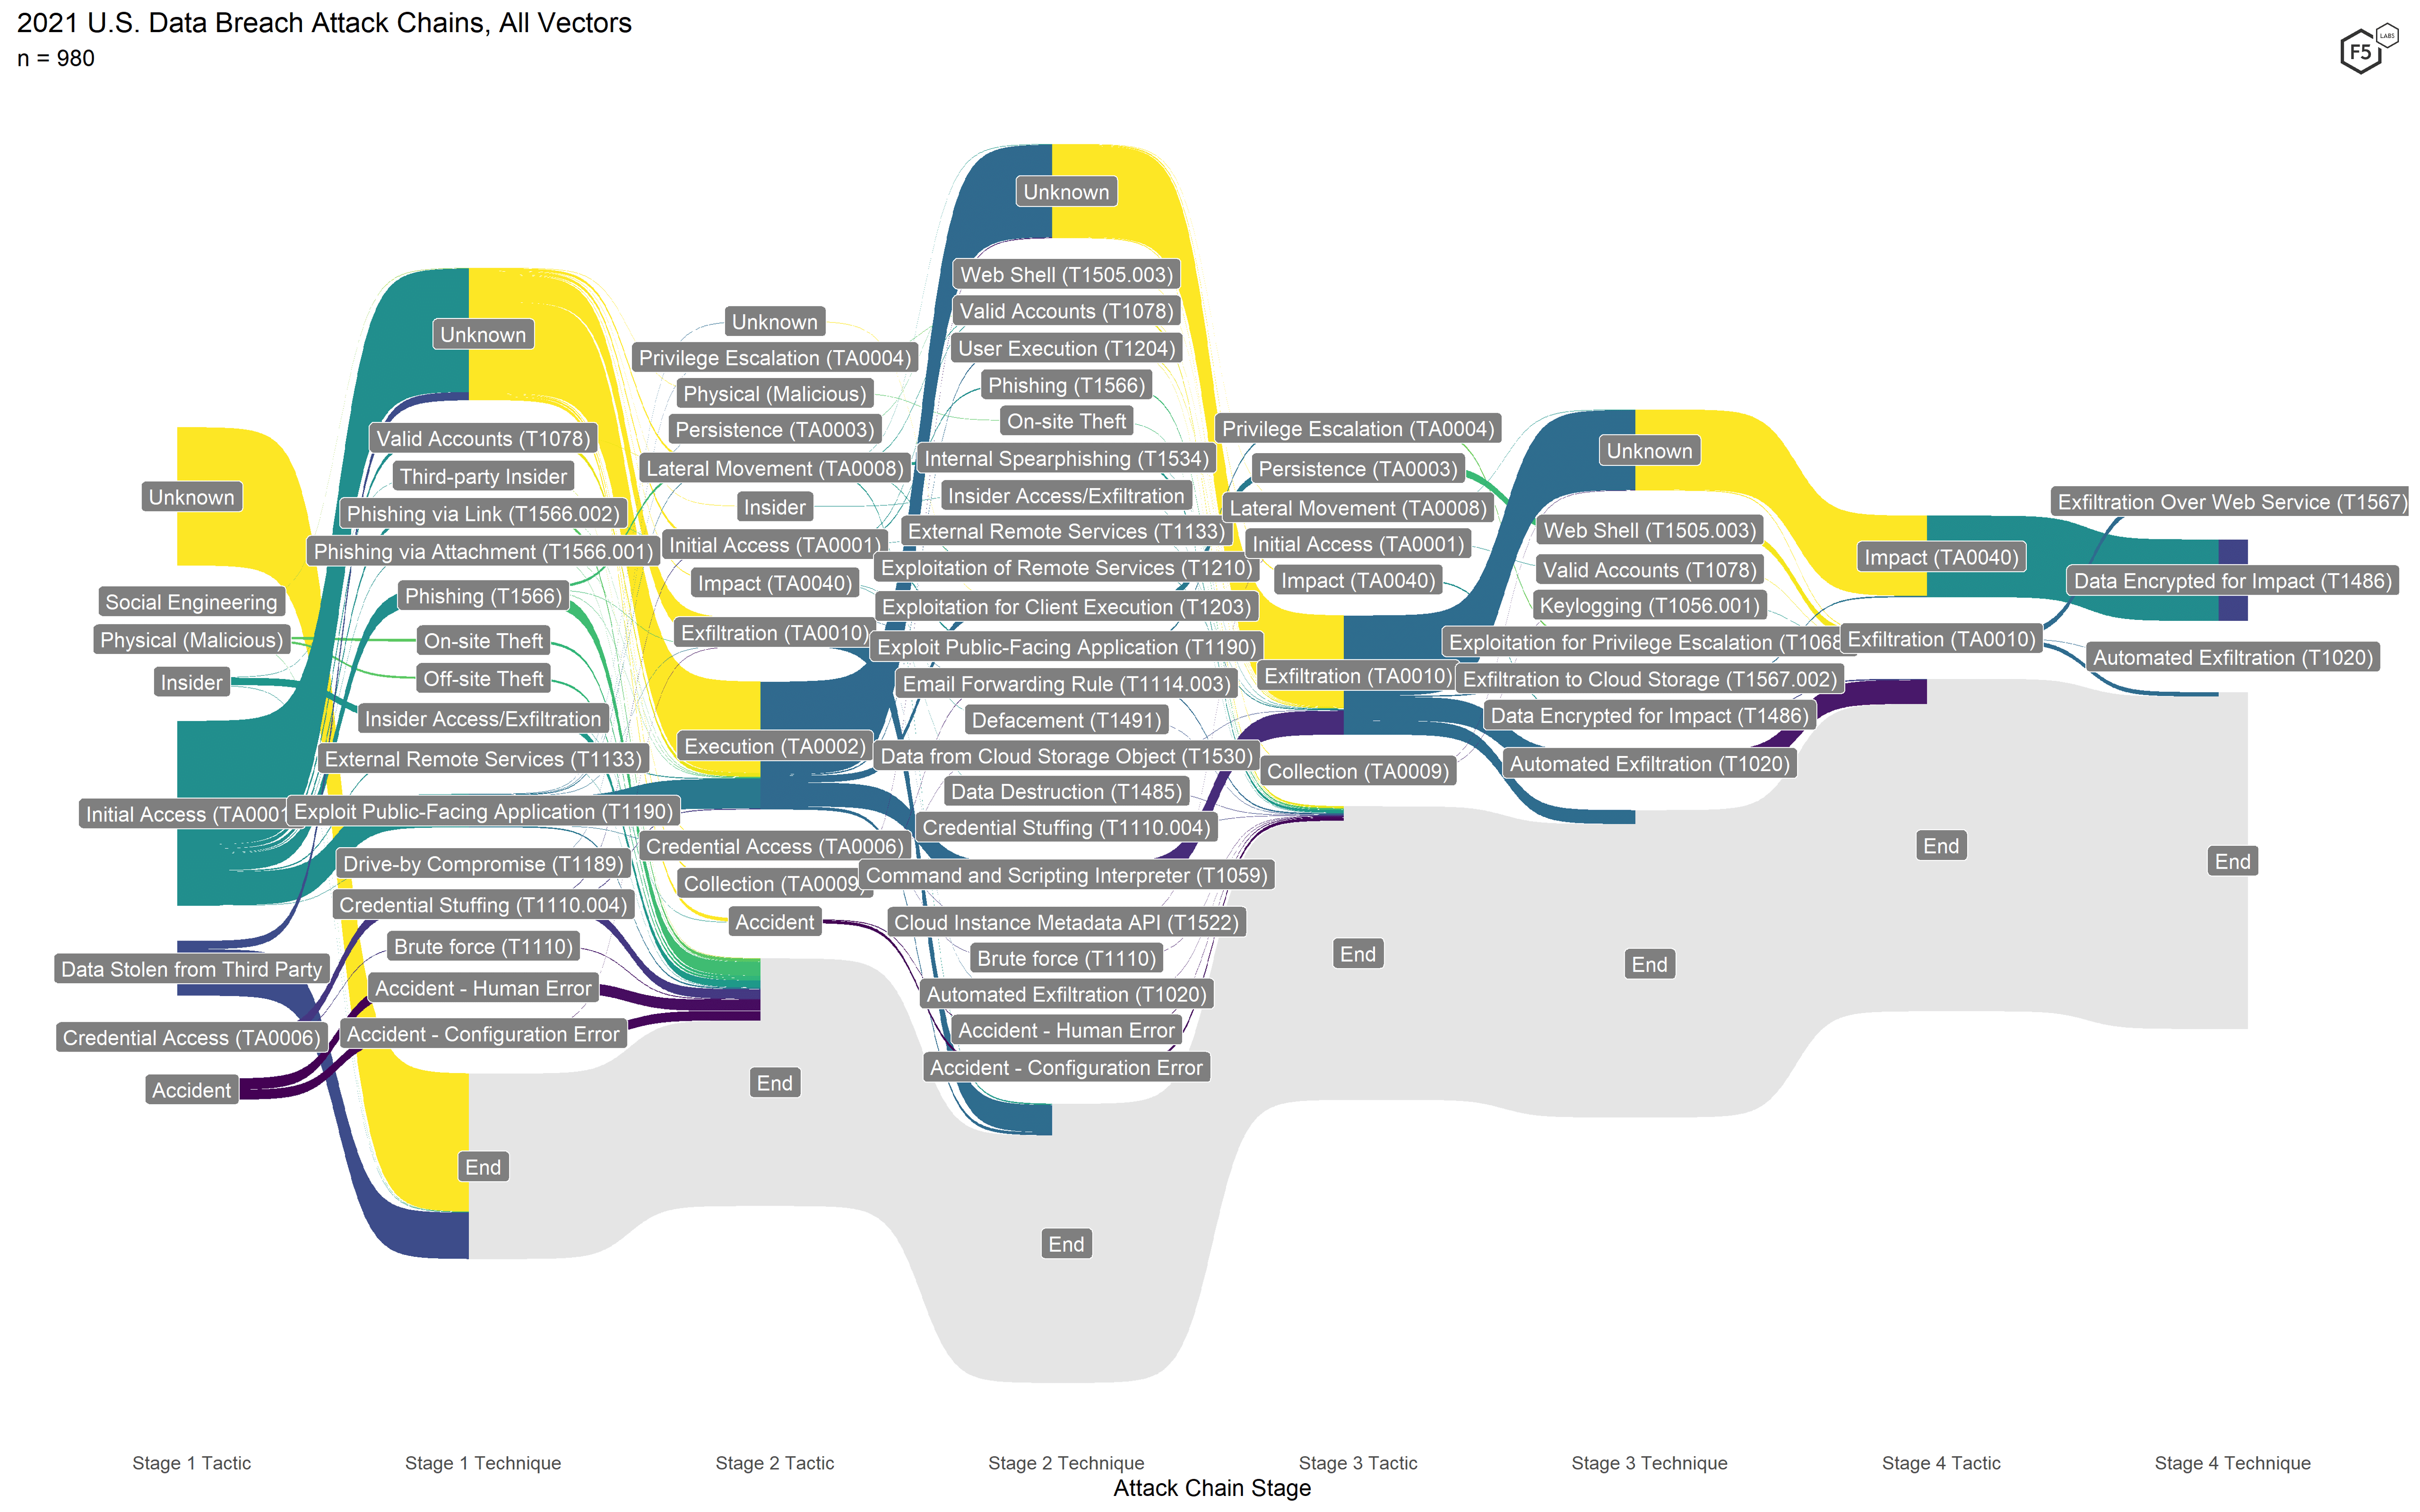
Figure 8. Attack chains for all 2021 events. Note the proliferation of techniques, particularly in Stage 2.
In contrast, the attacks in 2021 featured a wider variety of attack techniques (all subordinate to the same tactics as 2020), particularly in Stage 2. Nonapplication attacks, such as insiders, physical breaches, and accidents, all declined here as they did in the Application Tiers model. Similarly, the formjacking attack flow is significantly smaller here than it was in 2020, which corresponds to the drop in web exploits in the Application Tiers. Unlike in 2020, no other web attack campaigns came close to the frequency of the formjacking attacks, with 19 victims from the Accellion FTA breach the next most frequently observed web attack campaign.
From a defensive standpoint, the most significant change in 2021 is actually quite subtle. For a closer look, Figure 9 shows the flow diagram for 2020 with nonapplication attacks removed, and Figure 10 shows the corresponding diagram for 2021.
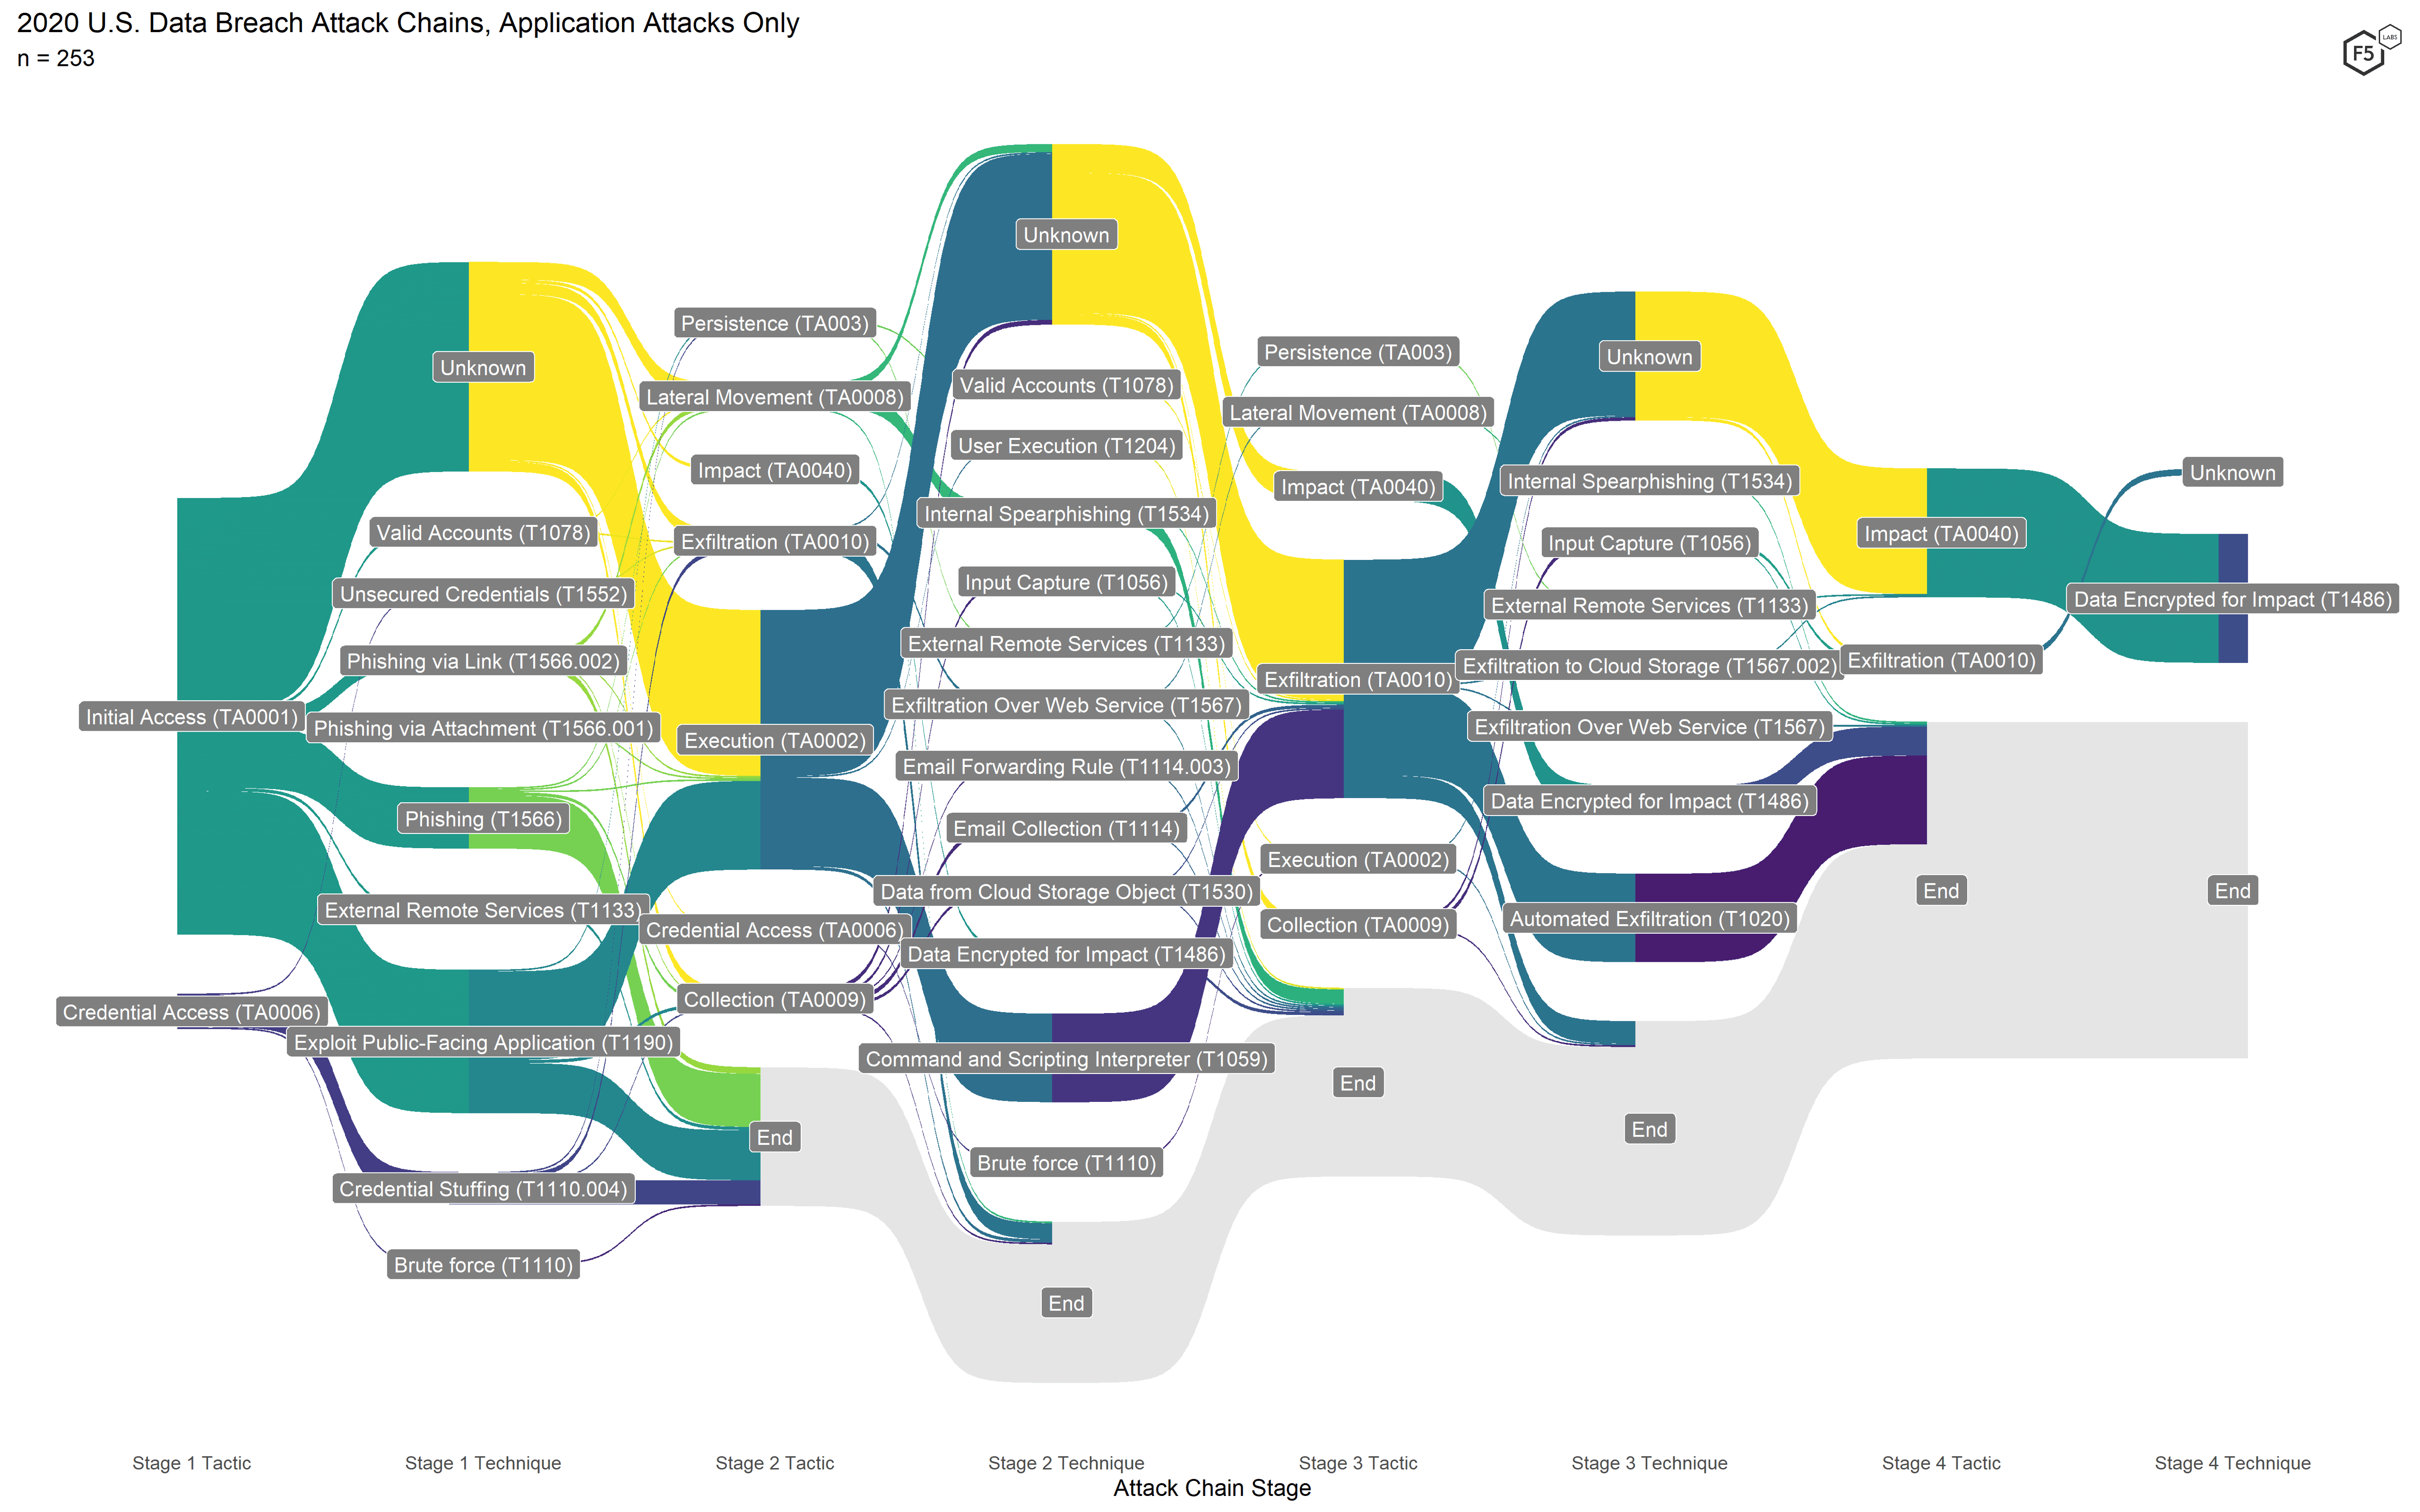
Figure 9. Application-focused attack chains for 2020. Note the higher incidence of web exploits and the lower degree of variation in terms of exfiltration compared with 2021.
Since both formjacking attacks and ransomware attacks in 2020 tended mostly to exfiltrate data in Stage 3, Exfiltration was the only Stage 3 tactic that occurred more than a few times. In 2021, not only was Exfiltration more common, a significantly greater proportion of those Exfiltration events did not go on to encrypt data. Also, a large number of attacks with unknown Initial Access techniques in Stage 1 went on to exfiltrate in Stage 2, and terminated there. This illuminates two findings that were visible but not obvious using the other models.
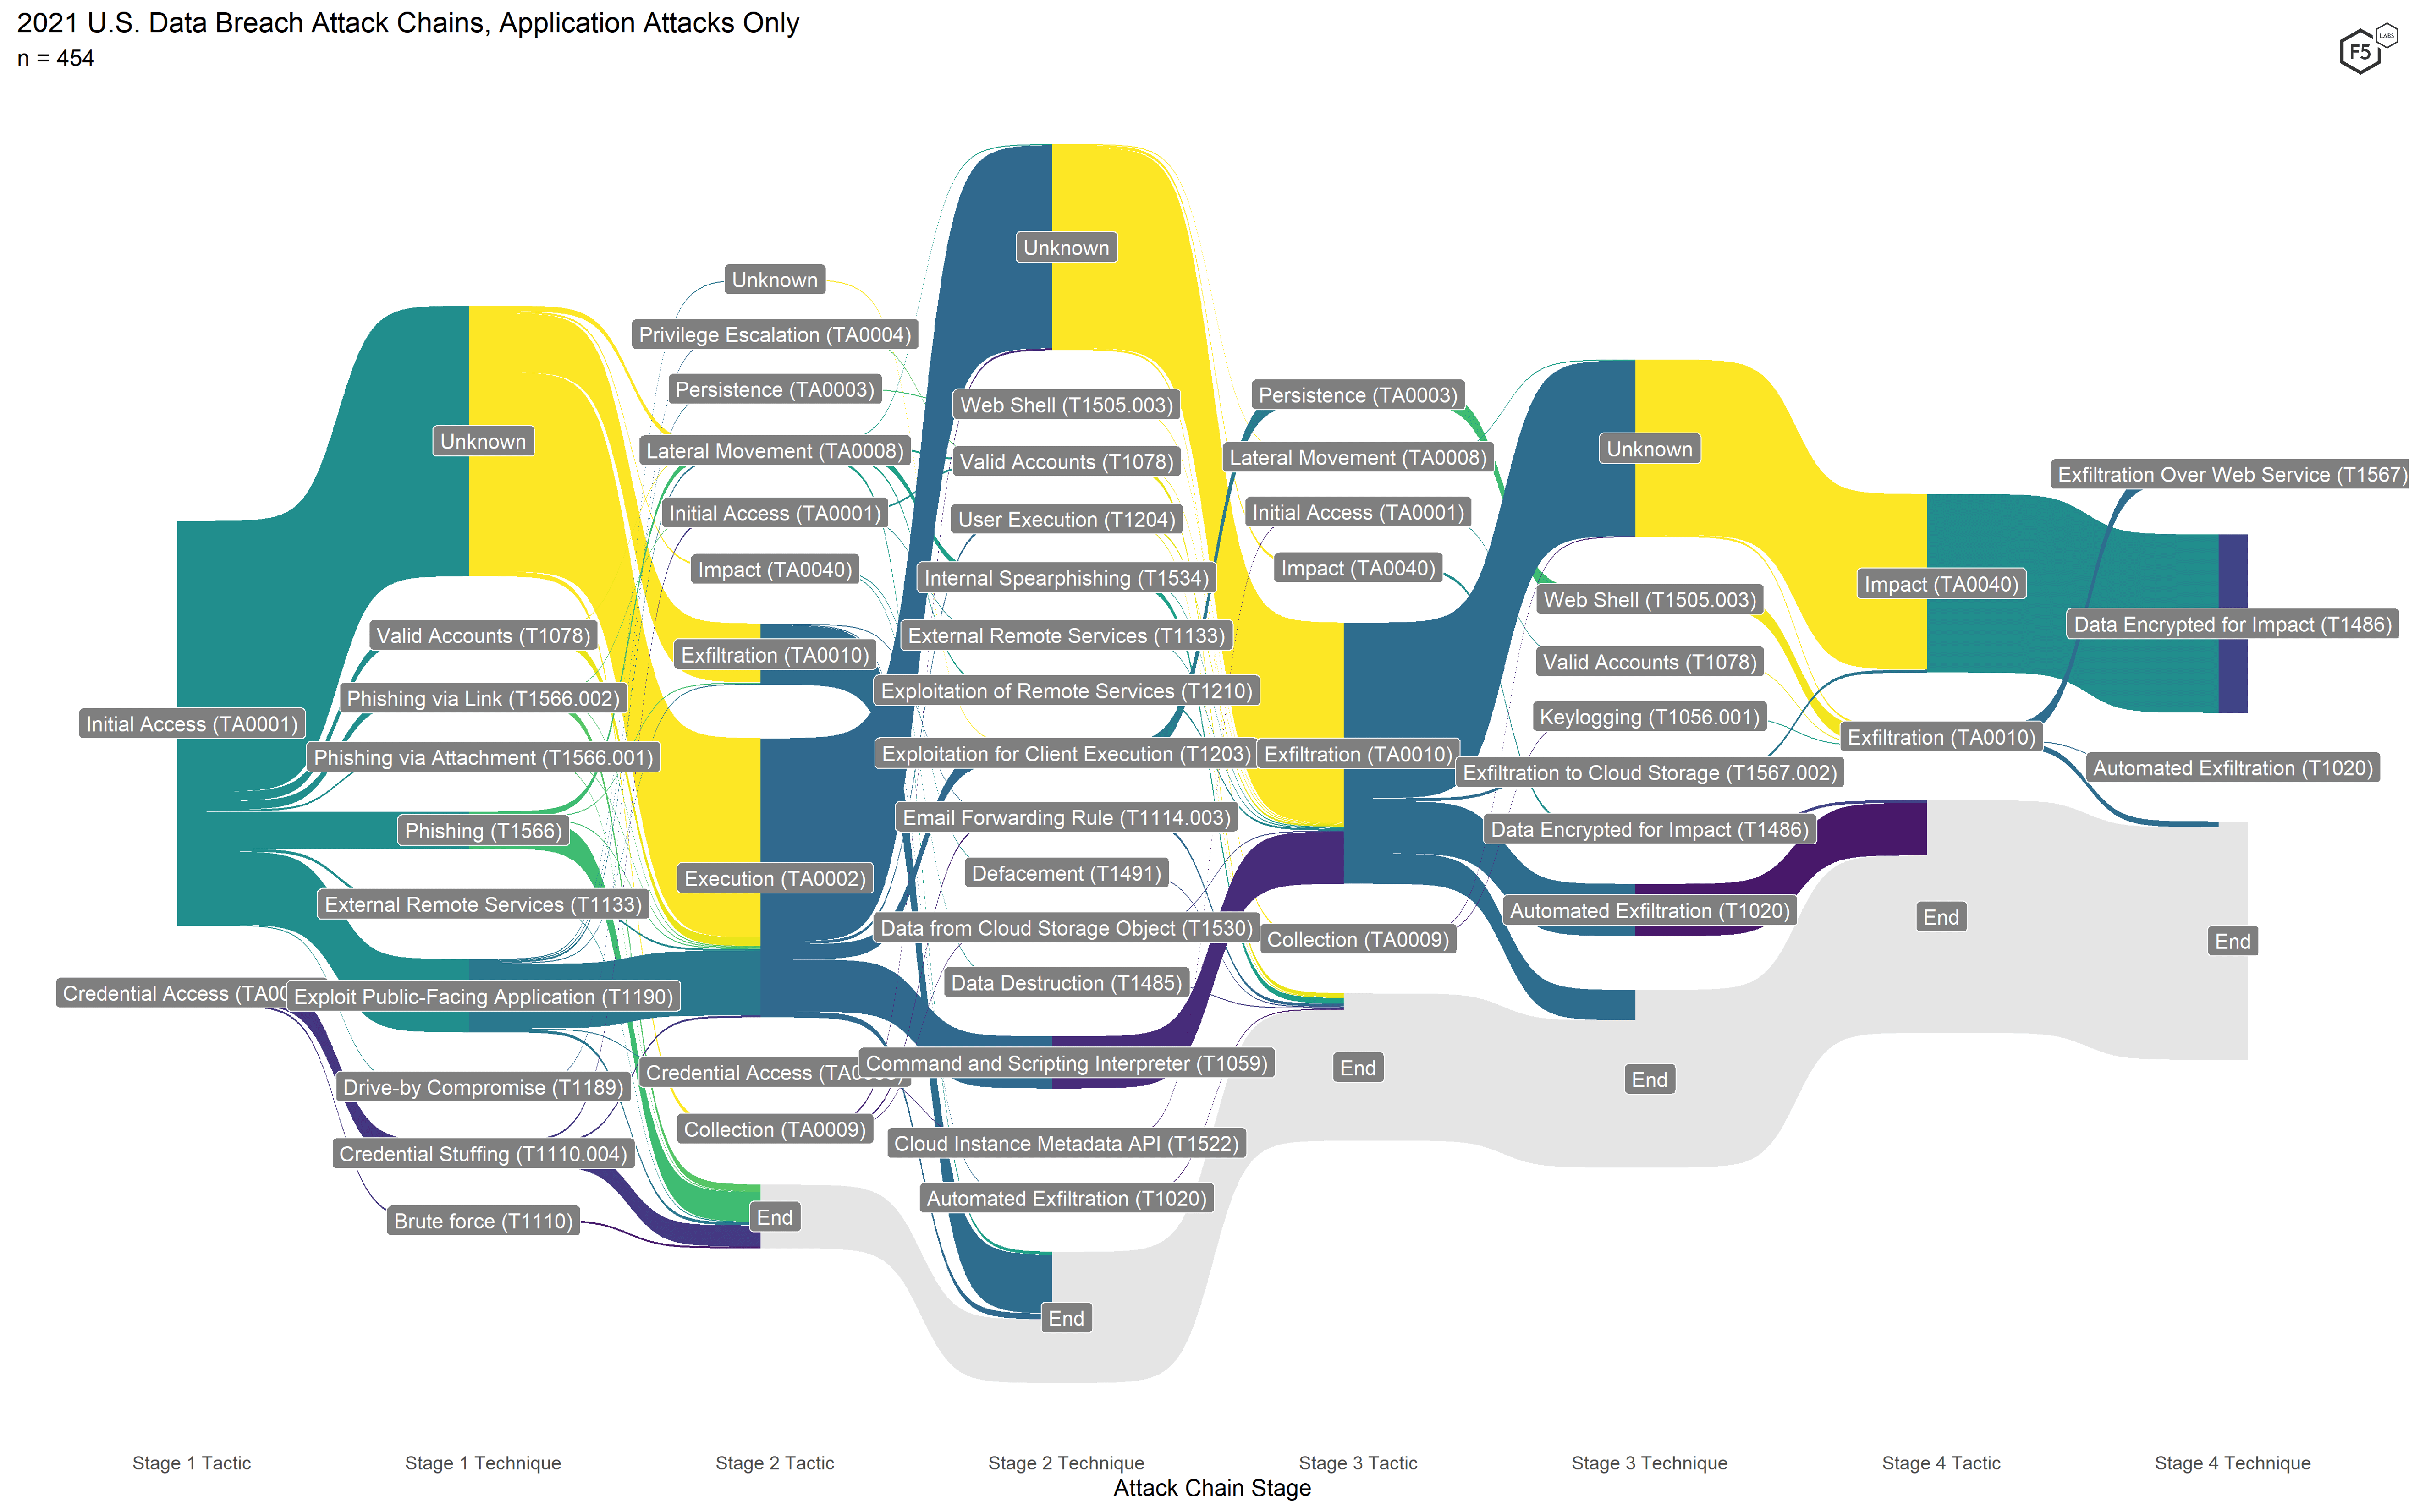
Figure 10. Application-focused attack chains for 2021. In this view the greater frequency and diversity of exfiltration events is clearer.
The first finding is one we’ve already alluded to: the resurgence of nonencrypting malware that nevertheless exfiltrates data from the environment. The second finding is the rise of attacks in which the only known characteristic was exfiltration of data from the environment. These could have been malware events, web exploits, credential stuffing attacks against administrative machines, or phishing attacks with lateral movement. In any case, it is clear that exfiltrating data is a valuable strategy for attackers, irrespective of whether they intend to demand a ransom.
Figure 11: Comparison of notable attack chains for 2021.
Taken together, these findings appear to be a partial repudiation of F5 Labs’ hypothesis from the 2021 Application Protection Report that ransomware is a way to monetize data that is more difficult to monetize than payment cards through the traditional methods for digital fraud. The hypothesis was that if data—such as employee information, email inboxes, Social Security numbers, and driver’s license numbers—were easily monetizable, attackers would not bother to intentionally sacrifice their secrecy by encrypting victims’ systems. This is particularly true because, starting around 2019, nearly all ransomware threat actors began exfiltrating data before encryption, and attackers still found it easier to demand payment from their victims rather than use or sell the data for fraud. Based on this new exfiltration finding, however, the demand for exfiltrated data for the purposes of fraud is alive and well.
Attack Chain TTP Frequency Analysis
The ATT&CK framework also makes it straightforward to count frequency of tactics, techniques, and procedures (TTPs) across the attack chains. Figure 12 shows the frequency of observed tactics in the breach data for both 2020 and 2021.
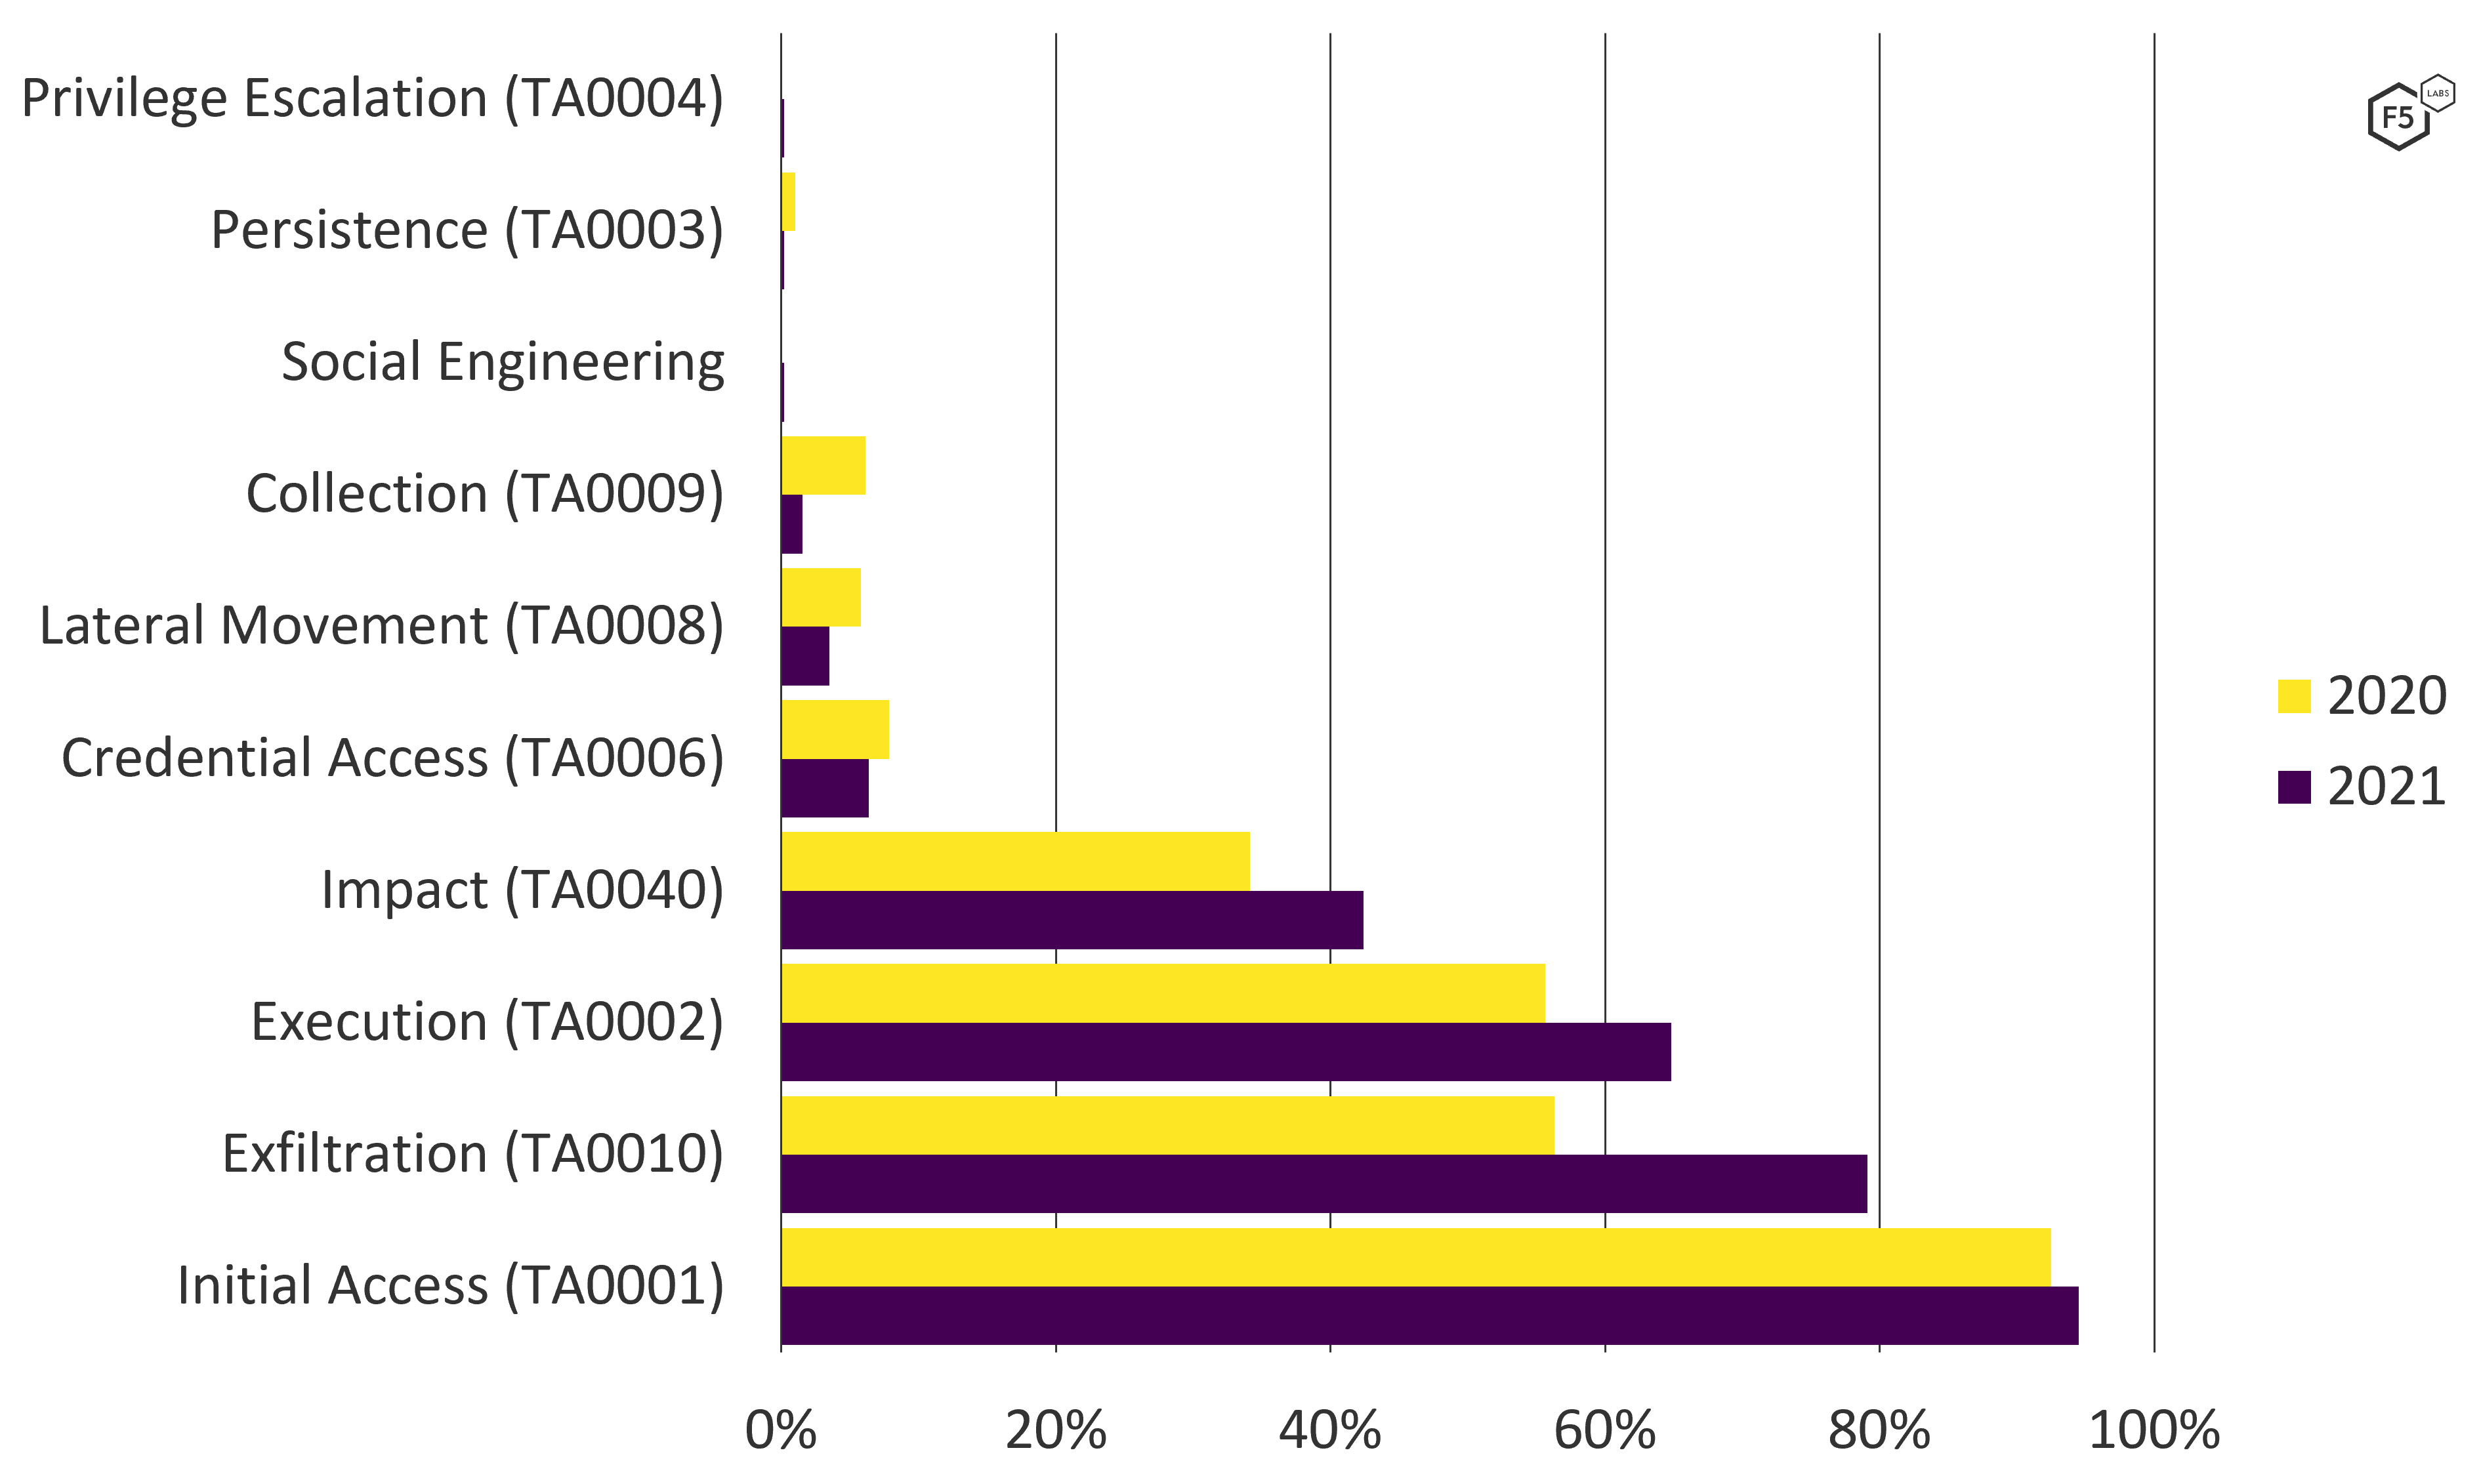
Figure 12. ATT&CK tactics leading to U.S. data breaches, 2020-2021. Note growth in Exfiltration as well as Impact and Execution to a lesser degree (n = 455).
This view also demonstrates that Exfiltration grew significantly more than any other tactic between 2020 and 2021. Impact grew slightly, mirroring the continuing growth of ransomware, and Execution grew at about the same rate, illustrating the growth of nonencrypting malware as well.5 However, Exfiltration grew from a rate of 56.3% in 2020 to 79.1% in 2021 (application attacks only).
The attack technique trends are similar (see Figure 13). Encryption events grew from 34% of application attacks in 2020 to 42% in 2021, but web exploits dropped by nearly half, from 30% to just under 17%. Automated exfiltration and the use of malicious scripts also dropped, though not by quite as much. While automated exfiltration is not restricted to formjacking attacks or other web exploits, it does feature prominently in most of the Magecart/Mirrorthief variants. While automated exfiltration is common in malware, none of the breach disclosures reporting ransomware mentioned this technique, so for this study, automated exfiltration is limited to formjacking or other web exploits.
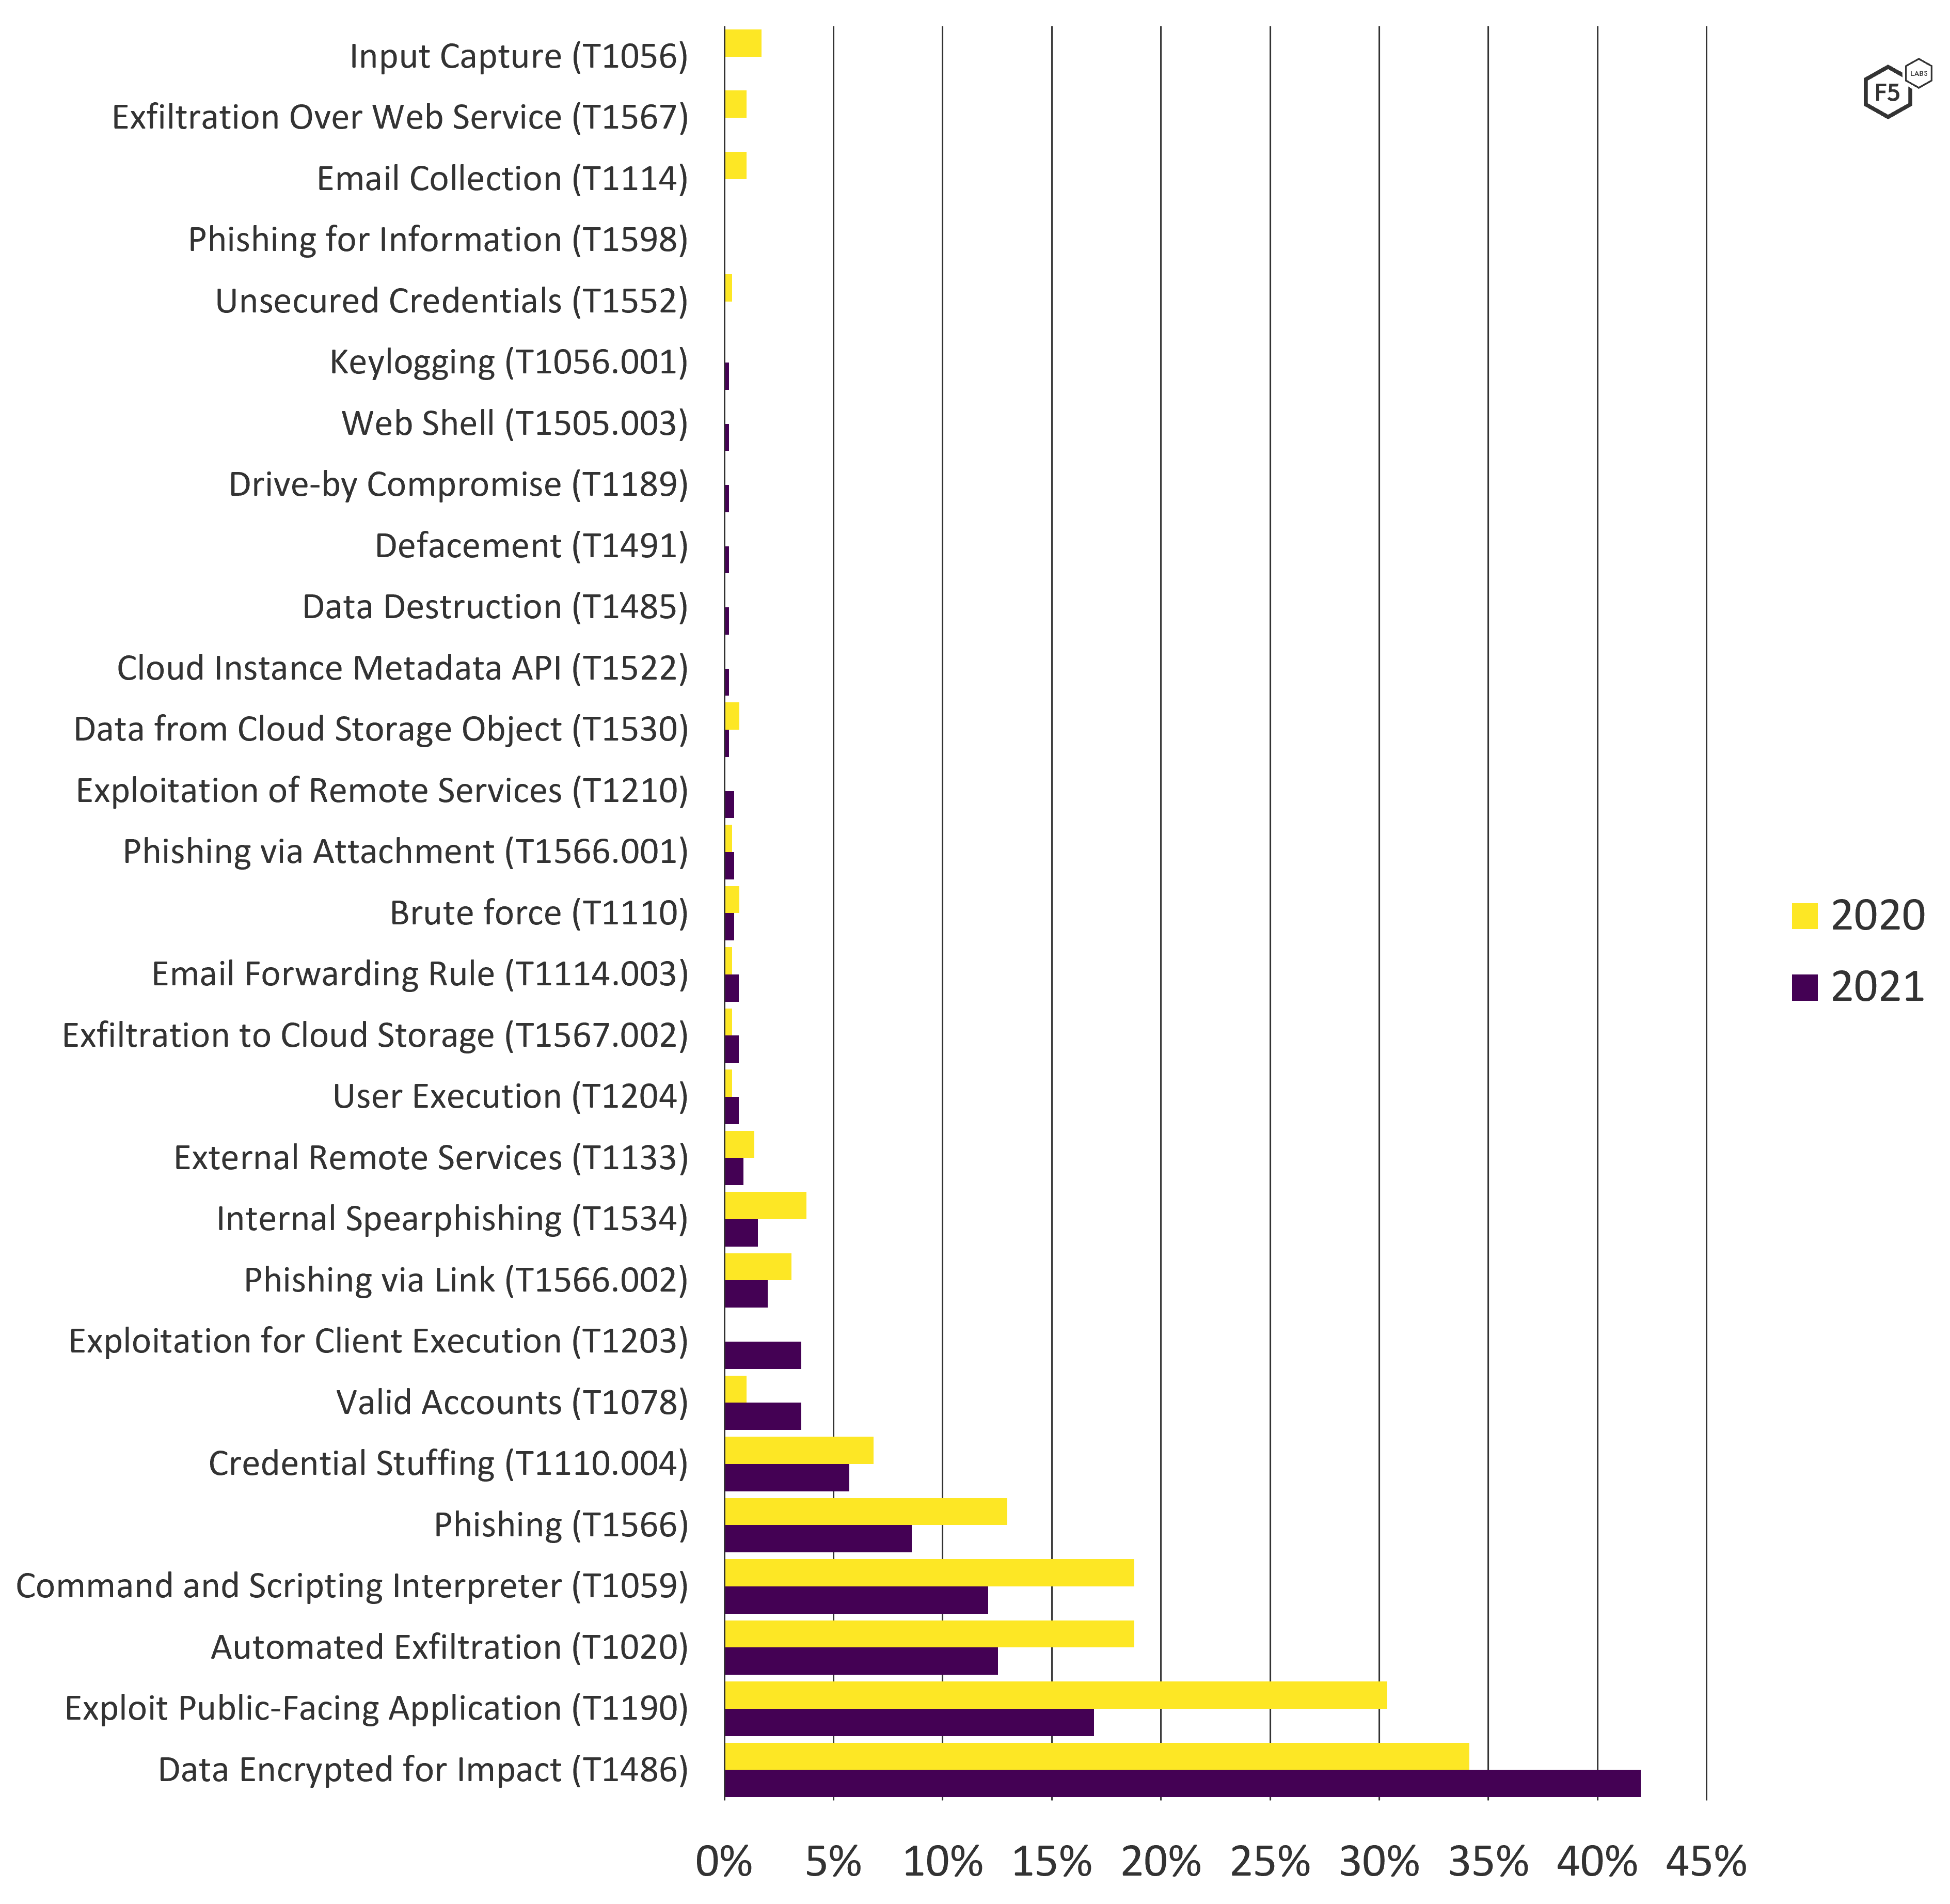
Figure 13. ATT&CK techniques leading to U.S. data breaches, 2020-2021. Note growth in encryption events but a drop in web exploits, automated exfiltration, use of malicious scripts, and phishing (n = 455).
Notable Attack Campaigns
The three models used to explore the data (see “Appendix A”) are useful for identifying trends but they are necessarily abstract. Over the course of gathering and analyzing data, F5 Labs noted several specific campaigns whose details are particularly illustrative or significant.
Insurance Quoting Application Data Exposure
In late 2020 and early 2021, a web attack campaign began against auto insurers due to an accidental data exposure in a third-party data feed. Attacker-controlled bots would visit insurance sites that used an automatic quoting feature and enter demographic information they had obtained elsewhere (usually on the dark web) for a member of the public. The site would query the third-party feed, which returned information about the person. Crucially, the feed also returned the person’s state driver’s license number, which did not appear on the screen but in the page’s HTML, where bots could scrape it. One breach disclosure conjectured that the driver’s license numbers were being used for unemployment fraud, which is consistent with behavior F5 Labs observed against government sites in its home state of Washington early in the pandemic.
Accellion FTA Exploit Campaign
Although the Accellion FTA attack campaign that began in late December 2020 did not feature prominently in the breach data, detailed information about the TTPs from cybersecurity company Mandiant and other reports provides visibility into how attackers pivot from a single vulnerability, in this case a SQL injection vulnerability, to a much more persistent and damaging attack. The basic gist of the attack was as follows:
- Attackers exploited a SQL injection vulnerability in the Accellion File Transfer Appliance (FTA) product.
- The injection attack retrieved a key that allowed them to write an eval-style PHP web shell to the file oauth.api.
- Mandiant analysts suspected the final payload, the DEWMODE web shell, was delivered by the initial web shell.
- DEWMODE scanned the MySQL database within FTA and listed available files and metadata on an HTML page that the attacker could view.
- The attacker used DEWMODE to exfiltrate files from the database.
- The attacker initiated a cleanup process that used a shell script to modify a log file, overwrite the incriminating log file with the modified one, remove DEWMODE and the eval web shell, and delete the cleanup script and related temporary files.
Figure 14 shows the simplified attack chain for the 17 organizations that disclosed this breach on their systems in 2021.
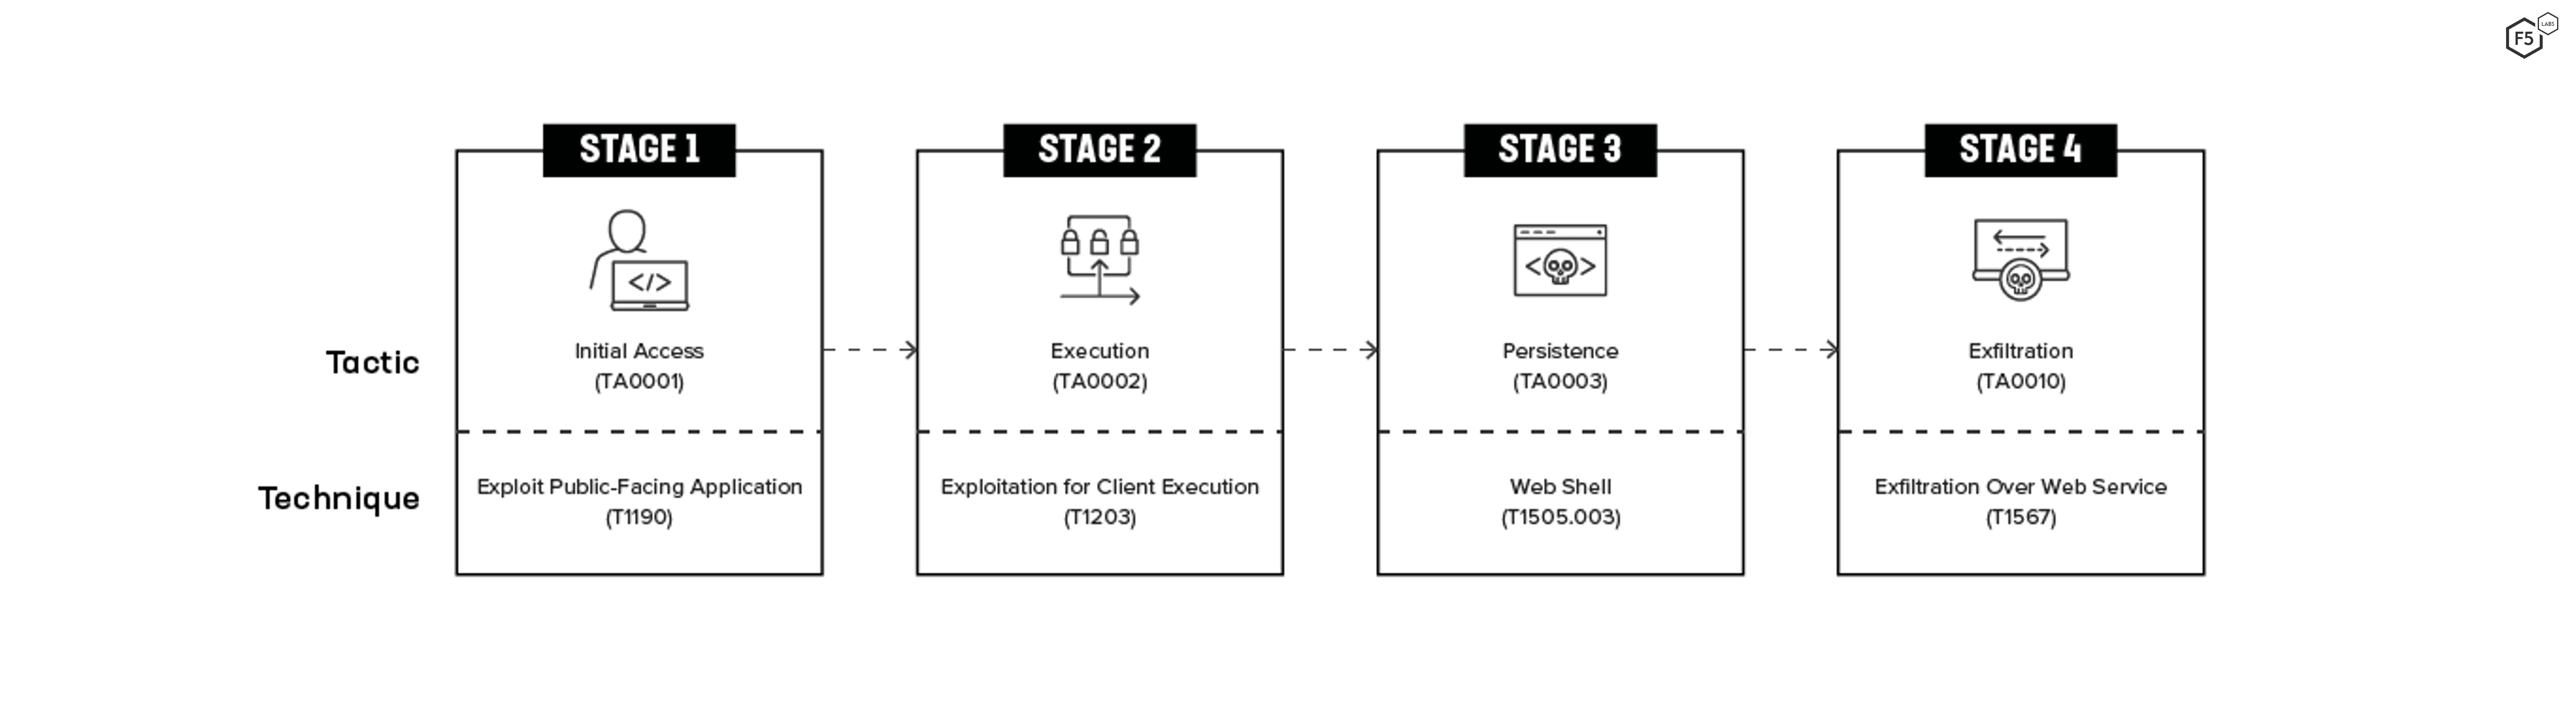
Figure 14. Simplified attack chain for Accellion FTA attacks.
Detailed Ransomware Attack Chain
Most of the breach disclosures contain very little detail, but one disclosure included so much information about its ransomware attack that it was possible to populate a comprehensive attack chain (Figure 15). Obviously, not all ransomware attacks follow this path. As an attack vector, malware probably has the greatest number of possible combinations. Nonetheless, it is instructive to see the steps that one attacker took. The initial access technique was a drive-by compromise, followed by privilege escalation via valid accounts, exfiltration to cloud storage using the tool MEGASync (it is unknown whether MEGASync was already in the environment or the attacker loaded it), and, finally, the local data was encrypted for ransom.
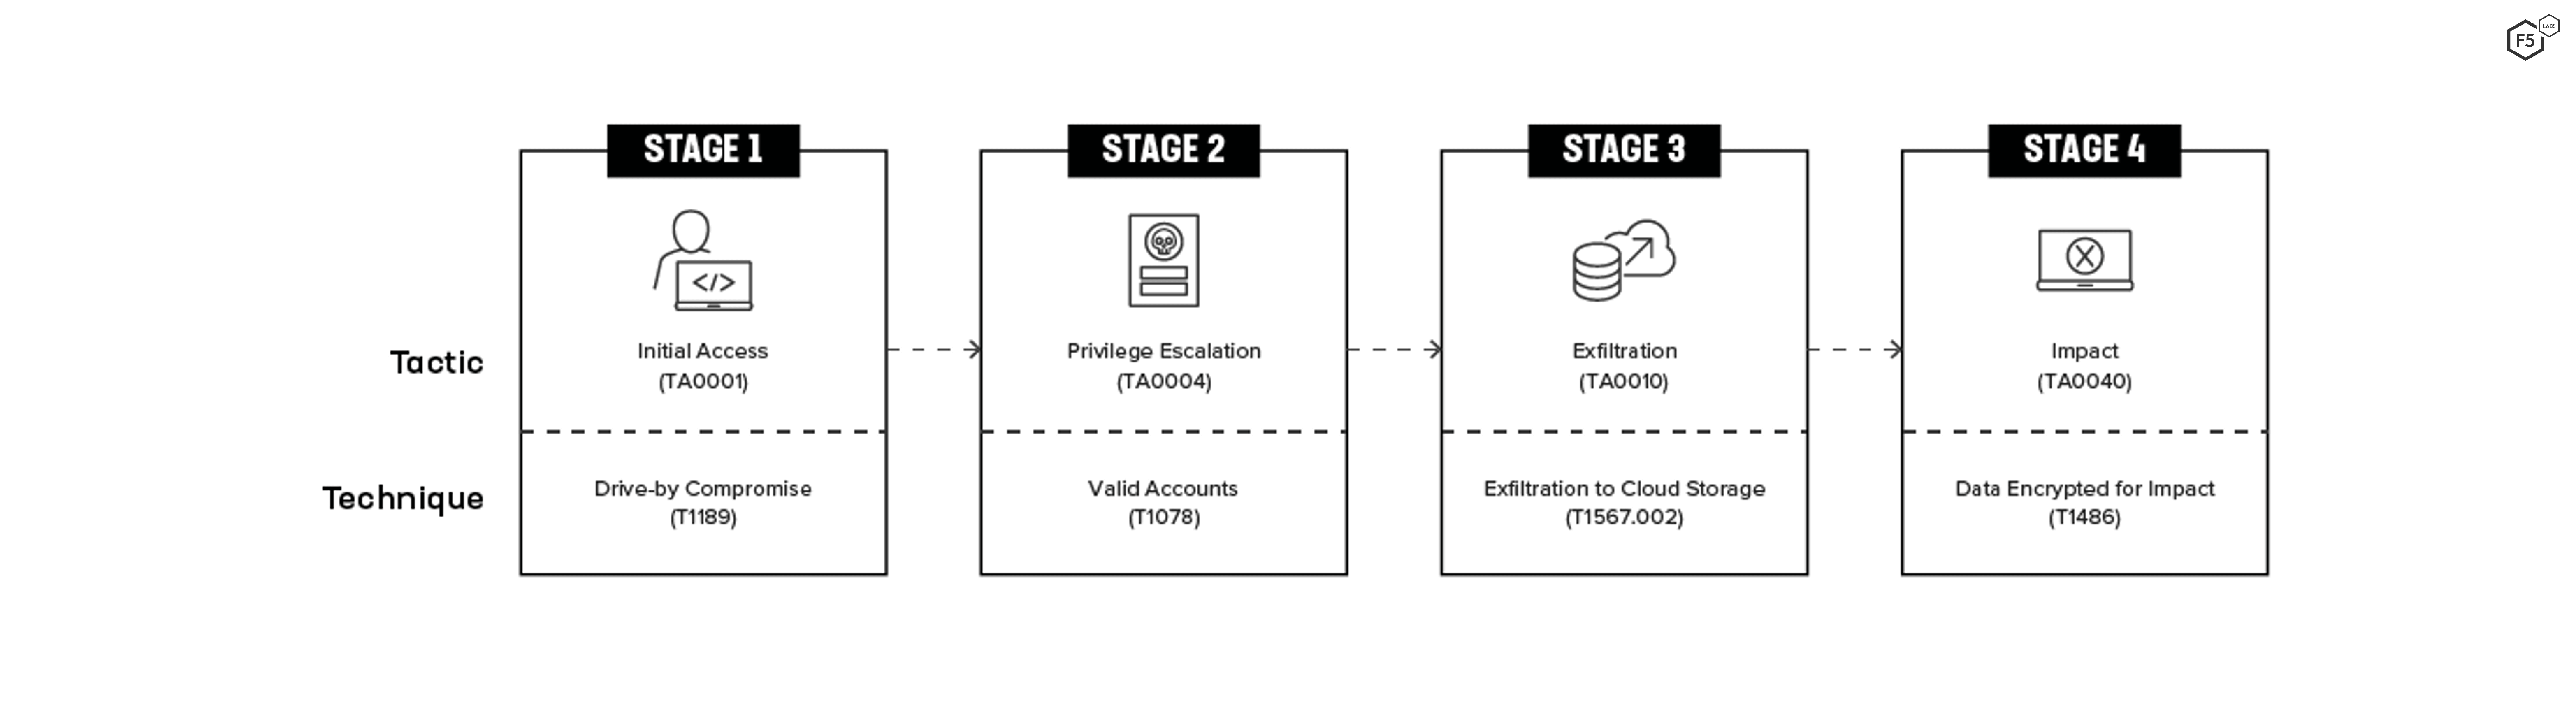
Figure 15. Attack chain for one specific ransomware attack in 2021. The detail in the breach disclosure allows for more visibility into attack techniques.
Repeat Formjacking
In 2021, there were two instances in which organizations detected a formjacking compromise, found and removed the malicious script from their sites, and returned to normal, only to be hit by the same attack again a month or two later. Two such instances were also noted in 2020 and one in 2019. These kinds of events illustrate the difficulty of truly ensuring your environment is uncompromised and the dangers of declaring victory too soon. In one case, it took a few months for the breached organization to realize they’d been hit a second time, indicating that if they tried to improve detection capabilities after the first attack, they didn’t succeed.
Cloud Incidents
As part of the 2021 Application Protection Report, F5 Labs reviewed a small number of publicly disclosed cloud incidents as well as what was known about the Blackbaud cloud breach of 2020. Based on that data, access control misconfiguration was significantly more likely than malicious behavior to expose data and lead to a loss for an organization. The tentative conclusion was that the shifting boundary of responsibility between cloud providers and cloud customers, even within a given cloud, makes it hard for organizations to ensure that their cloud security posture matches their risk appetite. This has the effect of reintroducing in another form much of the security risk that the cloud is supposed to allay. In 2021, F5 Labs collected data on cloud management and security from three different sources to test this hypothesis.
Cloud Security Summary
- Publicly disclosed breaches indicate that third-party data loss is the most likely source of a legally significant cloud incident.
- Open-source intelligence and news reports indicate that access control misconfiguration is more likely to lead to data exposure than any other cause.
- Scans of IP address blocks known to be in the cloud indicate that outdated systems management practices are common among clouds other than Amazon Web Services (AWS) and Microsoft Azure.
- This combination of failures indicates many organizations approach cloud environments either like on-premises or like turnkey systems that can simply be consumed—both approaches are limited.
Publicly Disclosed U.S. Cloud Breaches
The set of data breaches analyzed in the “Data Breach Causes” section contained 30 incidents related to cloud systems, not including the Blackbaud breach of 2020. Figure 16 shows the distribution of causes for 2021 cloud breaches. Third-party data loss made up more than half of the incidents.
These 16 third-party notification events were generated by four incidents: one had an unknown cause, one was a ransomware attack, one involved the exploitation of an application vulnerability, and two were misconfigurations or accidents. While this doesn’t reveal how attackers exfiltrate data from cloud environments, it does indicate how cloud security incidents manifest as losses for organizations: indirectly. The organizations sending these disclosures about third-party breaches to their customers (the public) are the customers of the customers of the cloud provider. This is one of the ways that risk is transferred and compounded in distributed clouds.
If that sounds like a maze of responsibility, some proper nouns can help unpack this. Three organizations—Northern Jet Management, Aero Charter, and Solairus Aviation—sent out disclosures after their vendor, Avianis, experienced an attack composed of two chained exploits, followed by exfiltration via an unknown method. Avianis’ application was running on Microsoft Azure. To the public, Solairus, Aero Charter, or Northern Jet Management is the second party, Avianis is the third party, and Azure is the fourth party. The existence of a vulnerability in the Avianis product makes it clear in this case where the responsibility for this event lies, but when it comes to misconfigurations and access control, the story gets more complicated. These publicly disclosed cloud breaches demonstrate how many different parties are responsible for handling data in a modern distributed cloud, and this is part of the problem, even if it is not the entire problem. Figure 17 shows attack chain visualizations for the cloud-only events. The Azure/Avianis third-party breach is visible as the high-frequency chain running through the upper center of the diagram (hover over "Avianis Cloud Breach" to see this chain more clearly).
Many different parties are responsible for handling data in a modern distributed cloud, and this is part of the problem, even if it is not the entire problem.
Figure 17. Attack chain visualizations for cloud-related U.S. data breaches in 2021. Note the prevalence of third-party breaches.
Since the cloud represents such a different paradigm from on-premises, from a cost standpoint if nothing else, it is impossible to discuss the risk of the cloud without also talking about the operational advantages it offers. Since organizations with different lines of business will interpret those advantages and risks differently, Figure 18 shows the cloud breaches broken down by industry. The Finance and Insurance sector experienced a greater proportion of breaches than the next two sectors put together, matching the trend in noncloud breaches.
Open-Source Cloud Intelligence
Information about cloud incidents sourced from industry reports and news publications indicates that misconfigurations and accidents are the primary causes for cloud incidents in 2021, similar to the findings in the 2021 Application Protection Report. In fact, of the 47 incidents in this data set, 43 of them were misconfigurations, meaning that accidents are nearly 11 times more likely than access breaches or third-party data losses, according to these two data sources.
This obviously represents a big departure from the breach disclosure data. The hypothesis for this discrepancy is that differential mechanisms and thresholds of reporting exist between legally significant breaches and newsworthy incidents. Note that these 47 incident reports aren’t called out as breaches for a reason because security researchers, not malicious attackers, discovered many of these data exposures, and did not exfiltrate any data.
The most likely explanation for the discrepancy is that both of these data sources are valid but partial. The breach data, which collects legally mandatory disclosure events, captures the increasingly complex business relationships that define how data moves around and is processed in a distributed cloud. Incidents taken from the news, in contrast, illuminate the practical mechanisms by which data gets stolen (or, in this case, abandoned) on the web. These practical mechanisms deserve further inquiry.
Leaving aside the 43 breaches by misconfiguration and focusing on the remaining four malicious breaches, three were due to compromised credentials, two of which were AWS Access keys, and one of which was a set of compromised AWS console credentials. The fourth breach was a web exploit—one of the aviation companies discussed earlier, whose data was lost by a Software as a Service vendor running on Azure.
The remaining 43 incidents were access control misconfigurations, including some incidents in which data was uploaded to cloud storage and never access-controlled at all. 36 out of those 43 represent cloud storage with the wrong access control settings. Of those 36, 25 are from AWS S3, eight are from Azure cloud storage, and three are from Google Cloud Platform (GCP). The remaining misconfiguration events were GitHub repositories containing data that was mistakenly uploaded and not access-controlled, a Microsoft Power Apps misconfiguration that affected dozens of organizations, and a Bitbucket repository that used default admin/admin credentials.
In short, examples abound of organizations that moved data to the cloud and either failed to recognize that they needed to secure that data or failed to execute on that need. Figure 19 shows the distribution of these cloud incidents by industry. For this data set, the Finance and Insurance sector is tied for third place, behind Public Administration organizations (most of which are outside of the United States) and the Information sector.
Misconfiguration Hunting Through Cloud Scanning
In late 2021, F5 Labs’ data partner Effluxio scanned the entire Internet looking for servers open to SSH connections. By mapping known cloud IP address ranges to hosts responding on port 22 and fingerprinting the responses, configuration patterns of SSH for cloud systems management could be assessed, providing a window into how, and how well, many users are managing their cloud instances. There is nothing inherently insecure about using SSH to manage systems in the cloud, and this approach can be done right, but its authentication limitations at scale (such as its dependence on simple passwords, public key infrastructure, or Active Directory) make it less desirable in most circumstances than programmatic control using cloud APIs. Because of this, this scan is a sort of finger-in-the-air assessment of cloud management maturity.
Different clouds had remarkably different proportions of hosts listening on port 22 (see Figure 20). While AWS and Azure hosts were listening for SSH less than 2% of the time, GCP and Oracle Cloud were both between 10% and 20%, and DigitalOcean, a cloud oriented more toward start-ups and developers instead of enterprises, had nearly 55% of its hosts listening for SSH. The implication is that clouds that are more associated with enterprise operations—AWS and Azure—show greater management maturity than the smaller or more niche clouds.
In some positive news, the scan revealed that 99.1% of responding hosts were supporting either SSH 2.0 or SSH 1.99, which is a backward-compatible version of SSH 2.0. Only 0.9% of hosts supported 1.5 or earlier, though that is still 150,000-plus servers. Versions of SSH earlier than 1.99 contain several vulnerabilities whose exploitation can result in man-in-the-middle attacks, private key theft, or expose sensitive information about encryption ciphers.6
In some negative news, 38.7% of hosts supported 3DES as a cipher, which NIST deprecated in 2017. However, perhaps the most troubling finding from the standpoint of cloud configuration is the prevalence of simple password authentication for SSH connections—57.4% of hosts accepted simple password authentication for SSH. This is second only to public key authentication at 91.7%, which offers significantly greater security, especially at scale and over the long term. Two clouds, Azure and DigitalOcean, featured password authentication as their second most frequently supported authentication mechanism after public keys. However, the low rate of SSH use in Azure means that even this second-ranked authentication mechanism is probably not very common.
In sum, the scans revealed an unexpectedly large prevalence of SSH use for cloud management, given that using cloud APIs for controlling virtual machines (VMs) is preferable. Some of these parties using this suboptimal management solution are doing so suboptimally, using weak authentication or weakening potentially stronger authentication with deprecated ciphers. Obviously, the low rate of SSH support in the larger cloud providers’ IP address ranges means that not everyone is mismanaging their VMs, but still, the overall picture is one of legacy practices in modern environments.
Summarizing Cloud Risk
For the sake of clarity, the findings about SSH and cloud management from the Effluxio scans are independent from the cloud incidents or cloud breaches examined earlier in this section. No observable causal relationship exists; instead, evidence shows outdated management practices from one angle, a large number of misconfigurations leading to security exposures from another angle, and a large number of third-party breaches occurring in the cloud. What conclusions can be drawn from this?
Misconfigurations Can Mask Risk of Standard Attacks
By now it should be clear that access control misconfigurations are rampant in the cloud, but it is important to recognize the cloud events in the U.S. breach disclosures that don’t result from accidents but from malicious actors. The small number of incidents in our data make it difficult to assess the magnitude of this threat, but there is no reason to believe that a vulnerability in a cloud system is any less likely to be exploited than one running on-premises. This is an aspect in which the truism/joke that “the cloud is just other people’s computers” is more true than not, and the implication is that nearly all standard attack vectors apply in the cloud as well.
What this means is that organizations in the cloud, or planning to go to the cloud, need to consider misconfiguration risk in addition to existing threats on the web, not as a substitute. Since F5’s State of Application Strategy in 2021 report found that 87% of respondents manage both traditional and modern architectures, this risk applies to nearly everyone.7 If your application has a login function for end customers, expect it to be targeted by credential stuffing, irrespective of who is responsible for the infrastructure. If your application has a vulnerability, expect it to be exploited, and so on. In theory, the unique capabilities of the cloud should make it easier to mitigate these vectors over the long term, but the cloud cannot automatically invalidate any specific attack technique.
Cloud Misconfigurations Indicate Confusion about the Paradigm
The enduring prevalence of data exposure via cloud misconfiguration appears to indicate that many organizations are not quite getting something right about the cloud. On the one hand, ample evidence shows that many cloud users (though notably not many in AWS or Azure) are managing the cloud using outdated practices. On the other hand, the large number of misconfigurations in public reports also indicates that some organizations operate in the cloud as though it will magically take care of everything. If that sounds harsh, keep in mind that unprotected data in AWS S3 buckets—which was the single most frequent misconfiguration by far—requires the deliberate removal of default AWS access controls. Figure 21 shows the warning that AWS requires users to acknowledge before they create a bucket with public access.
Figure 22 shows the corresponding warning when making existing buckets public. AWS has set its systems up to prevent customers from using this setting. You need to try to expose data this way. It doesn’t just happen.
The point is that the cloud is neither identical to on-premises infrastructure, nor is it an omnipotent technology concierge service that one can consume as an end user. Cloud management is its own practice with its own set of tools. Many on-premises principles still apply, but in modified fashion, and configuration management is chief among these modified principles. The “Recommended Mitigations” section explores configuration management in the cloud in greater detail.
The cloud is neither identical to on-premises infrastructure, nor is it an omnipotent technology concierge service that one can consume as an end user.
| Mitigation | Frequency |
| Data backup | 0.42 |
| Application isolation and sandboxing | 0.17 |
| Exploit protection | 0.17 |
| Network segmentation | 0.17 |
| Privileged account management | 0.17 |
| Update software | 0.17 |
| Vulnerability scanning | 0.17 |
| Filter network traffic | 0.13 |
| Network intrusion prevention | 0.13 |
| Antivirus/antimalware | 0.12 |
| Code signing | 0.12 |
| Disable or remove feature or program | 0.12 |
| Execution prevention | 0.12 |
| Restrict web-based content | 0.12 |
| User training | 0.09 |
| Account use policies | 0.06 |
| Multifactor authentication | 0.06 |
| Password policies | 0.06 |
| User account management | 0.06 |
| Application developer guidance | 0.04 |
| Limit access to resource over network | 0.03 |
| Audit | 0.01 |
| Encrypt sensitive information | 0.01 |
| Threat intelligence program | 0.00 |
| Restrict file and directory permissions | 0.00 |
Table 1. Mitigation recommendations based on frequency of corresponding attack technique. Note that rounding obscures the low frequency of the lowest few mitigations.
Cloud Attacks Are Efficient Attacks
The large number of third-party breaches in the U.S. breach data indicates that organizations that offer a cloud-based aaS to other organizations run a particularly high risk of attack because they contain so many different organizations’ data. This kind of attack-one-reap-many approach seems particularly well suited to business models that thrive in the cloud. Attacking this kind of target simplifies the work compared to an attack campaign that needs to exploit the same vulnerability on hosts belonging to multiple customers. Both SolarWinds and recent formjacking campaigns make it clear that these attacks are not limited to the cloud, but the cloud might turn out to be the perfect environment for them.
Recommended Mitigations
Among the ATT&CK framework’s many strengths is MITRE’s mapping between attack techniques and mitigations. This makes it straightforward to pivot from the observed frequency of attack techniques to produce a prioritized list of recommendations. However, it is important to recognize what these lists represent; they are not a holistic security architecture or best practices. It is better to view these lists as a sort of minimum bar. They contain some of the controls that would (potentially) have stopped attacks whose impacts crossed a certain legal threshold. If you see controls here that don’t apply to you based on your own observations, or if you think a control is a good idea and it’s not listed here, follow your gut.
Because different organizations choose controls according to different priorities, F5 Labs is providing three different rankings for prioritizing controls based on MITRE’s recommended mitigations. Table 1 shows the simple ranking based on frequency. Data backup remains at the top of the list, which is unsurprising given the frequency of ransomware events. After data backup, six mitigations are all tied for frequency. Based on the prevalence of nonencrypting malware as well, all six of these should remain high priorities for any mature organization seeking a hardened environment.
However, some security teams need to prioritize coverage and efficiency above all else, so Table 2 shows the mitigations ranked by the number of observed attack techniques that it would (potentially) mitigate.
Note that, in this table, restricting web-based content emerges as the control with the greatest theoretical efficiency, as it represents a potential control for malicious script injection; multiple forms of phishing, including malware executed from attachments; and exfiltration, both to and from cloud storage.
| Mitigation | Coverage |
| Restrict web-based content | 7 |
| Disable or remove feature or program | 5 |
| Multifactor authentication | 5 |
| Network segmentation | 5 |
| User training | 5 |
| Application isolation and sandboxing | 4 |
| Exploit protection | 4 |
| Network intrusion prevention | 4 |
| Privileged account management | 4 |
| User account management | 4 |
| Antivirus/antimalware | 3 |
| Data backup | 3 |
| Filter network traffic | 3 |
| Password policies | 3 |
| Update software | 3 |
| Account use policies | 2 |
| Audits | 2 |
| Encrypt sensitive information | 2 |
| Execution prevention | 2 |
| Limit access to resource over network | 2 |
| Vulnerability scanning | 2 |
| Application developer guidance | 1 |
| Code signing | 1 |
| Restrict file and directory permissions | 1 |
| Threat intelligence program | 1 |
Table 2. Mitigation recommendations based on breadth of coverage, that is, how many observed techniques would be mitigated by that control.
Finally, Table 3 ranks control recommendations based on the product of the depth (frequency) and breadth (coverage) of the controls, which we’ve named the arbitrary effectiveness coefficient. This is intended to incorporate both coverage and frequency to provide a more balanced prioritization.
| Mitigation | Arbitrary Effectiveness Coefficient |
| Data backup | 1.26 |
| Network segmentation | 0.85 |
| Restrict web-based content | 0.85 |
| Application isolation and sandboxing | 0.68 |
| Exploit protection | 0.68 |
| Privileged account management | 0.68 |
| Disable or remove feature or program | 0.61 |
| Update software | 0.51 |
| Network intrusion prevention | 0.50 |
| User training | 0.43 |
| Filter network traffic | 0.38 |
| Antivirus/antimalware | 0.36 |
| Vulnerability scanning | 0.34 |
| Multifactor authentication | 0.29 |
| Execution prevention | 0.24 |
| User account management | 0.23 |
| Password policies | 0.17 |
| Code signing | 0.12 |
| Account use policies | 0.11 |
| Limit access to resource over network | 0.06 |
| Application developer guidance | 0.04 |
| Audit | 0.01 |
| Encrypt sensitive information | 0.01 |
| Threat intelligence program | 0.00 |
| Restrict file and directory permissions | 0.00 |
Table 3. Mitigation recommendations ranked by arbitrary effectiveness coefficient (frequency x coverage). After backups, network segmentation and restricting web-based content emerge at the top.
Using this more holistic ranking system, data backup remains at the top, followed by network segmentation and restricting web-based content. After that, application isolation and sandboxing, exploit protection, and privileged account management emerge as the next most effective controls.
Exploring Recommended Mitigations
For all of the convenience of this ranking method, however, some of recommendations in the ATT&CK framework are very broad and can take on many different forms. In addition, some controls that emerged with slightly lower rankings are more important than the tables make them look, given the broader context and some observations from breach data models used earlier. The following sections explore the recommended mitigations in greater detail.
Data Backup
With ransomware as common as it is, backing up data needs to be part of every organization’s strategy. However, this control objective can be implemented well or poorly, and it is often difficult to assess the robustness of a backup program until it is tested. Many good backup programs employ several different modes, with longer-term backups air-gapped, stored on physical media off-site, or using other similar degrees of protection. Keep in mind that backups are also useful in the event of a natural disaster as well as ransomware, so a production-ready backup outside of your region might be a good idea.
However, beginning in 2020, ransomware strategies evolved to exfiltrate data before triggering encryption, which reduces the power that even good backups have to completely control ransomware risk. Sure, with the right backups you can restore operations once you clean up your environment, but the data is gone and you still have to deal with the attacker and ransom in one form or another. As a result, the top billing that data backup receives according to the ATT&CK framework is valid, but doesn’t tell the whole story. A robust ransomware strategy needs to start with backing up but can’t end there. The preceding attacker behaviors, the methods of initial access, lateral movement, execution, persistence and exfiltration need to be controlled as well.
Application Isolation and Sandboxing
This primarily takes the form of various forms of virtualization, such as VMs, containers, and browser sandboxing. This type of control can help mitigate a number of exploit-based approaches observed in 2021, including Exploitation for Client Execution, Exploit Public-Facing Application, and Drive-by Compromise.
Exploit Protection
The most obvious form of exploit protection is the use of a web application firewall (WAF). Despite the declining prevalence of web exploits in the data, a WAF is still critical for operating a modern web application. It is also a requirement for the Payment Card Industry Data Security Standard (PCI-DSS), which applies specifically to one data type—credit card numbers—that has been so heavily targeted by formjacking attacks. A growing number of behavioral approaches to exploit protection also appear promising.
Network Segmentation
Network segmentation is perhaps the most underrated control in this list, given how ransomware approaches have changed the threat landscape since the pandemic began. This control objective can shut down a huge number of attack vectors, five of which were observed in the 2021 data: Exploit Public-Facing Application, Automated Exfiltration, Exfiltration Over Web Service, External Remote Services, and Exploitation of Remote Services.
Furthermore, since it is suspected that a large number of additional techniques went unreported in the examined breaches, particularly for ransomware and other malware attacks, network segmentation is important because it makes exfiltration and lateral movement particularly difficult. Architectural and consumption trends, such as digital transformation, may make segmented networks seem like a vestige from an earlier phase of on-premises computing, but this practice is more important than ever for the bulk of organizations. Some truly cloud-native applications may have implemented all of the same control objectives using identity and access management, and in these specific cases this control may not apply. But this is still an important approach for organizations with hybrid environments or legacy applications in the process of moving to the cloud.
Privileged Account Management
Managing credentials and identities for high-impact roles like administrators remains a core part of modern systems management. While creating privileged accounts is straightforward, deleting them is often overlooked, so privileged accounts should be audited regularly to ensure that they are decommissioned when no longer needed.
Update Software
This is a large topic, and one that the ATT&CK framework covers only briefly. However, the Log4Shell campaign that unfolded in late December 2021 reminds us of the importance of maintaining software, not merely the software organizations produce or use but all of the subcomponents and libraries necessary to keep everything running. Despite the comparatively low ranking here, updating software (and really all vulnerability management) must be a cornerstone of any contemporary security program.
Vulnerability Scanning
Vulnerability scanning is a core requirement for adding situational awareness and flexibility to a vulnerability management program. Organizations should scan regularly, preferably daily, and include both a public-facing scan from the Internet to assess how an environment appears to attackers as well as an internal scan to know the real scale of the problem.
Code Signing
Code signing is highlighted here despite its comparatively low ranking in the recommended controls because F5 Labs believes it is an underused approach. In particular, subresource integrity (SRI) headers can ensure that external scripts haven’t been modified when they are called at runtime. As more and more applications rely on external scripts to pull in new features, SRI is a powerful tool for shutting down a large number of vectors, including many of the initial access techniques seen in formjacking and Magecart attacks.8
Occasionally objections to SRI arise based on the fact that it can cause a feature to break. If the developer of the external script updates the code, the checksum will naturally fail, the application won’t load the script, and the feature will not function. However, security researcher Troy Hunt points out that scripts that are hosted at URIs with a version number in the path (his own example is https://cdn.report-uri[.]com/libs/report-uri-js/1.0.1/report-uri-js.min.js) won’t fall prey to this failure mode because when the script owner changes the script, the new script will be hosted at an entirely new path.9 While the downstream consumer of that script would need to change their source to update the script they’re calling at runtime, the feature in the application won’t break in the meantime—so SRI really is a powerful, free control for managing third-party subapplication dependencies. Owners of scripts that other applications consume should structure their servers to include version numbers as part of the path so that their consumers can use SRI to the maximum advantage.
Restrict Web-Based Content
This is a broad-reaching control objective that can manifest in many different ways, but all of them center on controlling avenues for both unauthorized access and exfiltration, such as blocking specific file types, known malicious IP addresses, external scripts, and the like. This approach has the potential to shut off a wide range of attack vectors, including malicious script injection, phishing, and “malvertising.”10
As with SRI in code signing, Content Security Policies (CSPs) appear underused for such a powerful and free control for restricting web content. In August 2021, F5 Labs ran a scan of the Tranco top 1 million sites that collected information about TLS implementation for the 2021 TLS Telemetry Report. This scan also collected HTTP response headers, which provides the opportunity to assess how organizations use CSP. 6.17% of sites had a CSP header in the server response. The most frequent directive in those CSPs was upgrade-insecure-requests, which ensures that cross-site requests travel over HTTPS (see Figure 23). Upgrade-insecure-requests showed up in about 2.5% of sites, followed closely by frame-ancestors. Several other elements that are more frequent vectors for injecting malicious scripts, such as script-src, img-src, and frame-src, are less common in CSPs.
While these directives aren’t a “wrong” way to use CSPs, both the limited implementation of CSPs at all and the choice of directives indicate that CSPs are underutilized as a way to prevent injection of malicious scripts, especially since CSP is free and already bundled into all modern browsers.
Network Intrusion Prevention
Network intrusion prevention systems are no longer the leading-edge controls they were a decade or more ago, but as lateral movement and deployment of malware appear to be on the rise, this kind of control is valuable as part of a defense-in-depth approach that also uses a WAF and other controls.
Antivirus/Antimalware
The dramatic expansion of malware’s role in data breaches over the last few years means that every type of organization should have antimalware capabilities. However, similarly to data backup as a ransomware strategy, this must not be the only control against malware, and it needs to exist in a more holistic strategy.
Disable or Remove Feature or Program
This recommendation is included here because of its coverage more than its frequency. While it was observed in only 12% of attack chains, disabling or removing features or programs would mitigate five observed techniques in the 2021 data: Command and Scripting Interpreter, Exfiltration Over Web Service, External Remote Services, Exploitation of Remote Services, and Cloud Instance Metadata API. Furthermore, as both applications and environments grow in complexity, it can be easy to forget the old hardening practices. If nothing else, the Log4Shell events in December 2021 remind us that zero trust and least privilege (/content/f5-labs-v2/en/labs/articles/learning-center/what-is-the-principle-of-least-privilege-and-why-is-it-important.html) need to apply to systems as well as people.
Special Mention: Cloud Configuration Management
Hopefully, it is clear that running applications in the cloud requires extra attention to configuration. Both AWS and Azure offer tools and voluminous guidance for configuring cloud systems. The key, it seems, is recognizing that cloud computing is neither turnkey nor just like on-premises. It is its own paradigm, and the absence of configuration management or change management structures from on-premises days does not obviate the need for a corresponding structure in the cloud. The necessary virtualization layers and growing ecosystem for automation and orchestration mean that even dynamic environments full of ephemeral resources can be properly managed—as long as organizations recognize the new paradigm as truly new and build these management structures and processes from the ground up, instead of trying to translate the old approach. Guides and information for cloud configuration management are plentiful for all public clouds. Organizations running customer-facing applications in the cloud should treat these guides as doctrine.
Ransomware in Retrospect
The 2021 Application Protection Report hypothesized about the meaning of the ransomware explosion, and while some of the ramifications of that thinking have materialized, some have not. A review of the fundamental findings from 2021 is useful before reevaluating that hypothesis:
- Malware incidences in data breaches continued to increase, constituting 6.6% of known U.S. breach causes in 2019, 17.4% in 2020, and 30.1% in 2021.
- While ransomware events continued to grow in frequency, nonencrypting malware grew even more rapidly.
- Both malware strategies made heavy use of exfiltration methods to remove data from victims’ environments.
- Web exploits for cybercrime declined in prevalence, dropping from 18.9% of known breach causes in 2019 to 14.4% in 2020 and 10.4% in 2021. Formjacking attacks like Magecart continued to constitute the bulk of web exploits that led to breach disclosures.
- The retail industry continued to bear the brunt of formjacking attacks, although other subsectors, such as professional organizations, also saw formjacking attacks against payment processing functions.
- Access attacks, that is, attacks against user-facing authentication surfaces, were the single most frequent cause of breaches.
- High rates of business email compromise (24% of all breaches) combined with low reporting rates of credential stuffing and phishing attacks led us to hypothesize that these attacks are difficult to detect and/or are underreported—not that credential stuffing or phishing are low-grade threats.
- Cloud breaches occurred most frequently through misconfigurations, although the risk of third-party breaches materializing for cloud customers was significant as well.
- More traditional attack vectors, such as web exploitation or credential stuffing attacks, were also common against cloud systems—more or less all on-premises attack vectors applied to the cloud as well.
Last year’s hypothesis was that attackers were adopting ransomware strategies because it represented a short and direct path to monetizing nonfinancial data. Rather than going through the effort of enriching stolen data for digital fraud, attackers began to use encryption to sell stolen data back to the victims instead. In short, it appeared that ransomware was a monetization strategy driving a malware strategy, not the other way around.
The implication of this hypothesis was that ransomware would continue to grow at the expense of other monetization paths, and that the only kinds of victims who wouldn’t experience this kind of attack would be those that had an even more direct and lucrative attack: formjacking against retail targets.
In some respects, these hypothetical ramifications materialized. Ransomware attacks against nearly all kinds of organizations have continued to increase, and formjacking, though limited in scope, remains the clearest, most focused pattern of target attributes and attack techniques in the data. However, the growth of exfiltration via malware with no ransom and no encryption indicates the old hypothesis wasn’t completely right. What do these new findings mean for the future of malware and cyberattacks?
Based on what is known about the cybercriminal community, the evolution of preferred TTPs, and the state of the digital fraud ecosystem, this year’s findings make a statement about the resilience of the demand for data for fraud, and not about certain TTPs working more reliably than others. As ransomware-as-a-service offerings have proliferated, it seems unlikely that an attacker who can gain a foothold, execute malware, and exfiltrate data would be unable to encrypt data. Instead, malware strategies appear to be bifurcating along disparate monetization paths. Some threat actors choose to exfiltrate data and sell it for fraud purposes; others prefer to ransom data back to victims. In both cases, monetization strategies are driving TTPs, as they usually do for criminal threat actors. The miscalculation in the 2021 hypothesis was underestimating the strength and resilience of the market for stolen data.
It is also the case that law enforcement agencies and governments around the world have taken action against ransomware operations and have, in some cases, dismantled their command-and-control networks. This could have either caused threat actors to return to fraud monetization paths or provided opportunities to other threat actors who never had a ransomware infrastructure. In either case, the security industry should also acknowledge the effect of its own behaviors on its adversaries. For this reason, the comparative decline in web exploits in general, and formjacking in particular, is a sign that attackers are adapting to controls, not a sign that web attacks are going away. This dialectic of attack and defense, the way security teams’ work affects that of their adversaries, is perhaps the most reliable force in cybersecurity after money, and one whose next turn F5 Labs will document in 2023.
Acknowledgements
The authors would like to thank the F5 Labs team, past and present: Ray Pompon, Sara Boddy, Malcolm Heath, Debbie Walkowski, David Warburton, Jesse Smith, and Shahnawaz Backer. Dan Woods and Eileen Laitinen, also of F5, provided valuable expertise and feedback. We would also like to acknowledge David Sjöberg (@davsjob) for his work on the ggsankey library used to generate the attack chain diagrams (https://openprojectrepo.com/project/davidsjoberg-ggsankey-python-data-validation).