
The Sensor Intel Series is created in partnership with Efflux, who maintains a globally distributed network of sensors from which we derive attack telemetry.
Introduction
Welcome back to the Sensor Intelligence Series, our recurring monthly summary of vulnerability intelligence based on distributed passive sensor data. It’s a little bit surprising to realize that we’ve been publishing this series since August of 2022. In honor of that, and since it’s the end of the year as far as our available data goes, we’ll spend a little time zooming way out and looking at what the most common type of scanning traffic we saw across all of 2023.
But first, let’s look at the new things we’ve found, and what the overall picture looks like for December 2023.
Six New CVEs in the Data
This month, we found evidence of six more CVEs in our data. That’s a lot more than we have generally found in a single month, which is at least somewhat down to some new techniques we’re using to sift through this data more efficiently. We decided it might be better to split these out into a bullet list for easier reading:
- CVE-2015-8813 – A SSRF vector in the url parameter of the Umbraco web content management system.
- CVE-2019-12987 and CVE-2019-12988 – Remote, unauthenticated command injection vulnerabilities in the Citrix SD-WAN Center.
- CVE-2021-23394 – A remote, unauthenticated code execution vulnerability in the Studio-42 elFinder open-source file manager.
- CVE-2022-21587 – A remote, unauthenticated arbitrary file upload vulnerability in Oracle E-Business Suite (EBS)
- CVE-2022-26134 – A OGNL injection vulnerability in Confluence Server and Confluence Data Center.
As is usual, these are all remote, unauthenticated vulnerabilities that allow for code execution and related means to gain access to compute resources on the targets, which makes sense for the sort of scanning we see.
December Vulnerabilities by the Numbers
Figure 1 shows the traffic for the top 10 CVEs in December. CVE-2022-24847, an RCE in the open-source GeoServer software, and CVE-2022-22947, an RCE in the Spring Cloud Gateway product, continue to hold the top two spots as they did in November. CVE-2020-11625, a vulnerability in AvertX Cameras that allows for username enumeration, continued rising from last month, and ends up in the third position. CVE-2020-8958, a Guangzhou router command injection vulnerability, has thus continued to fall in position, as it did last month and the month before that. October’s top seen vulnerability, CVE-2017-9841, an RCE in PHPUnit, now 5 years old, comes in fifth this month. Overall traffic in the CVEs we track dropped again as it did in November, although not by very much.
Table 1 shows traffic for December, change in traffic from November, CVSS v3.x score, and EPSS scores for the CVEs and other vulnerabilities we’re tracking, if they showed up in the last two months.
| CVE Number | December Traffic | Change from November | CVSS v3.x | EPSS Score |
| CVE-2022-24847 | 2439 | 34 | 7.2 | 0.00098 |
| CVE-2022-22947 | 2131 | 129 | 10 | 0.97494 |
| CVE-2020-11625 | 1620 | 0 | 5.3 | 0.00126 |
| CVE-2020-8958 | 1383 | -397 | 7.2 | 0.74227 |
| CVE-2017-9841 | 1361 | -378 | 9.8 | 0.97484 |
| CVE-2022-42475 | 1197 | -27 | 9.8 | 0.38376 |
| CVE-2022-41040 | 1133 | -250 | 9.8 | 0.95098 |
| CVE-2020-0618 | 523 | 63 | 8.8 | 0.97407 |
| CVE-2021-28481 | 269 | -95 | 9.8 | 0.04508 |
| CVE-2021-40539 | 263 | 88 | 9.8 | 0.97412 |
| CVE-2014-2908 | 249 | -15 | NA | 0.00594 |
| Citrix XML Buffer Overflow | 249 | -15 | NA | |
| CVE-2019-18935 | 173 | -4 | 9.8 | 0.94618 |
| 2018 JAWS Web Server Vuln | 135 | -588 | NA | |
| CVE-2021-26855 | 132 | -157 | 9.8 | 0.97486 |
| CVE-2021-44228 | 104 | 60 | 10 | 0.97454 |
| CVE-2020-25078 | 85 | 83 | 7.5 | 0.80702 |
| CVE-2021-26084 | 80 | 65 | 9.8 | 0.97235 |
| CVE-2021-26086 | 59 | 12 | 5.3 | 0.54993 |
| CVE-2018-13379 | 46 | -147 | 9.8 | 0.97305 |
| CVE-2018-10561 | 29 | -42 | 9.8 | 0.97166 |
| CVE-2021-22986 | 0 | -5 | 9.8 | 0.97435 |
| CVE-2022-1388 | 28 | 15 | 9.8 | 0.97334 |
| CVE-2017-18368 | 26 | 11 | 9.8 | 0.97521 |
| CVE-2021-3129 | 26 | -4 | 9.8 | 0.97482 |
| CVE-2019-9082 | 24 | 11 | 8.8 | 0.97454 |
| CVE-2017-1000226 | 23 | -19 | 5.3 | 0.00127 |
| CVE-2014-2321 | 19 | 17 | NA | 0.96364 |
| CVE-2022-21587 | 19 | 17 | 9.8 | 0.96538 |
| NETGEAR-MOZI | 18 | -31 | NA | |
| CVE-2020-25213 | 15 | -17 | 9.8 | 0.97381 |
| CVE-2018-9995 | 13 | -17 | 9.8 | 0.92532 |
| CVE-2022-22965 | 11 | -6 | 9.8 | 0.97424 |
| CVE-2020-9757 | 9 | 3 | 9.8 | 0.96928 |
| CVE-2022-26134 | 9 | 5 | 9.8 | 0.97523 |
| CVE-2022-40684 | 8 | -41 | 9.8 | 0.95976 |
| CVE-2020-17496 | 7 | -9 | 9.8 | 0.97413 |
| CVE-2018-20062 | 5 | 5 | 9.8 | 0.96823 |
| CVE-2020-3452 | 5 | 0 | 7.5 | 0.97529 |
| CVE-2018-17246 | 4 | 1 | 9.8 | 0.96827 |
| CVE-2018-7600 | 4 | 2 | 9.8 | 0.9756 |
| CVE-2019-12725 | 4 | -4 | 9.8 | 0.9634 |
| CVE-2019-9670 | 4 | 4 | 9.8 | 0.97216 |
| CVE-2021-21985 | 4 | 2 | 9.8 | 0.9738 |
| CVE-2008-2052 | 3 | 3 | NA | 0.00151 |
| CVE-2018-7700 | 3 | 3 | 8.8 | 0.73235 |
| CVE-2015-3897 | 2 | 2 | NA | 0.83225 |
| CVE-2020-17506 | 2 | 1 | 9.8 | 0.96414 |
| CVE-2020-25506 | 2 | 2 | 9.8 | 0.97424 |
| CVE-2020-7961 | 2 | -2 | 9.8 | 0.97342 |
| CVE-2021-29203 | 2 | -2 | 9.8 | 0.95733 |
| CVE-2021-33564 | 2 | -2 | 9.8 | 0.07998 |
| CVE-2021-41277 | 2 | 2 | 10 | 0.06768 |
| CVE-2023–25157 | 2 | 0 | 9.8 | |
| CVE-2008-6668 | 1 | 1 | NA | 0.00359 |
| CVE-2012-4940 | 1 | 1 | NA | 0.14071 |
| CVE-2015-8813 | 1 | 1 | 8.2 | 0.00511 |
| CVE-2017-0929 | 1 | 1 | 7.5 | 0.00753 |
| CVE-2017-11511 | 1 | 0 | 7.5 | 0.3318 |
| CVE-2017-11512 | 1 | 0 | 7.5 | 0.97175 |
| CVE-2017-17731 | 1 | -1 | 9.8 | 0.11468 |
| CVE-2017-9506 | 1 | 1 | 6.1 | 0.00575 |
| CVE-2018-1000600 | 1 | 1 | 8.8 | 0.95625 |
| CVE-2018-18775 | 1 | 1 | 6.1 | 0.00157 |
| CVE-2019-12987 | 1 | 1 | 9.8 | 0.97297 |
| CVE-2019-12988 | 1 | 1 | 9.8 | 0.97297 |
| CVE-2019-2767 | 1 | 1 | 7.2 | 0.14972 |
| CVE-2019-8982 | 1 | -1 | 9.8 | 0.02146 |
| CVE-2020-13167 | 1 | 0 | 9.8 | 0.97405 |
| CVE-2020-15505 | 1 | 0 | 9.8 | 0.97516 |
| CVE-2020-17505 | 1 | 1 | 8.8 | 0.96502 |
| CVE-2020-28188 | 1 | 1 | 9.8 | 0.97279 |
| CVE-2020-7796 | 1 | 1 | 9.8 | 0.72496 |
| CVE-2021-20167 | 1 | 1 | 8 | 0.94785 |
| CVE-2021-21315 | 1 | 1 | 7.8 | 0.96949 |
| CVE-2021-23394 | 1 | -1 | 9.8 | 0.01541 |
| CVE-2021-25369 | 1 | -1 | 6.2 | 0.00118 |
| CVE-2021-31589 | 1 | 1 | 6.1 | 0.00286 |
| CVE-2021-32172 | 1 | -1 | 9.8 | 0.26253 |
| CVE-2021-33357 | 1 | 1 | 9.8 | 0.96582 |
| CVE-2021-3577 | 1 | 1 | 8.8 | 0.96865 |
| CVE-2022-1040 | 1 | -1 | 9.8 | 0.97031 |
| CVE-2022-35914 | 1 | -1 | 9.8 | 0.96852 |
Table 1. December traffic, change from November, CVSS and EPSS scores for tracked vulnerabilitiies.
Targeting Trends
To better assess rapid changes in attack traffic, Figure 2 shows a bump plot, which plots both traffic volume and changes in rank. The 12 CVEs (with one category combining two difficult to distinguish CVEs, CVE-2022-41040 and CVE-2021-34473) shown here represent the top five for each of the twelve months. Notable in this month’s plot, as previously mentioned, is the rise of both CVE-2022-24847 and CVE-2022-22947 over the last two months.
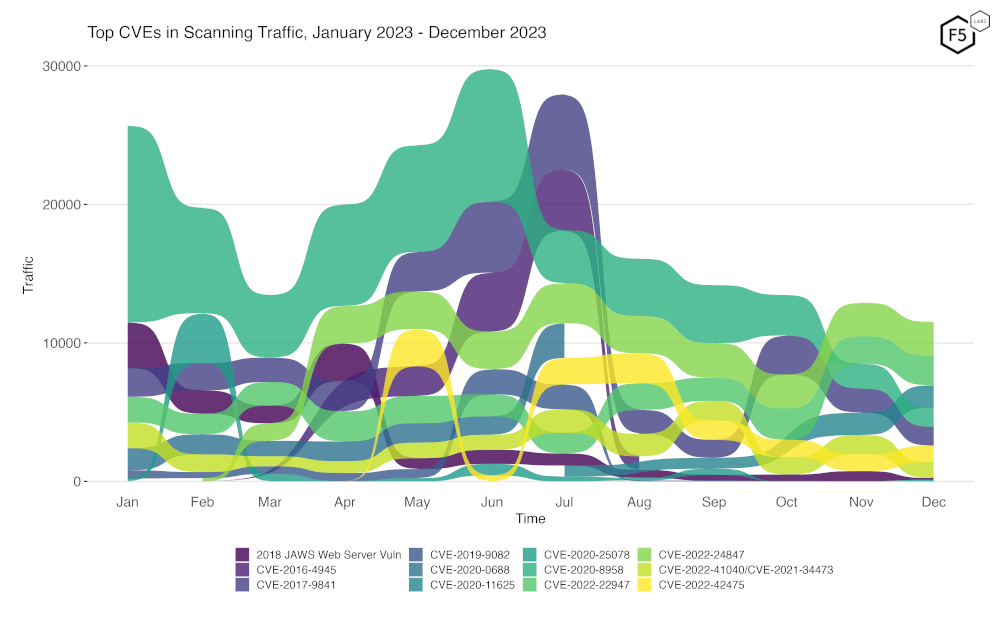
Figure 2. Evolution of vulnerability targeting trends over previous twelve months. There has been a notable increase in CVE-2022-24847 and CVE-2022-22947 over the last two months.
Overall Scanning Traffic Changes
We now look at the overall level of scan traffic we received, to place the above data in context. December saw a decline in total traffic of 5.8% from November, in part attributable to the decrease in scanning for CVE-2016-4945 and CVE-2020-8958.
The full details of the changes in scanning traffic over the last 12 months are shown in the following table.
| Month | % change from previous month |
| Jan-23 | 5.6% |
| Feb-23 | -15.5% |
| Mar-23 | -22.4% |
| Apr-23 | 37.3% |
| May-23 | -0.9% |
| Jun-23 | -0.3% |
| Jul-23 | 20.1% |
| Aug-23 | -27.9% |
| Sep-23 | 5.1% |
| Oct-23 | -5.8% |
| Nov-23 | -0.2% |
| Dec-23 | -5.8% |
Table 2: Percentage change of overall scanning traffic from January 2023 to December 2023
Long Term Trends
Because Figure 2 only shows high-traffic CVEs, Figure 3 shows traffic for all the CVEs and vulnerabilities we have tracked.
As can be seen below, none of the CVEs and vulnerabilities we’re currently tracking fell off steeply or rose steeply in December, assuming they were present at all in the December data.
25 CVEs which had not appeared in the data for months reappeared this month, which is more than is usually seen.
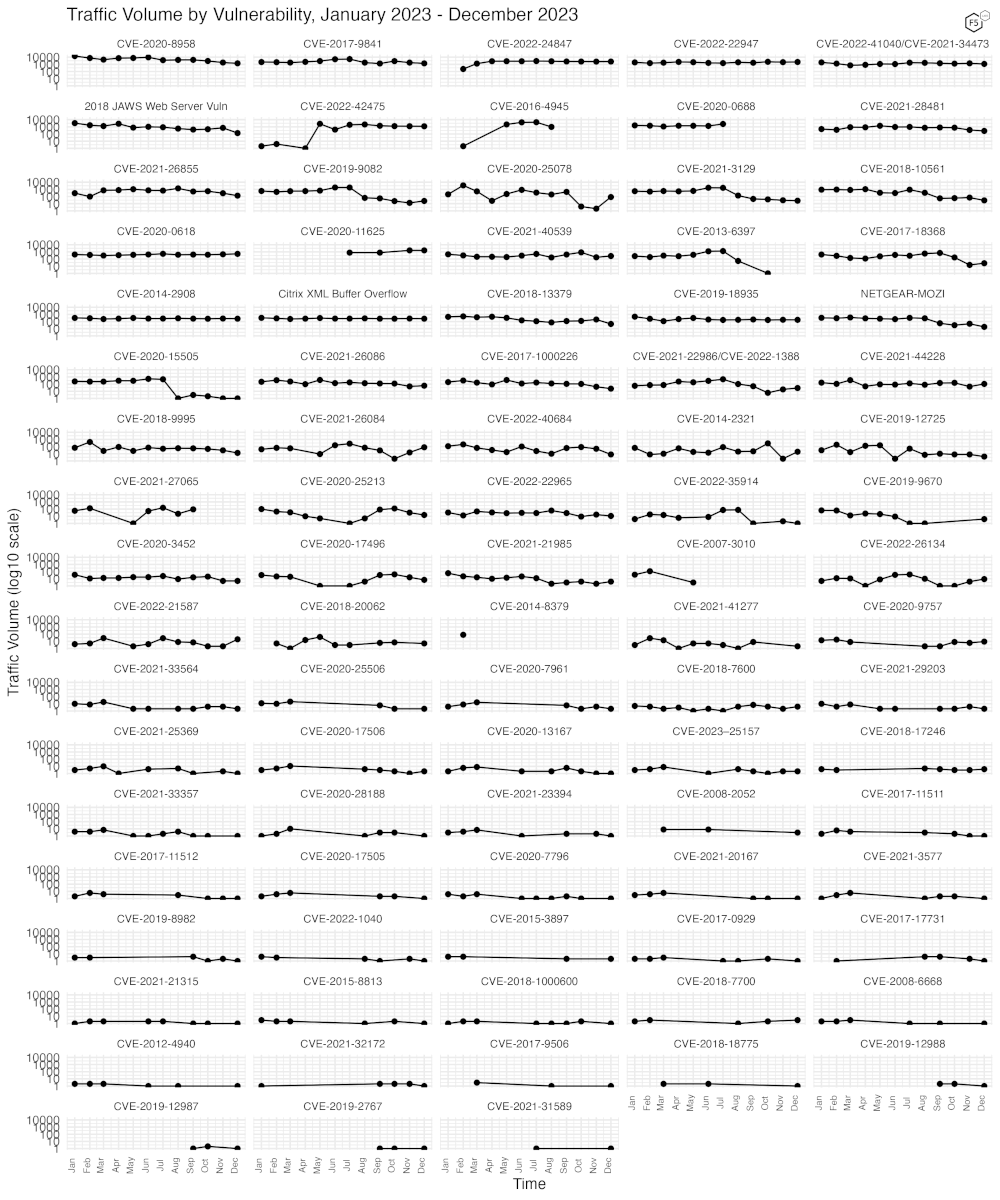
Figure 3. Traffic volume for the last twelve months for 88 tracked CVEs and vulnerabilities.
Zooming Out to Look at 2023
One of the questions we frequently get asked about this data is about attribution, that is, who is doing the scanning. This is a difficult question, because it is quite well understood that many threat actors take great pains to do at least a bit of obfuscation of their activities, and in a situation like this may very well chose to use proxy networks or cloud providers to conceal the origins of their scanning.
However, there are some interesting details that emerge when looking at the entirety of the scan data we have from 2023. In terms of “top talkers” by ASN, we find the following.
| Source ASN | Source Country | % of total traffic in 2023 |
| 202306 | Russia | 7.27% |
| 196645 | Ukraine | 4.97% |
| 14061 | United States | 4.63% |
| 14061 | Canada | 3.54% |
| 14061 | Singapore | 2.83% |
| 6939 | United States | 2.58% |
| 16276 | France | 2.57% |
| 63949 | United States | 2.32% |
| 16276 | Canada | 2.10% |
| 14618 | United States | 1.90% |
Table 3: Top ten ASNs by percent of total 2023 traffic observed. Note that ASNs from the USA compromise 11.3% of the total scanning traffic observed world-wide.
ASN 202306 is assigned to HostGlobal.Plus Ltd, a hosting company, and 196645 is Hostpro Lab LLC, another hosting company. 14061 is Digital Ocean, and 6939 is Hurricane Electric, LLC. Even a quick look at this data seems to indicate that most scanning traffic is generated out of hosting provider networks at least in our dataset.
There may be several reasons for this. Provisioning VPS infrastructure to perform scanning is relatively easy and can be done on many hosting providers using false information for the account. Further, it is less likely that targets will wish to block large ranges of hosting provider IP space as this might lead to the blocking of legitimate sites.
It’s important to note that even though in the above table 7.27% of all the scanning traffic we observed in 2023 originated from IPs geolocated to Russia, this does not mean that this is evidence of Russian state sponsored activity, only that this hosting provider (which has IP space in both Russia and the UK) has been used by some set of scanners to provide their infrastructure.
Digging in further, we can see that the scans originating from ASN202306 have a relativel small set of target URLs, the top 20 of which are shown below.
| Scanned URL | % of observed traffic from ASN 202306 |
| /.env | 12.0% |
| /.aws/credentials | 11.5% |
| /.aws/config | 11.3% |
| /aws/credentials | 11.1% |
| /test.php | 8.2% |
| /phpinfo | 8.0% |
| /credentials | 6.6% |
| /_profiler/phpinfo | 4.3% |
| /phpinfo.php | 4.3% |
| /info.php | 4.2% |
| /laravel/.env | 3.7% |
| /demo/.env | 3.7% |
| /web/.env | 3.7% |
| /admin/.env | 1.4% |
| /backend/.env | 1.4% |
| /app/.env | 1.4% |
| /admin/config.php | 0.6% |
| /.env.local | 0.4% |
| /.env.backup | 0.4% |
| /.env.save | 0.4% |
Table 4: URLs scanned by ASN 202306 by percent of overall traffic scanned by that ASN
As can be seen above, the scanning from the most active ASN in our data is almost entirely concerned with finding leaked credentials and other sensitive data.
Conclusions
We again reiterate that our sensors are passive, and they do not respond to requests, nor do they pretend to be any specific platform or software stack. They are simply an open socket on port 80 and 443, with just enough of a webserver to be able to record the requests made to them and negotiate any required TLS connection. They do not have DNS names, although it’s certainly possible they may once have had them. Sometimes IP blocks are reassigned, and old DNS records remain that continue to point to them.
As we noted above, attribution is a somewhat difficult question. We certainly can tell where the majority of scanning activity comes from, but only at the level of IP and associated ASN, which is not enough to make a connection to a specific group, especially as the majority of scanning traffic we observe originates from large hosting providers.
For those new to the Sensor Intelligence Series, we will conclude by repeating some old but valid observations. We see a continuing focus on IoT and router vulnerabilities, as well as easy, essentially one-request remote code execution vulnerabilities. These typically result in the installation of malware, crypto miners, and DDoS bots. Additionally, we see continuous scanning activity that might be most accurately described as reconnaissance; the identification of attack surface, exposed files, and other materials that attackers hope to leverage to enable further attacks.
Recommendations
- Scan your environment for vulnerabilities and exposures aggressively.
- Patch high-priority vulnerabilities (defined however suits you) as soon as feasible.
- Engage a DDoS mitigation service to prevent the impact of DDoS on your organization.
- Use a WAF or similar tool to detect and stop web exploits.
- Inventory your exposed applications rigorously, to allow rapid response to emerging vulnerabilities that may be quickly weaponized by threat actors.
- Monitor anomalous outbound traffic to detect devices in your environment that are participating in DDoS attacks.


