
The Sensor Intel Series is created in partnership with Efflux , who maintains a globally distributed network of sensors from which we derive attack telemetry.
----------------------------------------------------------------
Introduction
Welcome back to the Sensor Intelligence Series, our recurring monthly summary of vulnerability intelligence based on distributed passive sensor data. This time, we added a section that briefly discusses some of the most common scanning traffic that is not strictly vulnerability related, to continue to give more context overall.
This month, we found evidence of two more CVEs in our data, specifically CVE-2018-9995, an authentication bypass in TBK DVR devices, and CVE-202-11625, an information disclosure vulnerability in AvertX Night Vision cameras models HD383 and HD438. Neither of these was seen a great deal, however, so they don’t really come into play for the analysis that follows, except as a general note to say that attacker scans targeting IoT devices continues apace.
So, without any further ado, let’s dig into the changes we saw in November for the CVEs we track.
November Vulnerabilities by the Numbers
Figure 1 shows the traffic for the top 10 CVEs in November. CVE-2022-24847, an RCE in the open-source GeoServer software, and CVE-2022-22947, an RCE in the Spring Cloud Gateway product, rose to our top spots. These are nothing new, the latter having been seen in our data at moderately high levels over at least the last year, and the former having been active since February this year. CVE-2020-8958, a Guangzhou router command injection vulnerability, has thus continued to fall in position, as it did last month. Last month’s top seen vulnerability, CVE-2017-9841, an RCE in PHPUnit, now 5 years old, comes in at fourth position. Overall traffic in the CVEs we track dropped again as it did in October.
Table 1 shows traffic for November, change in traffic from October, CVSS v3.x score, and EPSS scores for 70 CVEs and other vulnerabilities. Our list of vulnerabilities with confirmed attack or scanning traffic currently stands at 84, but 11 vulnerabilities saw no traffic in either October or November and so don’t make this table.
| CVE Number | November Traffic | Change from October | CVSS v3.x | EPSS Score |
| CVE-2022-24847 | 2323 | -124 | 7.2 | 0.00098 |
| CVE-2022-22947 | 1917 | -341 | 10 | 0.97487 |
| CVE-2020-8958 | 1780 | -1152 | 7.2 | 0.74227 |
| CVE-2017-9841 | 1673 | -1149 | 9.8 | 0.97484 |
| CVE-2022-41040/CVE-2021-34473 | 1288 | 39 | 9.8 | 0.97344 |
| CVE-2022-42475 | 1182 | -80 | 9.8 | 0.41073 |
| CVE-2020-11625 | 810 | 810 | 5.3 | 0.00126 |
| 2018 JAWS Web Server Vuln | 718 | 252 | NA | |
| CVE-2020-0618 | 460 | 63 | 8.8 | 0.97439 |
| CVE-2021-28481 | 355 | -411 | 9.8 | 0.04321 |
| CVE-2021-26855 | 282 | -276 | 9.8 | 0.9753 |
| Citrix XML Buffer Overflow | 258 | 10 | NA | |
| CVE-2014-2908 | 257 | 12 | NA | 0.00594 |
| CVE-2018-13379 | 191 | 68 | 9.8 | 0.97336 |
| CVE-2019-18935 | 171 | 7 | 9.8 | 0.93967 |
| CVE-2021-40539 | 169 | -690 | 9.8 | 0.97412 |
| CVE-2018-10561 | 67 | 7 | 9.8 | 0.97166 |
| CVE-2022-40684 | 49 | -37 | 9.8 | 0.95639 |
| NETGEAR-MOZI | 49 | 18 | NA | #N/A |
| CVE-2021-26086 | 47 | -70 | 5.3 | 0.54993 |
| CVE-2021-44228 | 44 | -105 | 10 | 0.97454 |
| CVE-2017-1000226 | 42 | -62 | 5.3 | 0.00127 |
| CVE-2020-25213 | 32 | -89 | 9.8 | 0.97336 |
| CVE-2021-3129 | 30 | -10 | 9.8 | 0.97488 |
| CVE-2018-9995 | 28 | -19 | 9.8 | 0.92532 |
| CVE-2021-22986 | 5 | 9 | 9.8 | 0.9748 |
| CVE-2022-1388 | 13 | 5 | 9.8 | 0.97355 |
| CVE-2022-22965 | 17 | 8 | 9.8 | 0.97451 |
| CVE-2020-17496 | 16 | -25 | 9.8 | 0.97449 |
| CVE-2021-26084 | 15 | 13 | 9.8 | 0.97153 |
| CVE-2017-18368 | 14 | -152 | 9.8 | 0.9751 |
| CVE-2019-9082 | 13 | -10 | 8.8 | 0.97454 |
| CVE-2019-12725 | 8 | 0 | 9.8 | 0.96008 |
| CVE-2020-9757 | 6 | -2 | 9.8 | 0.9686 |
| CVE-2020-3452 | 5 | -15 | 7.5 | 0.97529 |
| CVE-2020-7961 | 4 | 2 | 9.8 | 0.97342 |
| CVE-2021-29203 | 4 | 2 | 9.8 | 0.95745 |
| CVE-2021-33564 | 4 | 0 | 9.8 | 0.07998 |
| CVE-2018-17246 | 3 | 0 | 9.8 | 0.96913 |
| CVE-2014-2321 | 2 | -278 | NA | 0.96364 |
| CVE-2017-17731 | 2 | 2 | 9.8 | 0.11468 |
| CVE-2018-7600 | 2 | -2 | 9.8 | 0.9756 |
| CVE-2019-8982 | 2 | 1 | 9.8 | 0.02146 |
| CVE-2020-25078 | 2 | -2 | 7.5 | 0.60091 |
| CVE-2021-21985 | 2 | -2 | 9.8 | 0.9731 |
| CVE-2021-25369 | 2 | 2 | 6.2 | 0.00118 |
| CVE-2021-32172 | 2 | 0 | 9.8 | 0.26193 |
| CVE-2022-1040 | 2 | 2 | 9.8 | 0.97147 |
| CVE-2022-35914 | 2 | 2 | 9.8 | 0.96863 |
| CVE-2023-25157 | 2 | 1 | 9.8 | 0.38671 |
| CVE-2017-11511 | 1 | -1 | 7.5 | 0.3318 |
| CVE-2017-11512 | 1 | 0 | 7.5 | 0.97175 |
| CVE-2020-13167 | 1 | -1 | 9.8 | 0.97419 |
| CVE-2020-15505 | 1 | -1 | 9.8 | 0.97516 |
| CVE-2020-17506 | 1 | -1 | 9.8 | 0.96064 |
| CVE-2013-6397 | 0 | -1 | NA | 0.65428 |
| CVE-2017-0929 | 0 | -2 | 7.5 | 0.00753 |
| CVE-2018-1000600 | 0 | -2 | 8.8 | 0.95625 |
| CVE-2018-20062 | 0 | -7 | 9.8 | 0.96823 |
| CVE-2018-7700 | 0 | -2 | 8.8 | 0.73235 |
| CVE-2019-2767 | 0 | -1 | 7.2 | 0.14972 |
| CVE-2020-17505 | 0 | -2 | 8.8 | 0.96837 |
| CVE-2020-25506 | 0 | -2 | 9.8 | 0.97424 |
| CVE-2020-28188 | 0 | -3 | 9.8 | 0.97284 |
| CVE-2020-7796 | 0 | -1 | 9.8 | 0.72496 |
| CVE-2021-20167 | 0 | -1 | 8 | 0.95492 |
| CVE-2021-21315 | 0 | -1 | 7.8 | 0.96864 |
| CVE-2021-33357 | 0 | -1 | 9.8 | 0.96509 |
| CVE-2021-3577 | 0 | -2 | 8.8 | 0.96855 |
Table 1. November traffic, change from October, CVSS and EPSS scores for 70 CVEs.
Targeting Trends
To better assess rapid changes in attack traffic, Figure 2 shows a bump plot, which plots both traffic volume and changes in rank. The 12 CVEs (with one category combining two difficult to distinguish CVEs, CVE-2022-41040 and CVE-2021-34473) shown here represent the top five for each of the twelve months. Notable in this month’s plot, as previously mentioned, is the rise of both CVE-2022-24847 and CVE-2022-22947.
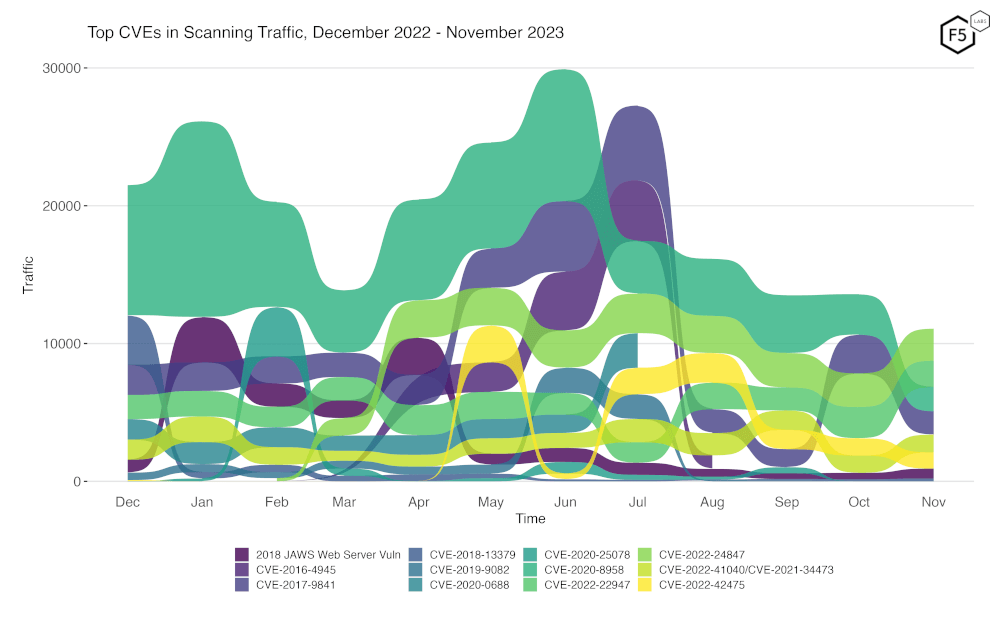
Figure 2. Evolution of vulnerability targeting trends over previous twelve months. There has been a notable increase in CVE-2022-24847 and CVE-2022-22947.
Overall Scanning Traffic Changes
As we started last month, we now look at the overall level of scan traffic we received, to place the above data in context. November saw a very slight decline in total traffic, a mere 0.2%, which can at least in part be attributed to the decrease in scanning for CVE-2020-8958.
The full details of the changes in scanning traffic over the last 12 months are shown in the following table.
| Month | % change from previous month |
| Dec-22 | 1.2% |
| Jan-23 | 5.6% |
| Feb-23 | -15.5% |
| Mar-23 | -22.4% |
| Apr-23 | 37.3% |
| May-23 | -0.9% |
| Jun-23 | -0.3% |
| Jul-23 | 20.1% |
| Aug-23 | -27.9% |
| Sep-23 | 5.1% |
| Oct-23 | -5.8% |
| Nov-23 | -0.2% |
Table 2: Percentage change of overall scanning traffic from December 2022 to November 2023
Long Term Trends
Because Figure 2 only shows high-traffic CVEs, Figure 3 shows traffic for all 84 CVEs we have tracked. In this view, most of our tracked CVEs can be seen to be holding at a relatively steady rate. A few exhibited some more radical changes. CVE-2014-2321 fell to just two events this month, and 9 others (CVE-2018-20062, CVE-2020-25506, CVE-2021-33357, CVE-2020-17505, CVE-2021-20167, CVE-2021-3577, CVE-2020-7796, CVE-2021-21315 and CVE-2018-1000600) all went to zero this month, admittedly from already very low levels.
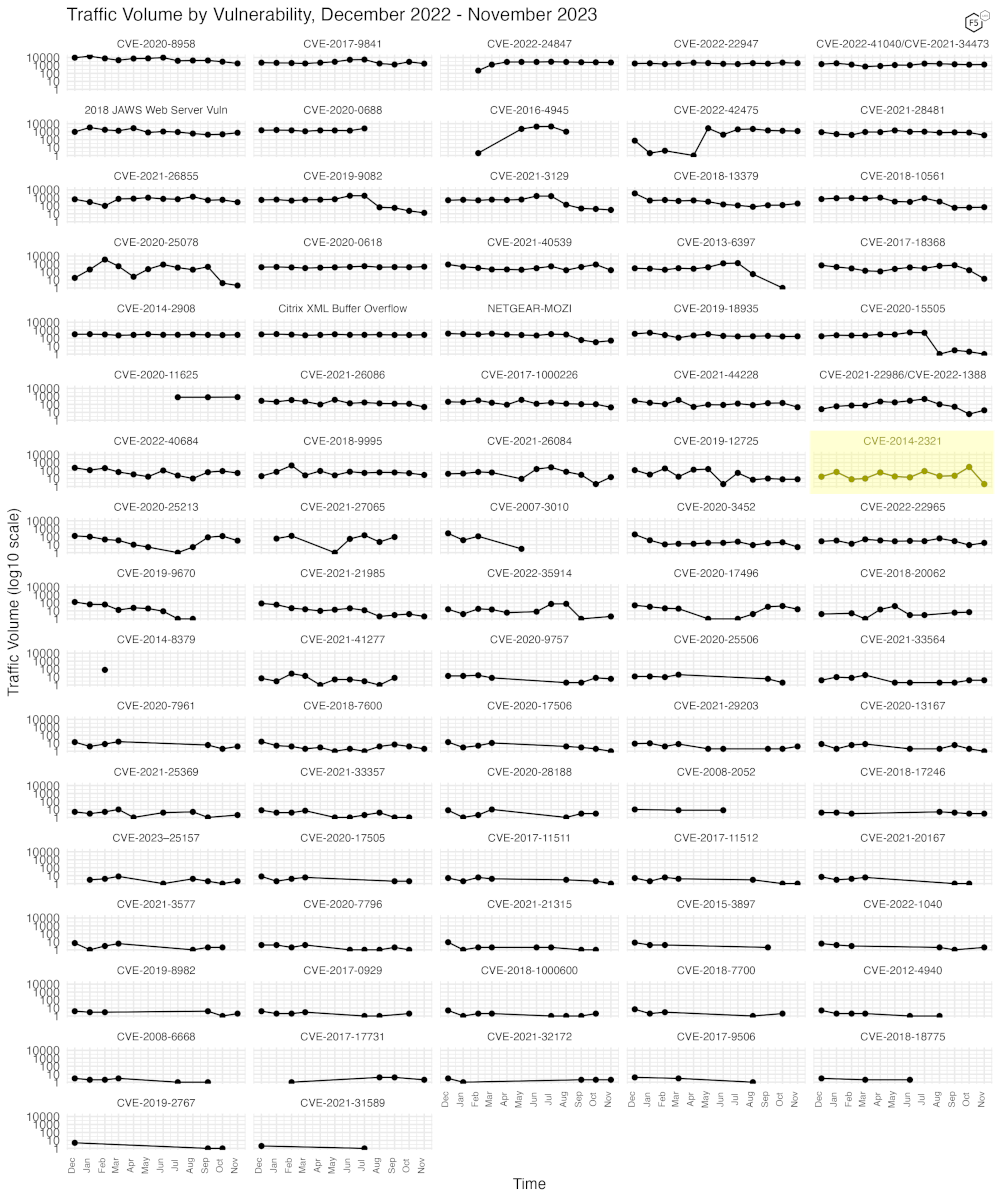
Figure 3. Traffic volume for the last twelve months for 84 tracked CVEs.
Common Non-CVE Traffic
It may be easy to conclude from the above figures that even though overall traffic has held steady, CVE exploitation attempts, at least for the CVEs and vulnerabilities we track, has decreased. That’s true, but there is a great deal of traffic that our sensor network sees that is not reflected in the above data. To give a more comprehensive picture, we can note that of the overall traffic in November 2023, approximately 35% of the total traffic was composed of scans attempting to find unsecured files that might contain credentials (such as “/.env” or “/.aws/credentials”), and approximately 9% of the total were scans for PHPMyAdmin web interfaces exposed to the internet, likely as a target for credential stuffing.
We hope to dig further into non-CVE traffic in the future, but until then, take this as a clear message from attackers – it’s not simply CVEs you need to be concerned with. It’s your entire attack surface, which includes files and services incorrectly exposed to the internet.
Conclusions
We again reiterate that our sensors are passive, and they do not respond to requests, nor do they pretend to be any specific platform or software stack. They are simply an open socket on port 80 and 443, with just enough of a webserver to be able to record the requests made to them and negotiate any required TLS connection. They do not have DNS names, although it’s certainly possible they may once have had them. Sometimes IP blocks are reassigned, and old DNS records remain that continue to point to them.
For those new to the Sensor Intelligence Series, we will conclude by repeating some old but valid observations. We see a continuing focus on IoT and router vulnerabilities, as well as easy, essentially one-request remote code execution vulnerabilities. These typically result in the installation of malware, crypto miners, and DDoS bots. Additionally, past CVEs, we see continuous scanning activity that might be most accurately described as reconnaissance; the identification of attack surface, exposed files, and other materials that attackers hope to leverage to enable further attacks. See you in January for our final Sensor Intel Series report covering 2023!
Recommendations
- Scan your environment for vulnerabilities and exposures aggressively.
- Patch high-priority vulnerabilities (defined however suits you) as soon as feasible.
- Engage a DDoS mitigation service to prevent the impact of DDoS on your organization.
- Use a WAF or similar tool to detect and stop web exploits.
- Inventory your exposed applications rigorously, to allow rapid response to emerging vulnerabilities that may be quickly weaponized by threat actors.
- Monitor anomalous outbound traffic to detect devices in your environment that are participating in DDoS attacks.


