F5 Labs, in conjunction with our partner Baffin Bay Networks, research global attack traffic region to region to gain a deeper understanding of the cyber threat landscape. Aside from attack campaigns targeting the entire Internet (IPv4 address space), the attack landscape varies regionally in terms of sources, targets, and attack types. In addition, targeted ports expose regional differences in IT norms when it comes to the way non-standard ports are used for HTTP and SSH.
In this latest data collection, we looked at malicious traffic over the same 90-day period—August 1, 2019 through October 31, 2019—in the United States (U.S.), Canada, Latin America, Europe, Russia, Asia, Australia, and Europe. The attack landscape in the U.S. was different from the rest of the regions in that the most malicious traffic came from inside the U.S., making it harder to defend against.
- The top three sources of attack traffic targeting U.S. systems came from IP addresses assigned to Russia, launching a combined 1.885 million normalized count of attack traffic to the region.
- Rounding out the top 10 IP addresses sending malicious traffic to systems in the U.S. were those assigned to Moldova, France, Germany, and the U.S. These 10 IP addresses launched RFB/VNC port 5900 attacks (hitting all regions of the world).
- U.S. systems saw significant malicious traffic directed toward them that originated from inside the country. Approximately 16.1% of all normalized attack traffic (when looking at the top 20 source traffic countries) originated inside the U.S. and targeted American systems. This tactic makes it difficult for enterprises to filter malicious traffic without disrupting use by legitimate users.
- The U.S. saw many application services and remote access ports and services targeted by malicious traffic from August 1 through October 31, 2019. Notably, the U.S. was the only region of the world to see port 45 targeted by attack traffic during this time period.
- The top ports targeted in the U.S. followed similar patterns to the rest of the world, with VNC port 5900 (being attacked in regions all over the world) being the top attacked port. SMB port 445 follows, along with SSH port 22, HTTP port 80, and HTTPS port 443.
Note: “normalized” attack count is not the total attack count collected, it is a calculated number considering the number of attack collection sensors region to region. We use normalized attack data in these reports in order to accurately compare attack data between regions and ensure that no single region is overrepresented in the total data analysis.
Top Source Traffic Countries
Before we look at the top “source traffic countries,” it’s important to clarify that we’re talking about the geographical source of IP addresses in this section. The “top source traffic countries” does not mean that the country itself, individuals, or organizations based in that country were responsible for the malicious traffic. The attack traffic could have been coming through a proxy server or compromised system or IoT device with IP addresses assigned in a particular country. For expediency, we refer to these as “top source traffic countries.”
IP addresses assigned to the U.S. launched the most malicious traffic against systems in the U.S. from August 1, 2019, through October 31, 2019. The top 10 source traffic countries during this period were:
U.S.
Russia
France
South Korea
Netherlands
Republic of Moldova
China
Italy
Germany
Turkey
All of the top 10 were also the top malicious source traffic countries globally.
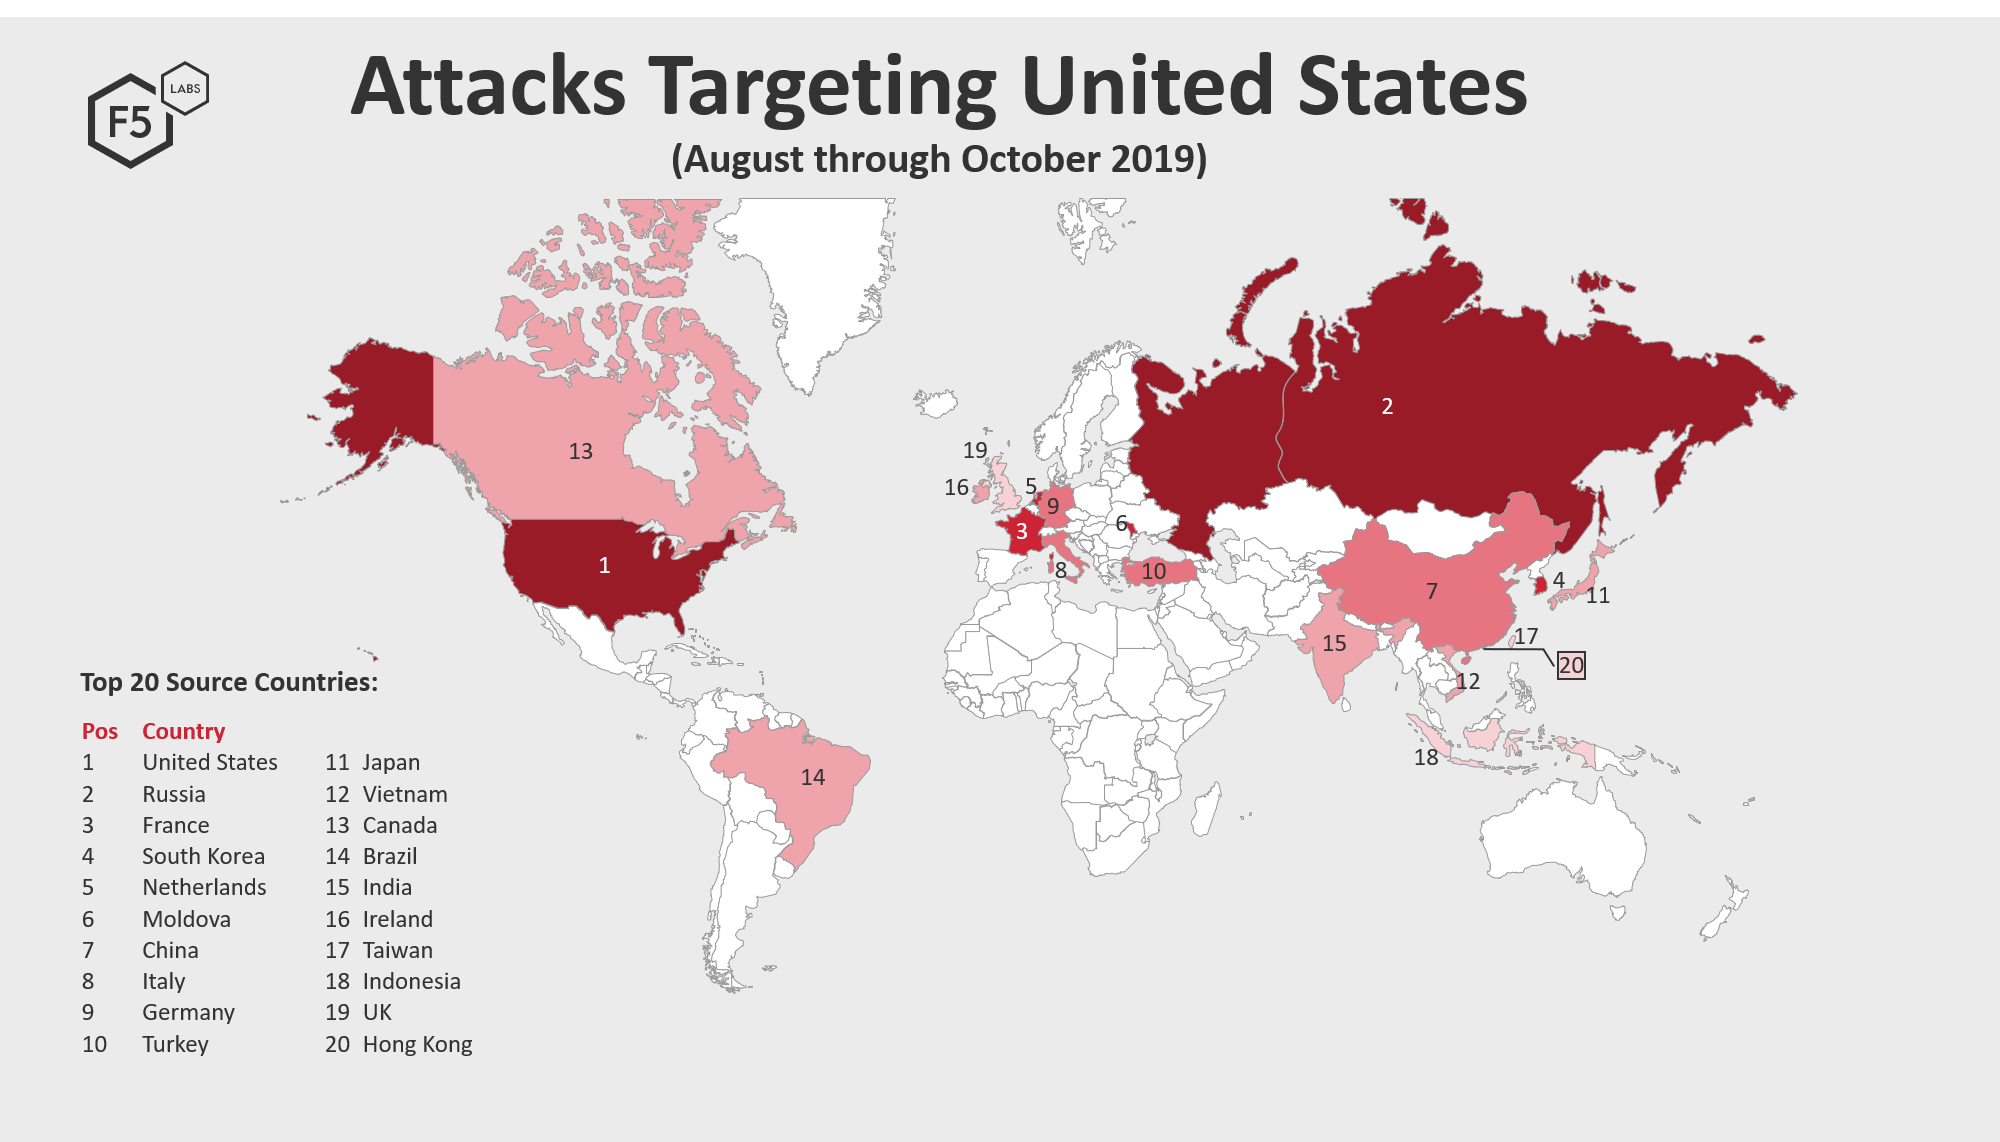
Figure 1. Source traffic countries launching attack traffic against targets in the U.S., August 1, 2019 through October 31, 2019
The majority of malicious traffic launched against U.S. systems came from IP addresses assigned in the U.S. (see Figure 2). These IP addresses accounted for 16.1% of all attack traffic directed towards U.S. systems. This kind of traffic can be more difficult for enterprises to filter since businesses typically want everyone in their country to be able to access them. Twenty IP addresses assigned in the U.S. were in the top attacking IP addresses list.
IP addresses assigned in Russia followed closely, accounting for 15.9% of all malicious traffic directed towards U.S. systems. Both the U.S. and Russia are on the global list of top source traffic countries. IP addresses assigned in both of these countries were seen participating in the RFB/VNC port 5900 port scanning and credential stuffing, targeting all regions of the world.
No countries were seen uniquely targeting the U.S. In fact, of the top 20 attacking countries, all were seen targeting other regions of the world. The most unique attacks came from IP addresses assigned in Ireland, which targeted three regions: Europe, the U.S., and Canada.
Europe, the U.S., and Canada have many similarities in their threat landscapes over this time period, especially when it comes to protocols that were targeted. The U.S. and Canada had a particularly similar geographic attacker landscape. They shared 95% of the same top source traffic countries. They differed in that IP addresses assigned to Hong Kong rank as a top source country targeting the U.S. but not Canada. No IP addresses assigned to Hong Kong were in the top attacking IP addresses list, and only one IP address each from a handful of countries was seen in the top attacking source countries list. In the top attacking IP addresses list, one IP address assigned to Ireland launched a normalized 121,000 attacks. This means attacks coming from IP addresses assigned in Ireland were more distributed, having been launched from many IP addresses at a low number of attacks per IP address. This type of activity is deliberate and takes more resources (systems and manpower) to pull off, and therefore typically is attributed to more sophisticated threat actors.
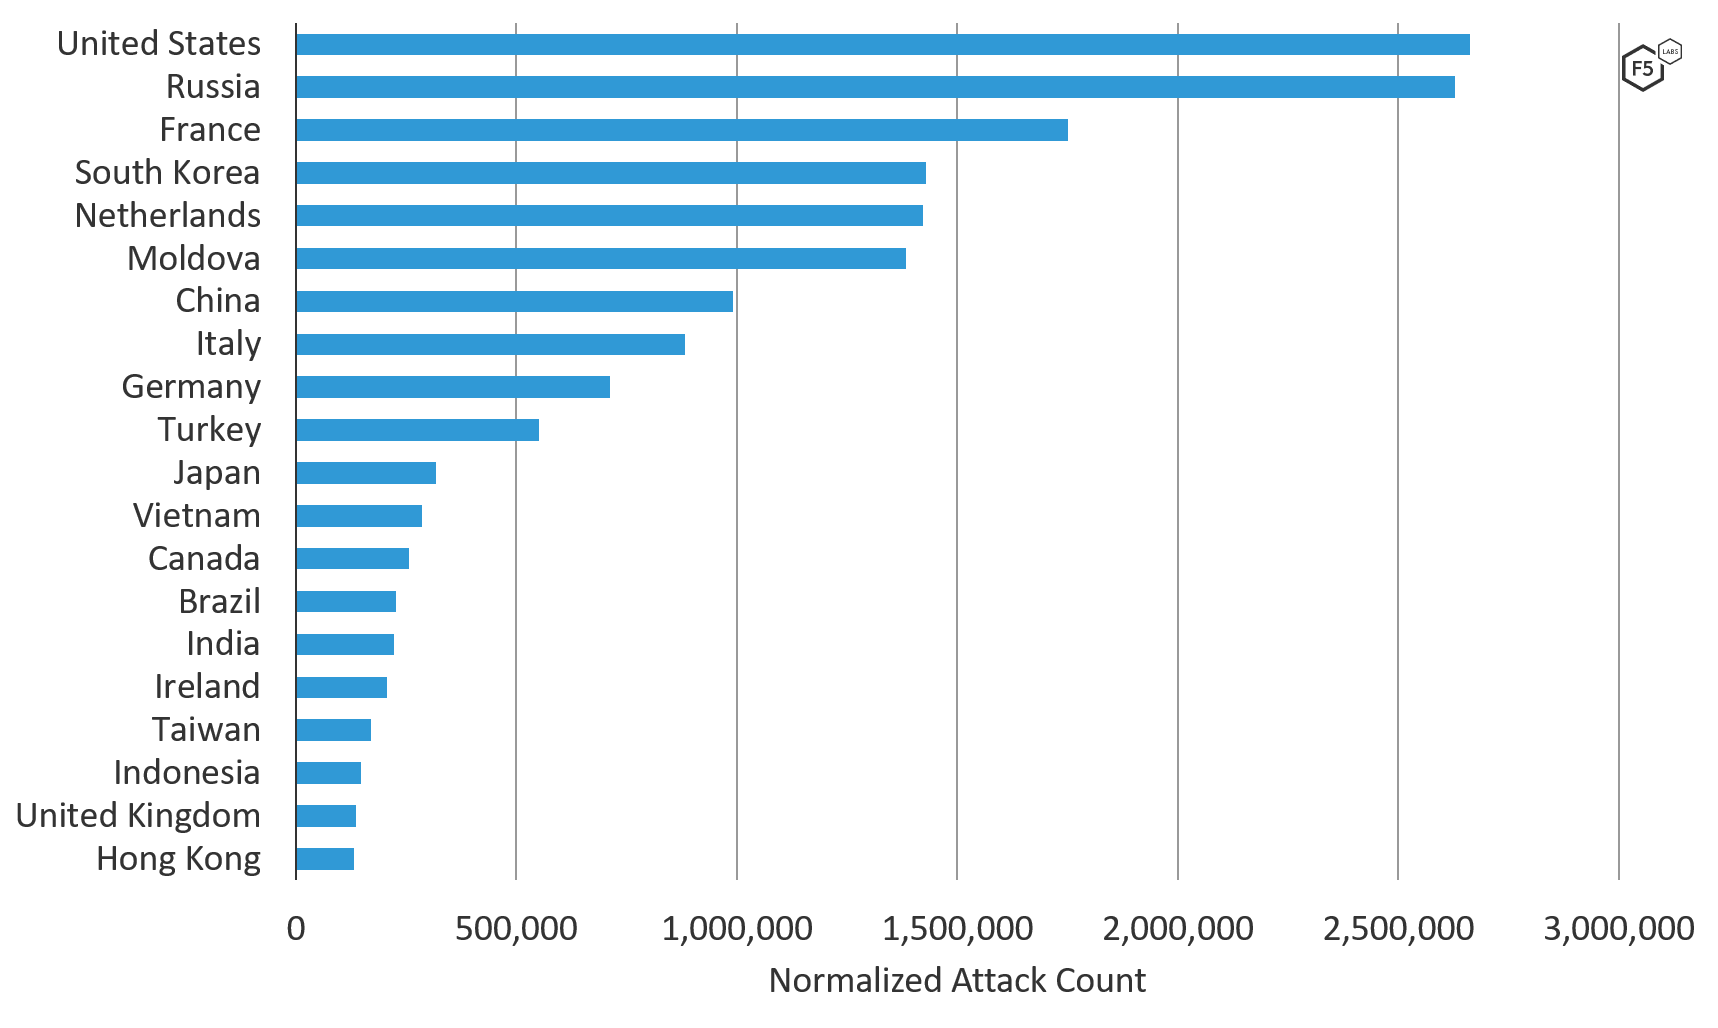
Figure 2. Top 20 source traffic countries directing malicious traffic towards systems in the U.S., August through October 2019
Top Attacking Organizations (ASNs)
HOSTKEY B.v, an Internet provider from Russia, launched the most attack traffic against systems in the U.S. IP addresses assigned to HOSTKEY B.v. make up the top three attacking IP addresses launching malicious traffic against American systems during this time period. HOSTKEY B.v. launched 49% more malicious traffic than RM Engineering (from Moldova), in second position. Rounding out the top five attacking ASNs are OVH SAS (from France) in third position, DigitalOcean LLC (from the Netherlands and the U.S.) in fourth position, and Amazon.com Inc. (from the U.S.) in fifth position. Amazon.com Inc. did not have any IP addresses on the 50 top attacking IP address list, which indicates the attack traffic was more evenly distributed between malicious systems.
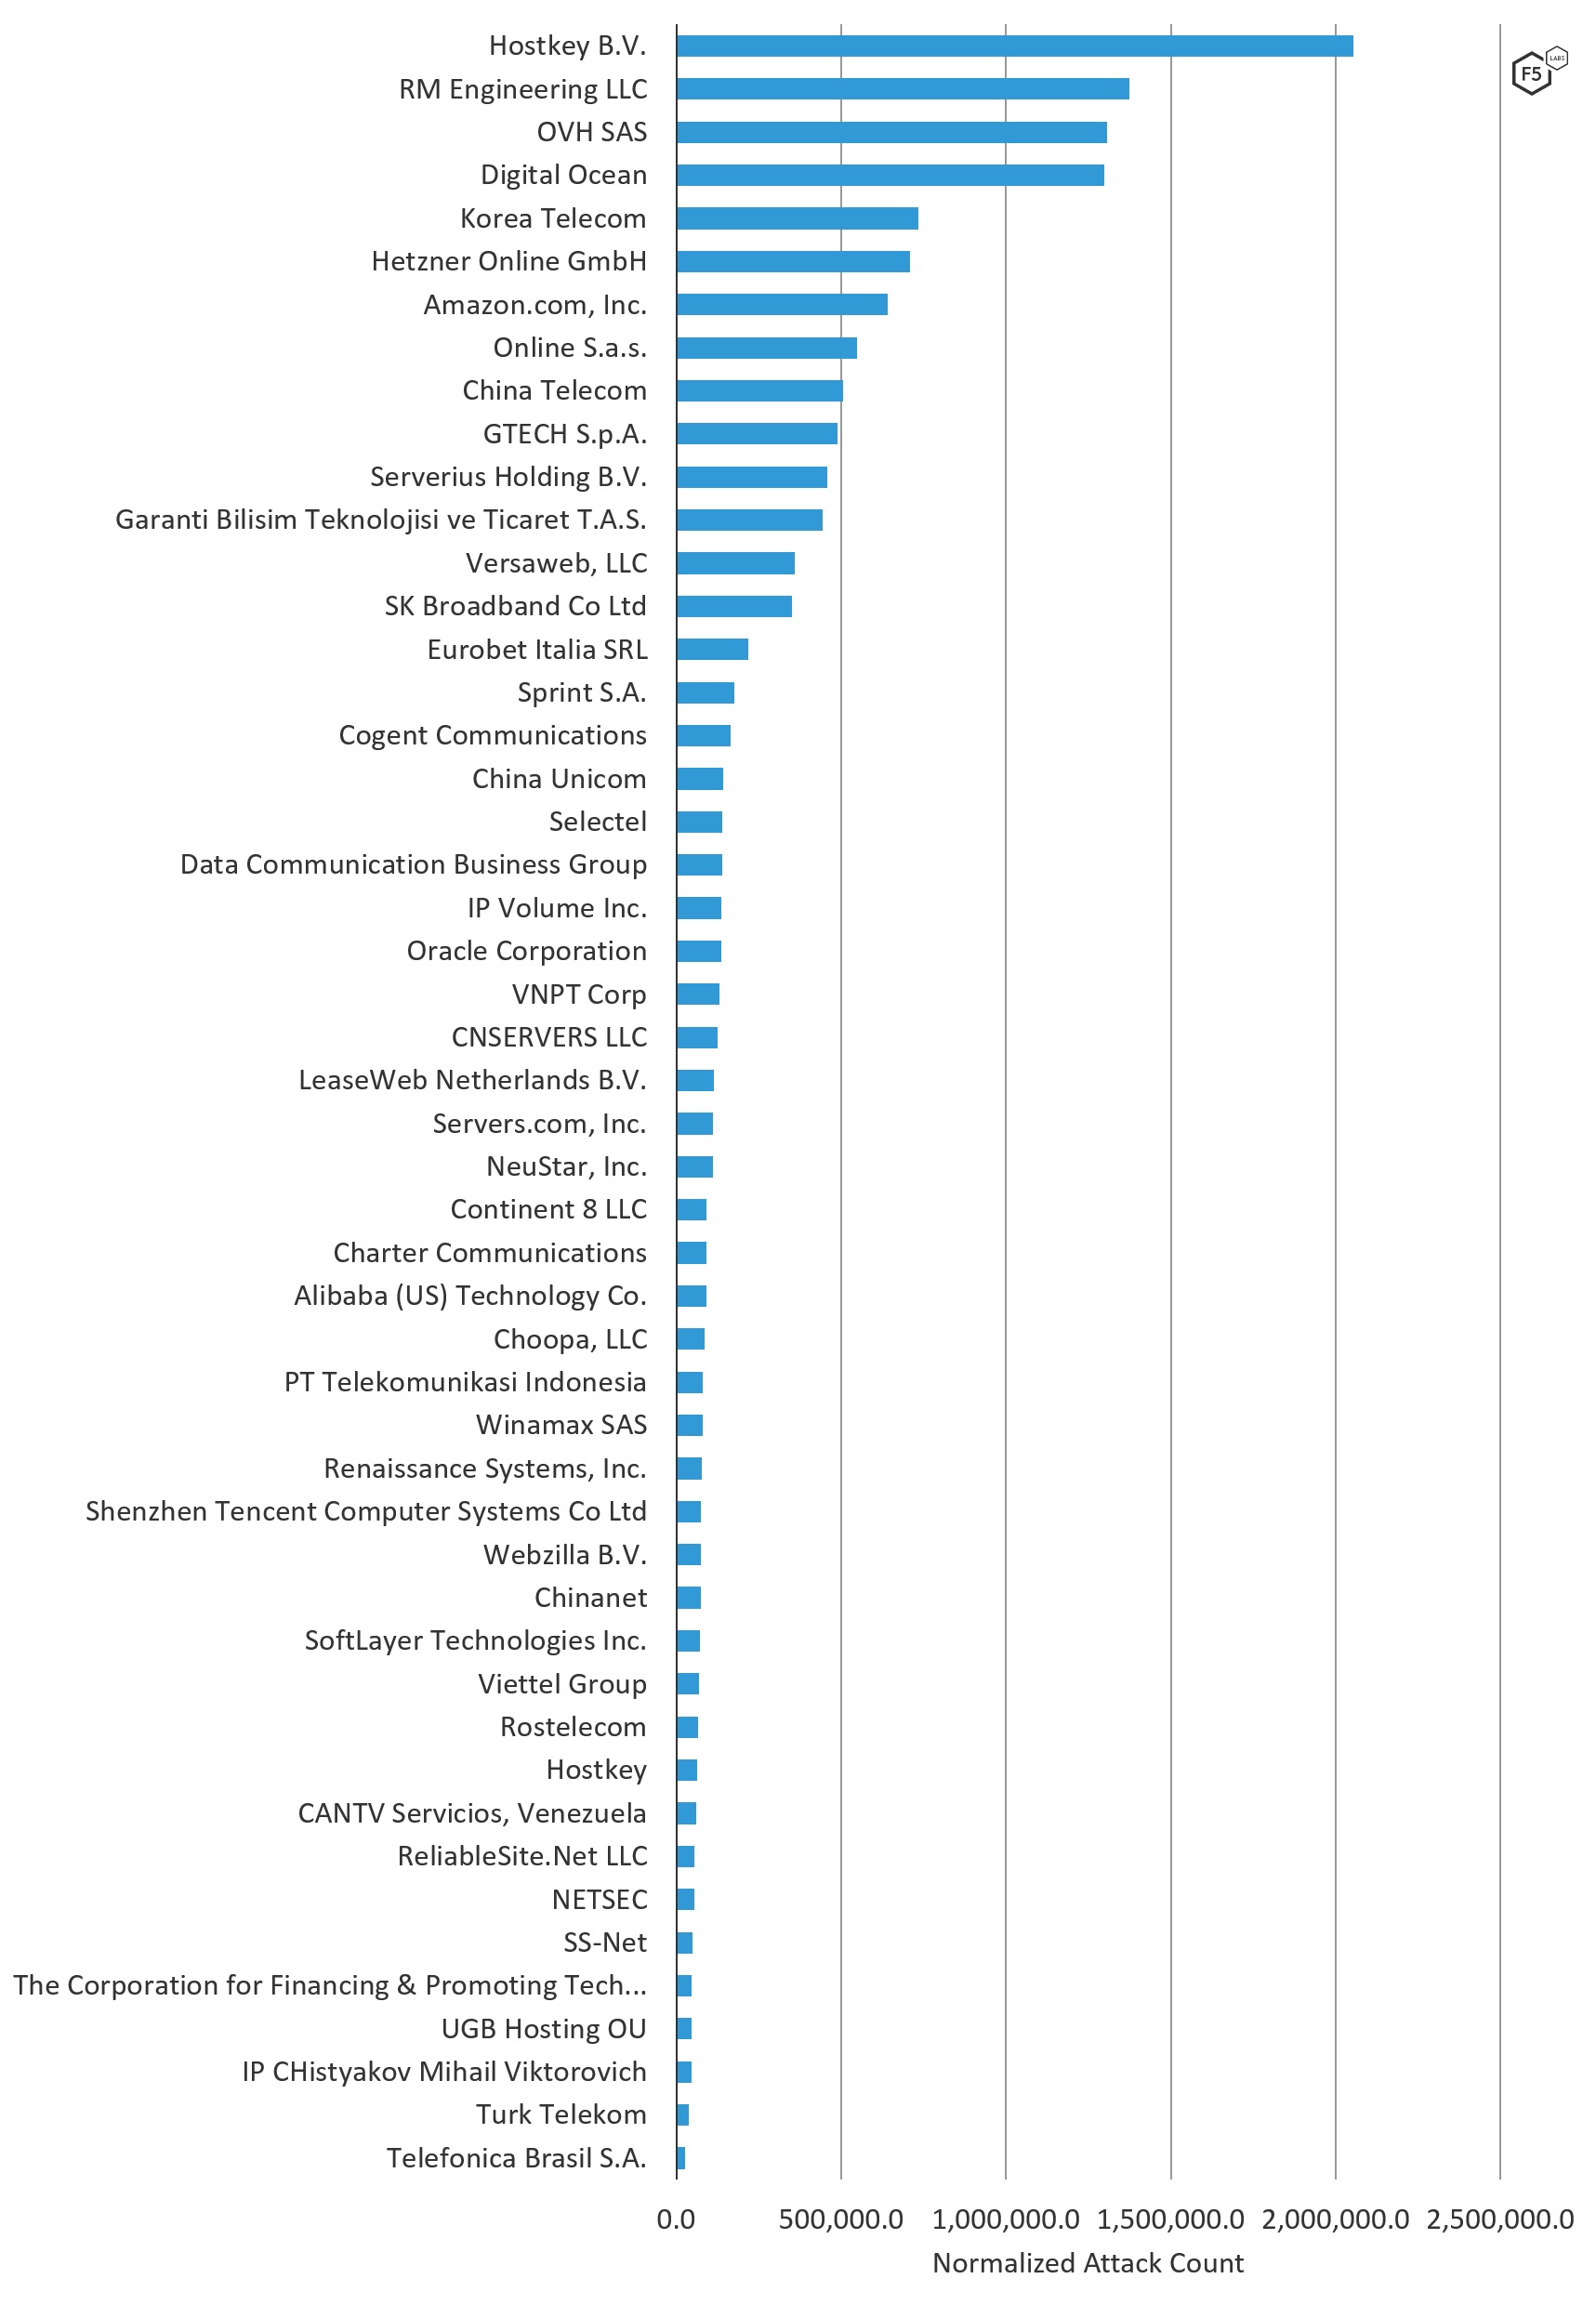
Figure 3. Source ASNs of attacks targeting U.S. systems, August through October 2019
Table 1 lists ASNs and their associated organizations (note that some have multiple ASNs).
| ASN Organization | ASN | Normalized Attack Count |
| Hostkey B.V. | 57043 | 2,053,482.1 |
| RM Engineering LLC | 49877 | 1,373,573.4 |
| OVH SAS | 16276 | 1,305,205.3 |
| Digital Ocean | 14061 | 1,298,137.3 |
| Korea Telecom | 4766 | 732,926.2 |
| Hetzner Online GmbH | 24940 | 709,500.7 |
| Amazon.com, Inc. | 16509 | 640,562.2 |
| Online S.a.s. | 12876 | 547,568.1 |
| China Telecom | 4134 | 505,914.9 |
| GTECH S.p.A. | 35574 | 488,987.0 |
| Serverius Holding B.V. | 50673 | 457,384.7 |
| Garanti Bilisim Teknolojisi ve Ticaret T.A.S. | 12903 | 443,395.1 |
| Versaweb, LLC | 36114 | 358,262.6 |
| SK Broadband Co Ltd | 9318 | 350,580.6 |
| Eurobet Italia SRL | 200944 | 217,821.8 |
| Sprint S.A. | 197226 | 177,305.7 |
| Cogent Communications | 174 | 164,328.5 |
| China Unicom | 4837 | 142,150.2 |
| Selectel | 49505 | 139,701.9 |
| Data Communication Business Group | 3462 | 139,583.2 |
| IP Volume Inc. | 202425 | 136,089.3 |
| Oracle Corporation | 31898 | 136,079.7 |
| VNPT Corp | 45899 | 131,260.2 |
| CNSERVERS LLC | 40065 | 124,572.2 |
| LeaseWeb Netherlands B.V. | 60781 | 113,427.5 |
| Servers.com, Inc. | 7979 | 111,980.3 |
| NeuStar, Inc. | 19905 | 111,733.8 |
| Continent 8 LLC | 14537 | 92,700.5 |
| Charter Communications | 20115 | 90,830.5 |
| Alibaba (US) Technology Co., Ltd. | 45102 | 90,374.6 |
| Choopa, LLC | 20473 | 86,633.9 |
| PT Telekomunikasi Indonesia | 7713 | 80,370.1 |
| Winamax SAS | 197014 | 80,161.7 |
| Renaissance Systems, Inc. | 16897 | 78,052.5 |
| Shenzhen Tencent Computer Systems Co Ltd | 45090 | 75,719.8 |
| Webzilla B.V. | 35415 | 74,955.0 |
| Chinanet | 23650 | 74,479.0 |
| SoftLayer Technologies Inc. | 36351 | 70,312.7 |
| Viettel Group | 7552 | 70,052.1 |
| Rostelecom | 12389 | 67,061.3 |
| Hostkey | 395839 | 63,795.2 |
| CANTV Servicios, Venezuela | 8048 | 59,994.7 |
| ReliableSite.Net LLC | 23470 | 56,115.4 |
| NETSEC | 45753 | 54,304.8 |
| SS-Net | 204428 | 48,458.4 |
| The Corporation for Financing & Promoting Tech... | 18403 | 47,319.6 |
| UGB Hosting OU | 206485 | 46,208.2 |
| IP CHistyakov Mihail Viktorovich | 35582 | 45,654.1 |
| Turk Telekom | 47331 | 38,838.5 |
| Telefonica Brasil S.A. | 27699 | 26,806.2 |
Table 1. ASNs and their associated organizations (some have multiple ASNs)
ASNs Attacking the U.S. Compared to Other Regions
We compared the count of attacks by ASN targeting U.S. systems to other regions of the world. The key difference between attack traffic launched from networks targeting the U.S. versus the rest of the world is the volume of attack traffic launched from AS organizations from within the U.S. The threat landscape in the U.S. included a sizable amount of traffic coming from Versaweb, LLC, Cogent Communications, Oracle Communications, Charter Communications, and ReliableSite.net (denoted with *** in Figure 4), which was unique to the U.S. Nowhere else in the world were these ASNs seen attacking. In terms of the top attacking ASNs around the world, the U.S. fell in the middle of the pack, not receiving the most or the least amount of malicious traffic from OVH SAS, RM Engineering, or DigitalOcean.
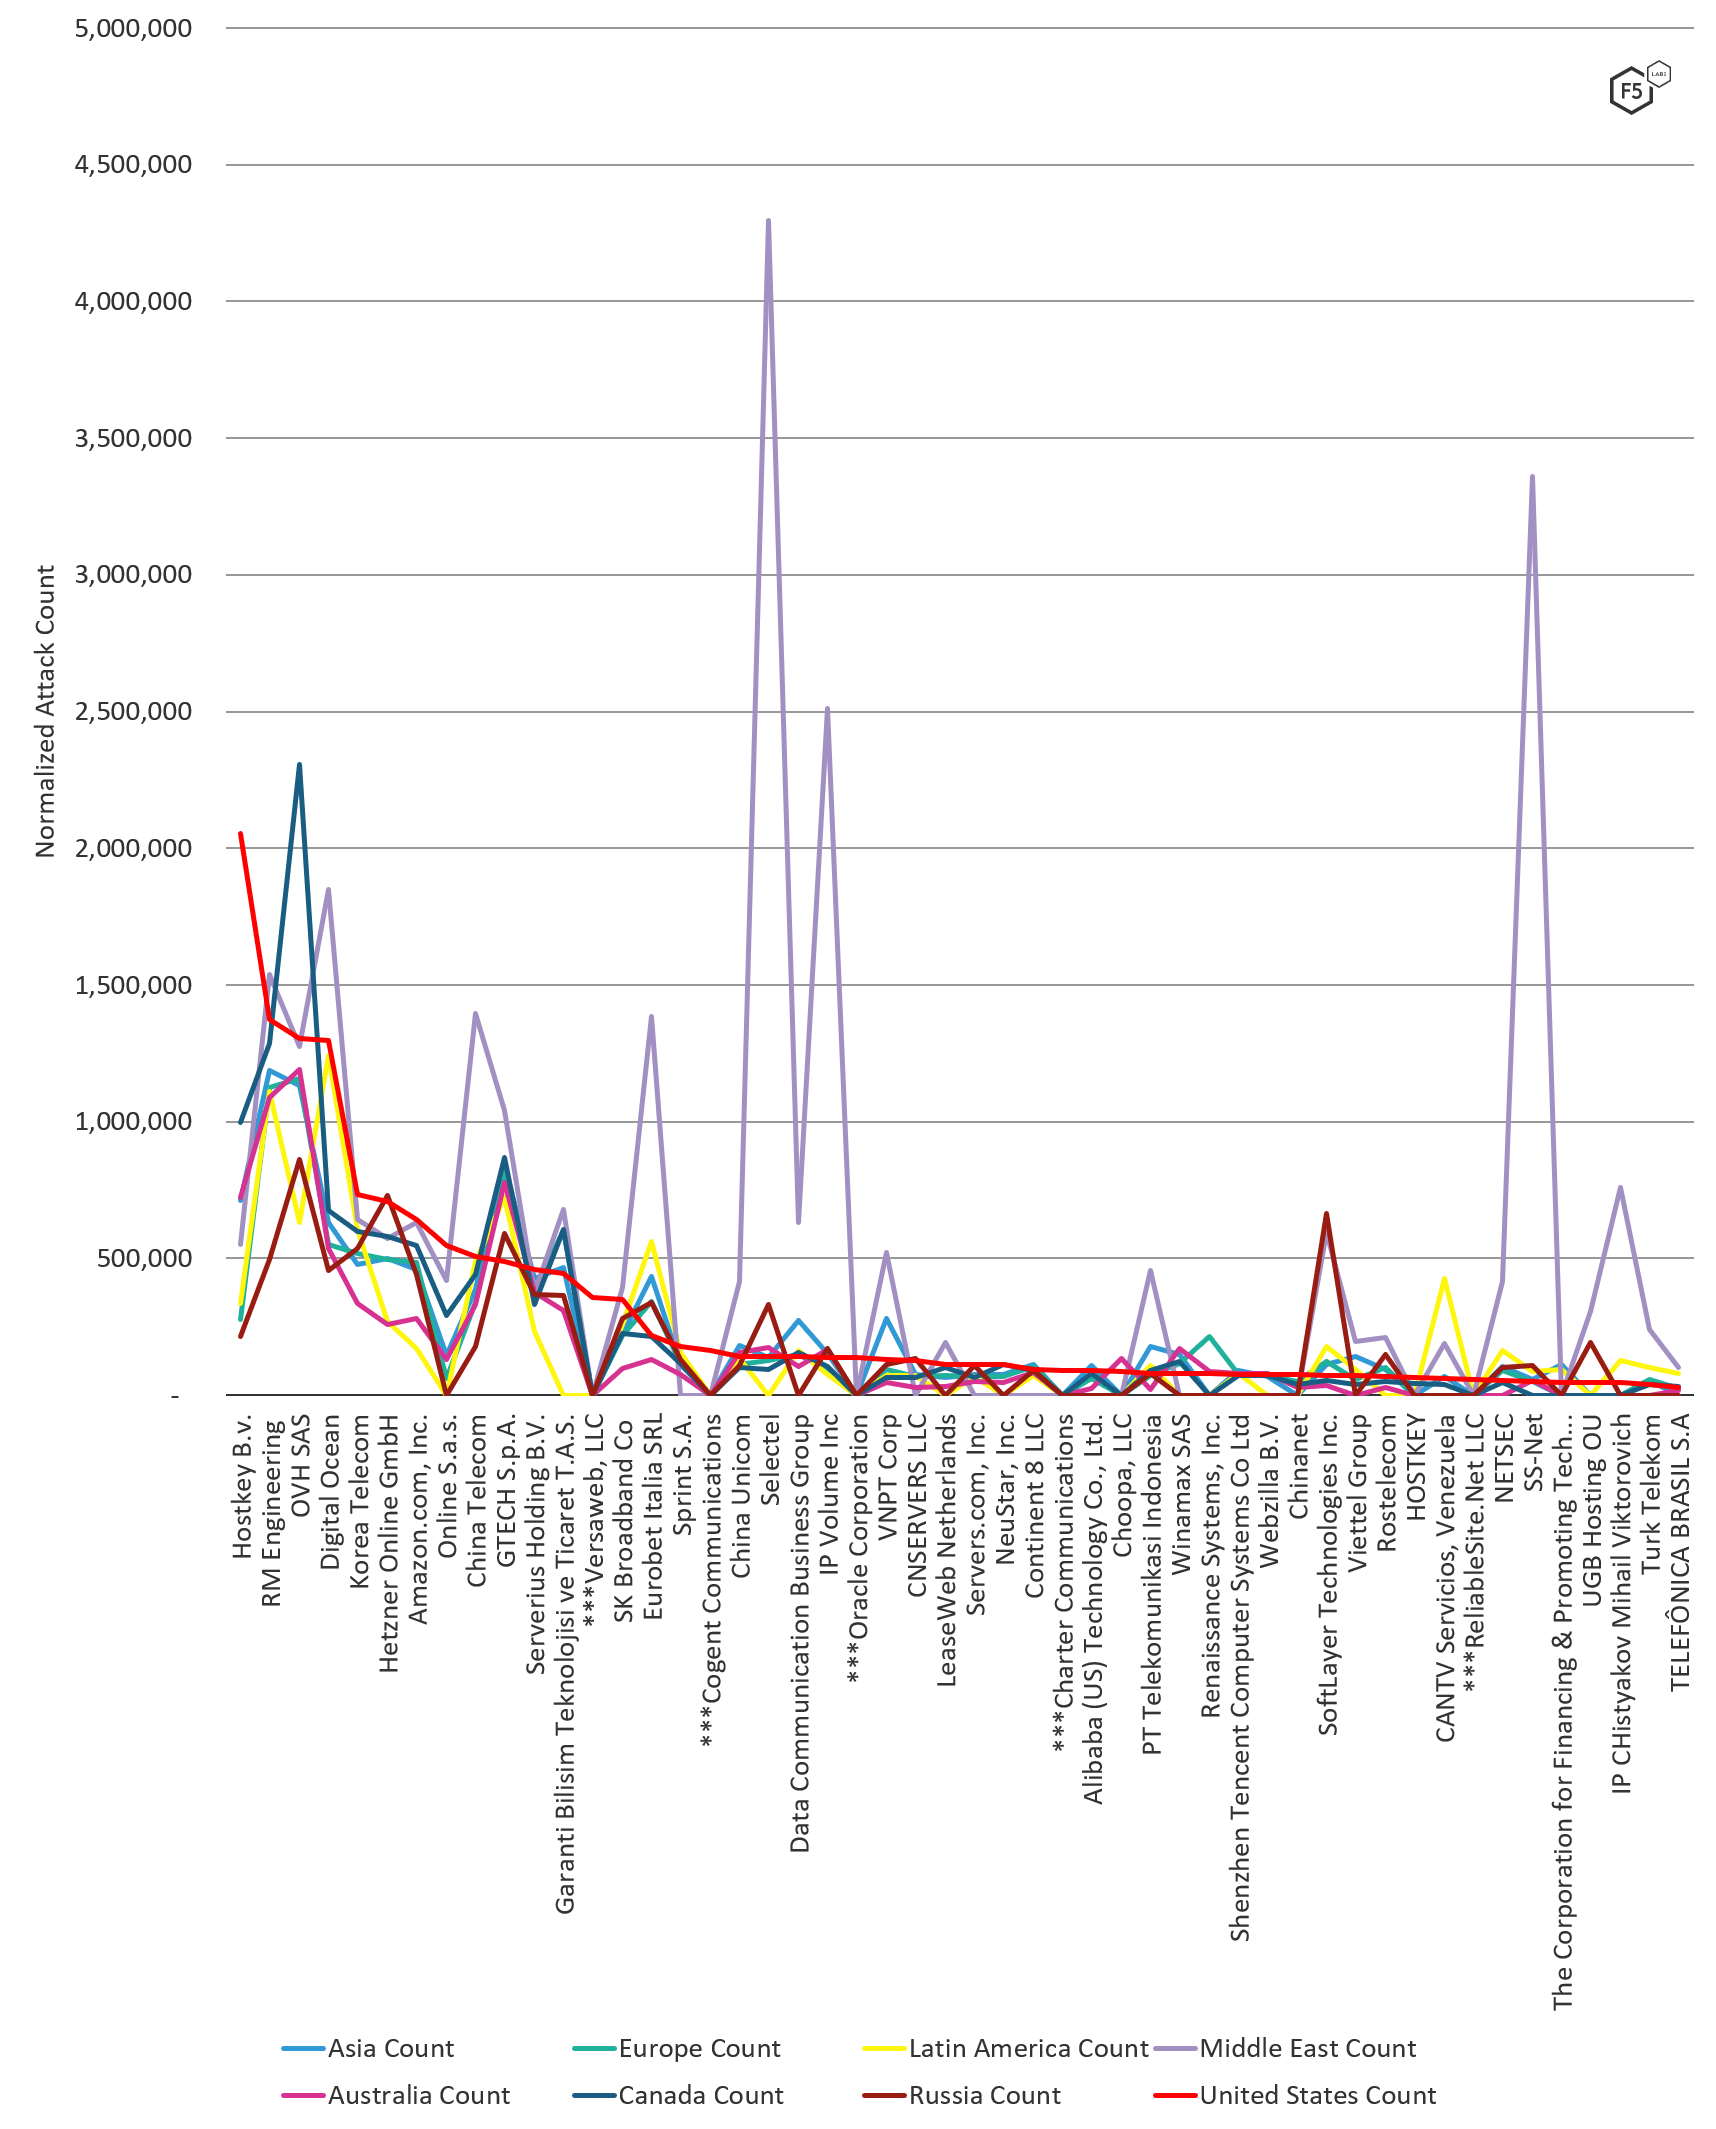
Figure 4: Normalized attack count by ASN by region, August through October 2019
Top Attacking IP Addresses
The top three IP addresses attacking systems in the U.S. from August 2019 through October 2019 were all assigned in Russia (see Figure 5). All three were engaged in credential stuffing and in multi-port scanning, activity that is typically attributed to looking for vulnerabilities. Rounding out the top five attacking IP addresses were two IP addresses assigned in Moldova, conducting the same activity as the Russian assigned IP addresses. Seventy-two percent of the IP addresses on the top 50 attacking IP addresses list were engaging in the same multi-port scanning behavior, many of which were American, Dutch, French, Russian, and Moldovan.1 Similar to the top source traffic countries list, most of the top attacking IP addresses come from within the U.S., Russia, France, and South Korea. For a complete list of attack counts by IP address, see section Attacks Types of Top Attacking IP Addresses below.
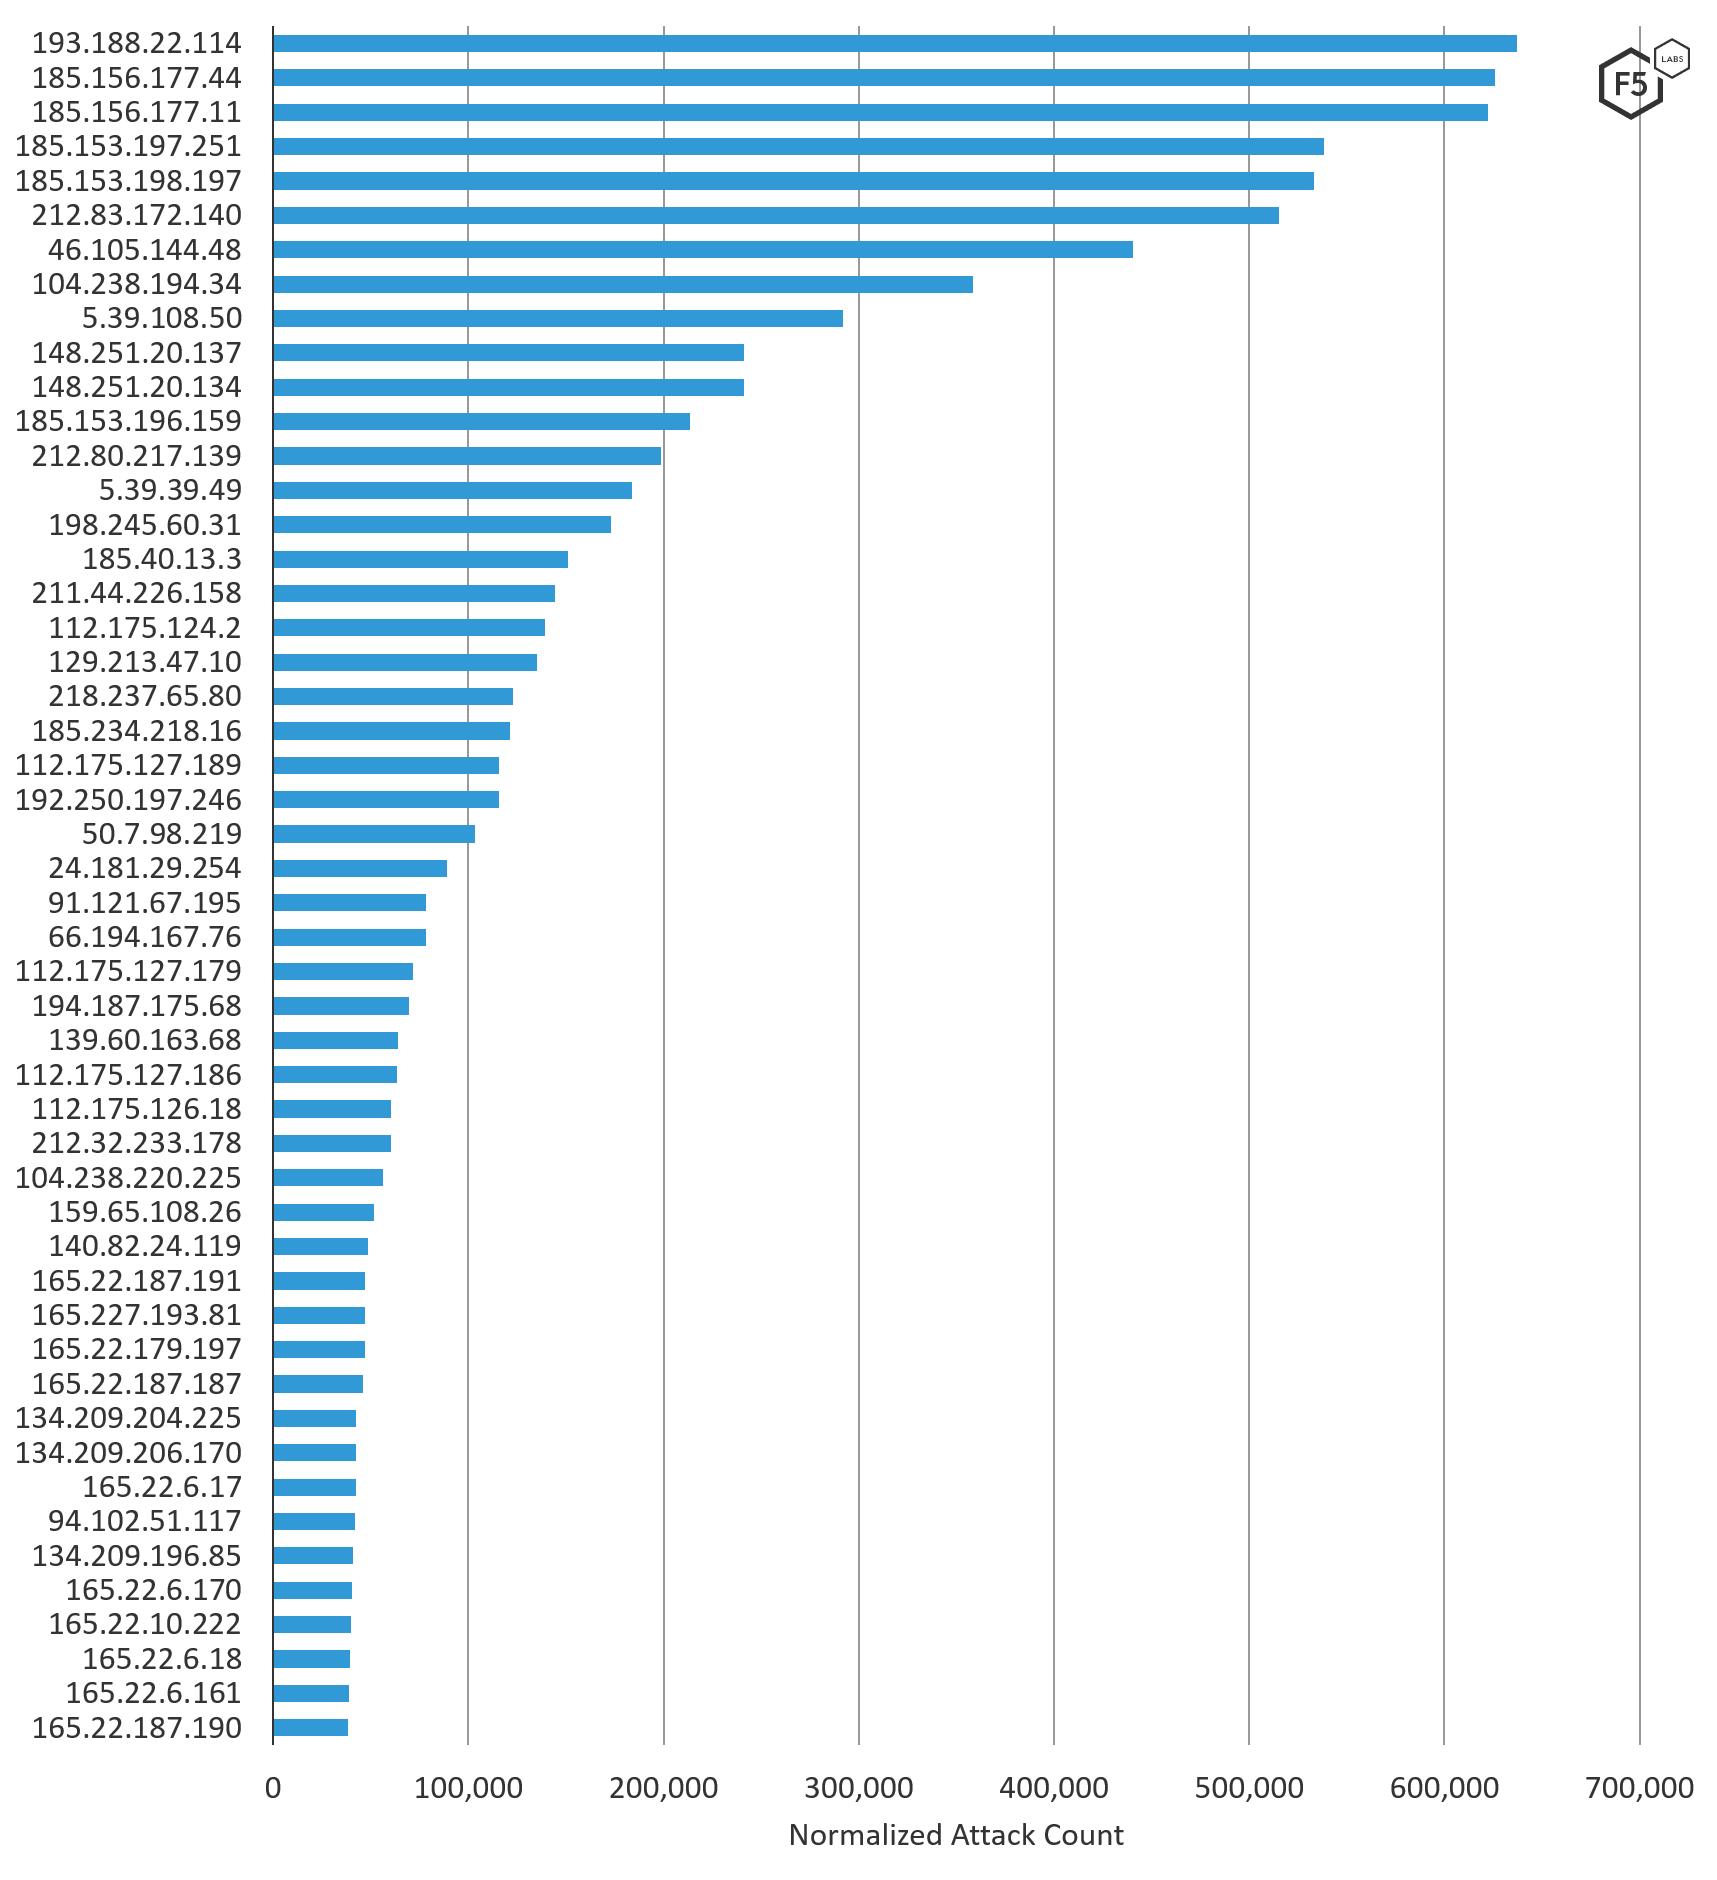
Figure 5. Top 50 IP addresses attacking U.S. targets, August through October 2019
IP Addresses Attacking the U.S. Compared to Other Regions
We looked at the volume of attack traffic U.S. systems received per IP address and compared that with other regions of the world. Attack traffic destined for U.S. systems had some overlap with the rest of the world. Many IP addresses seen attacking the U.S. were also seen sending malicious traffic to at least six regions around the world. The exception was a handful of IP addresses launching global attacks against RFB/VNC port 5900 (see the next section). Over a quarter (26%) of the top 50 attacking IP addresses sending malicious traffic to U.S. systems only targeted the U.S. while 16% of that top 50 were seen sending malicious attack traffic to all other regions in the world.
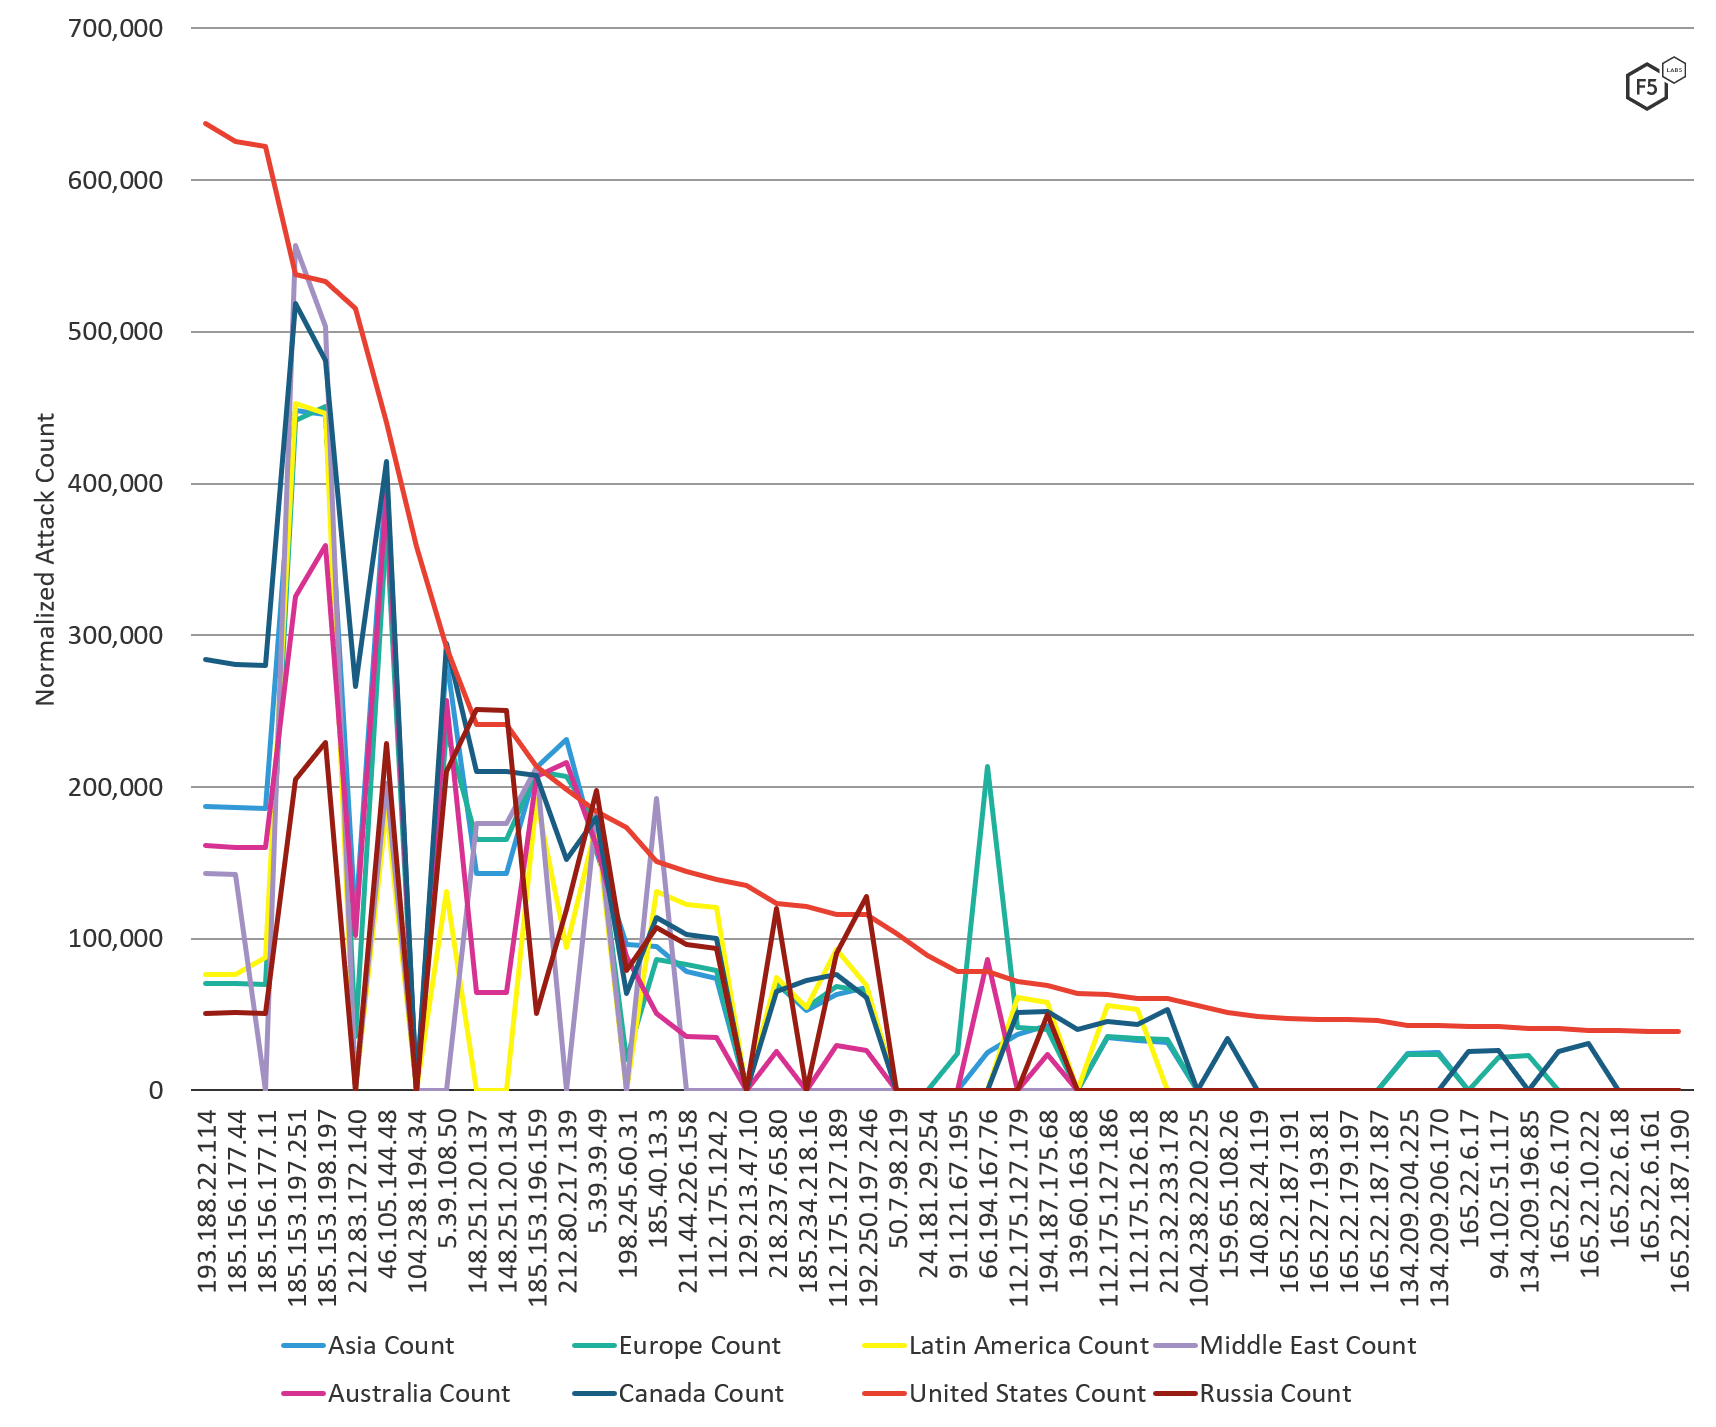
Figure 6: Normalized attack count by IP address by region, August through October 2019
Attacks Types of Top Attacking IP Addresses
Of the top 50 IP addresses attacking systems in the U.S., the most IP addresses were assigned in the U.S. (40%). The remainder of the top 50 attacking IP addresses were geographically distributed around the globe with 14% coming from South Korea, 6% each coming from Russia and Moldova, and 12% coming from the Netherlands. These were seen launching scans against multiple ports (72%), conducting credential stuffing activity (25%), sending spam (1%), and launching attacks against HTTP and HTTPS (1%) Many of the IP addresses conducting abusive port scanning and credential stuffing are specifically targeting Remote Frame Buffer (RFB)/VNC port 5900 with brute force and credential stuffing attacks.
The IP addresses in Moldova assigned to RM Engineering, as well as OVH SAS in France, were launching brute force and credential stuffing attacks against Remote Frame Buffer (RFB)/VNC port 5900, globally. All regions of the world are being hit with these same attacks from these IP addresses:
- 185.153.197.251
- 185.153.198.197
- 46.105.144.48
- 193.188.22.114
- 185.156.177.44
- 185.153.196.159
- 5.39.39.49
- 185.40.13.3
These port 5900 attacks were new activity we noticed earlier in the summer and continued through October 31, 2019. We have opened up a public threat hunting investigation on Twitter to uncover what is going on with these attacks and will be looking to share our findings and ask questions soon. Join the conversation on Twitter.
Twenty-six percent of the IP addresses seen sending malicious traffic to Europe exclusively targeted this region. The following list is in descending order starting with top attacking IP addresses.
| Source IP Address | AS Organization | Country | Normalized Count | Atttack type known for |
| 193.188.22.114 | HOSTKEY B.v. | Russia | 637,316.30 | Credential stuffing, multi-port scanning |
| 185.156.177.44 | HOSTKEY B.v. | Russia | 625,738.50 | Credential stuffing, multi-port scanning |
| 185.156.177.11 | HOSTKEY B.v. | Russia | 622,451.50 | Credential stuffing, multi-port scanning |
| 185.153.197.251 | RM Engineering LLC | Republic of Moldova | 538,027.20 | Credential stuffing, multi-port scanning |
| 185.153.198.197 | RM Engineering LLC | Republic of Moldova | 532,990.70 | Credential stuffing, multi-port scanning |
| 212.83.172.140 | Online S.a.s. | France | 515,359.20 | Credential stuffing, multi-port scanning |
| 46.105.144.48 | OVH SAS | France | 440,409.00 | Credential stuffing, multi-port scanning |
| 104.238.194.34 | Versaweb, LLC | U.S. | 358,251.30 | Port scanning (ports 445, 1433) |
| 5.39.108.50 | OVH SAS | France | 292,101.50 | Credential stuffing, multi-port scanning |
| 148.251.20.137 | Hetzner Online GmbH | Germany | 241,383.50 | Port scanning (ports 25, 80, 443, 22) |
| 148.251.20.134 | Hetzner Online GmbH | Germany | 241,288.10 | Port scanning (ports 443, 22, 25, 80) |
| 185.153.196.159 | RM Engineering LLC | Republic of Moldova | 213,563.40 | Credential stuffing, multi-port scanning |
| 212.80.217.139 | Serverius Holding B.V. | Netherlands | 198,583.10 | Credential stuffing, multi-port scanning |
| 5.39.39.49 | OVH SAS | France | 183,993.20 | Credential stuffing, multi-port scanning |
| 198.245.60.31 | OVH SAS | Canada | 172,980.60 | Credential stuffing, multi-port scanning |
| 185.40.13.3 | GTECH S.p.A. | Italy | 150,877.20 | Port scanning (51 unique ports) |
| 211.44.226.158 | SK Broadband Co Ltd | South Korea | 144,206.20 | Port scanning (48 unique ports) |
| 112.175.124.2 | Korea Telecom | South Korea | 138,991.40 | Port scanning (61 unique ports) |
| 129.213.47.10 | Oracle Corporation | U.S. | 135,213.00 | Spam (ports: 25) |
| 218.237.65.80 | SK Broadband Co Ltd | South Korea | 123,029.60 | Port scanning (ports 53, 80, 22, 443) |
| 185.234.218.16 | sprint S.A. | Ireland | 121,521.00 | Credential stuffing, multi-port scanning |
| 112.175.127.189 | Korea Telecom | South Korea | 115,887.80 | Port scanning (many ports: 48 unique ports) |
| 192.250.197.246 | CNSERVERS LLC | U.S. | 115,696.50 | Credential stuffing, multi-port scanning |
| 50.7.98.219 | Cogent Communications | U.S. | 103,632.70 | Port scanning (ports 1433, 445) |
| 24.181.29.254 | Charter Communications | U.S. | 88,894.40 | Port scanning (port 45) |
| 91.121.67.195 | OVH SAS | France | 78,244.40 | Credential stuffing, multi-port scanning |
| 66.194.167.76 | Renaissance Systems, Inc. | U.S. | 78,052.50 | Port scanning (port 5900) |
| 112.175.127.179 | Korea Telecom | South Korea | 71,686.00 | Port scanning (48 unique ports) |
| 194.187.175.68 | GTECH S.p.A. | Italy | 69,338.90 | Port scanning (45 unique ports) |
| 139.60.163.68 | HOSTKEY | U.S. | 63,769.90 | Credential stuffing, multi-port scanning |
| 112.175.127.186 | Korea Telecom | South Korea | 63,201.00 | Port scanning (46 unique ports) |
| 112.175.126.18 | Korea Telecom | South Korea | 60,488.30 | Port scanning (42 unique ports) |
| 212.32.233.178 | LeaseWeb Netherlands B.V. | Netherlands | 60,459.50 | Port scanning (ports 80, 25, 443) |
| 104.238.220.225 | ReliableSite.Net LLC | U.S. | 56,063.40 | HTTP attacks, multi-port scanning |
| 159.65.108.26 | DigitalOcean, LLC | U.S. | 51,599.30 | Port scanning (port 5900) |
| 140.82.24.119 | Choopa, LLC | U.S. | 48,775.80 | Port scanning (ports 80, 22, 161) |
| 165.22.187.191 | DigitalOcean, LLC | U.S. | 47,067.80 | Port scanning (port 5900) |
| 165.227.193.81 | DigitalOcean, LLC | U.S. | 47,053.80 | Port scanning (port 5900) |
| 165.22.179.197 | DigitalOcean, LLC | U.S. | 47,022.40 | Port scanning (port 5900) |
| 165.22.187.187 | DigitalOcean, LLC | U.S. | 46,266.50 | Port scanning (port 5900) |
| 134.209.204.225 | DigitalOcean, LLC | Netherlands | 42,677.10 | Port scanning (ports 80, 445, 53, 443, 22) |
| 134.209.206.170 | DigitalOcean, LLC | Netherlands | 42,582.60 | Port scanning (6 unique ports) |
| 165.22.6.17 | DigitalOcean, LLC | U.S. | 42,326.30 | Port scanning (port 5900) |
| 94.102.51.117 | IP Volume inc | Netherlands | 42,003.90 | Credential stuffing, multi-port scanning |
| 134.209.196.85 | DigitalOcean, LLC | Netherlands | 41,063.40 | Port scanning (7 unique ports) |
| 165.22.6.170 | DigitalOcean, LLC | U.S. | 40,638.00 | Port scanning (port 5900) |
| 165.22.10.222 | DigitalOcean, LLC | U.S. | 39,692.70 | Port scanning (port 5900) |
| 165.22.6.18 | DigitalOcean, LLC | U.S. | 39,211.40 | Port scanning (port 5900) |
| 165.22.6.161 | DigitalOcean, LLC | U.S. | 38,726.20 | Port scanning (port 5900) |
| 165.22.187.190 | DigitalOcean, LLC | U.S. | 38,507.60 | Port scanning (port 5900) |
Table 2. Top attacking IP addresses in descending order.
Top Targeted Ports
VNC port 5900 was the top attacked port in the U.S. from August 1, 2019 through October 31, 2019. It is being attacked all over the world during this time period (see Figure 7). This activity is not typical, hence the investigative threat hunting we are doing on Twitter mentioned previously. SMB port 445 was in a distant second position for service/port attacked in the U.S. This activity was followed closely by SSH port 22. After SSH, HTTP port 80 and HTTPS port 443 are some of the top attacked services. These ports are commonly targeted as exploiting a vulnerability on port 445, 22, or 23 can give a malicious actor access to the entire system.
What stands out the most in top attacked ports in the U.S. threat landscape is the targeting of port 45. Port 45 does not have an official designation, but appears to have something to do with messaging, and it may be an alternate use for SNMP or used in conjunction with SNMP.2 That port does not show up in any other region we analyzed during the same time period.
In addition to some of the most commonly targeted ports, the number of non-standard HTTP ports (8443, and 8080, and 8088) targeting, and other application ports like Microsoft SMB port 445, and Microsoft CRM port 5555 makes it clear that attackers are targeting applications in the U.S.
Also noteworthy, the U.S. and the Middle East were the only regions in which SQL on port 1433 was targeted. This along with the targeting of other database ports such as 3389 and 3306 indicate malicious actors are particularly interested in web applications and web application databases.
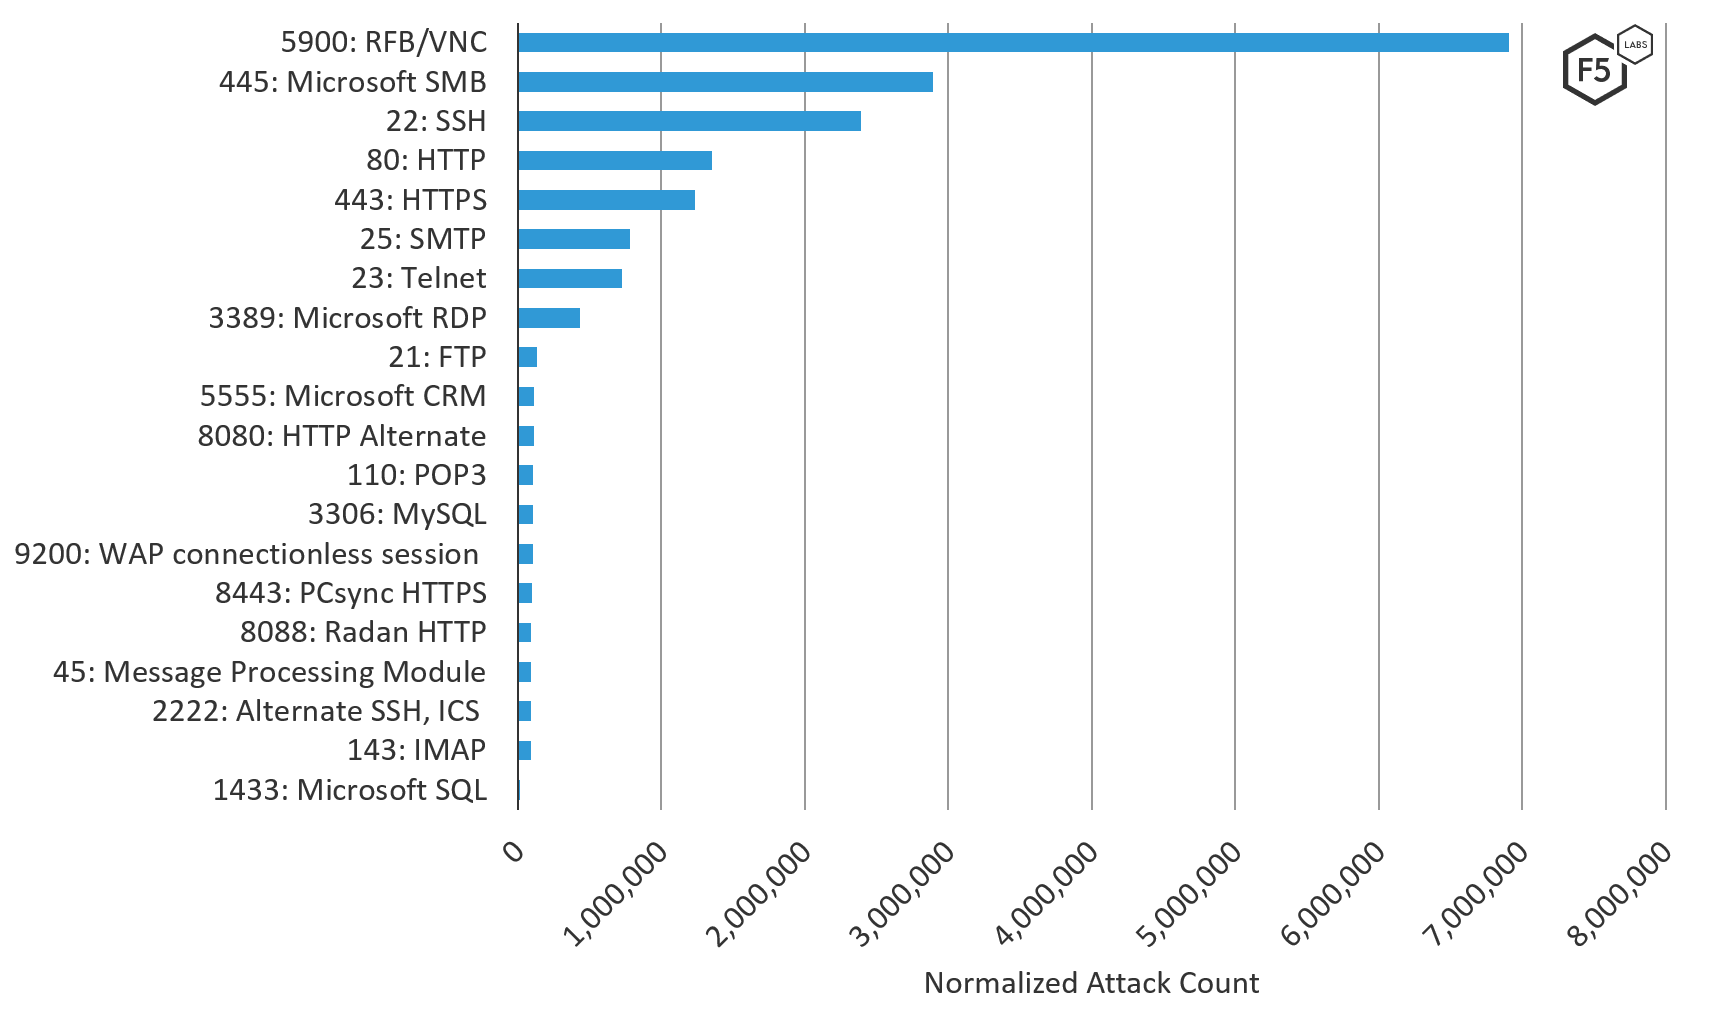
Figure 7. Top 20 ports attacked in the U.S., August through October 2019
Conclusion
In general, the best approach a security team can take as defenders in this modern threat landscape is one of “assume breach.” This is not a FUD (fear, uncertainty, and doubt) position, this is a realistic position backed up by the volume of attack traffic received by all systems touching the Internet, the likelihood of existing vulnerabilities, and the amount of compromised credentials available to attackers. When you take an “assume breach” defensive position, you are collecting attack traffic and monitoring your logs. You can use this high-level attack data to compare against the attack traffic directly hitting your own network. This will help you rule out run-of-the-mill attack traffic, or help you determine whether or not you are being targeted, in which case, investigating the attack sources and patterns is a worthwhile activity.
Additionally, locking down any of the top targeted ports that do not absolutely require unfettered Internet access should be completed as soon as possible.
And because default vendor credentials are commonly left in place, and the volume of breached credentials in 2017 (see F5 Labs report Lessons Learned from a Decade of Data Breaches) was enough to determine that many usernames and passwords are now considered “public,” all organizations should have credential stuffing protection in place. Particularly for any system with remote authentication, and especially administrative remote access.
Security Controls
To mitigate the types of attacks discussed here, we recommend the following security controls (/content/f5-labs-v2/en/archive-pages/education/what-are-security-controls.html) be put in place:
Recommendations
- Use firewalls to restrict all unnecessary access to commonly attacked ports that must be exposed publicly.
- Never expose internal databases publicly, and restrict access to internal data on a need-to-know basis.
- Prioritize risk mitigation for commonly attacked ports that require external access (like HTTP and SSH) for vulnerability management.
- Protect applications accessible over SSH using brute force restrictions.
- Disable all vendor default credentials (commonly used in SSH brute force attacks) on all systems before deploying them publicly.
- Implement geo IP address blocking of commonly attacking countries that your organization does not need to communicate with.


