
The Sensor Intel Series is created in partnership with Efflux , who maintains a globally distributed network of sensors from which we derive attack telemetry.
------------------------------------------------------------------------------------------
The stubborn one-way passage of time means that it is time for another round of vulnerability targeting intelligence. Web attacks in May 2023 had a lot in common with those in April, with eight of the top ten vulnerabilities remaining consistent across the two months. In that vein of continuity, CVE-2020-8958, the Guangzhou GPON router vulnerability which attackers have targeted heavily for more than a year, continued to draw more than twice the attack traffic of any other CVE.
Also in the top ten were two vulnerabilities which were only recently added to our list of signatures: CVE-2022-24847, a GeoServer remote code execution (RCE) vulnerability that we added in May, and CVE-2021-26855, one of the ProxyLogon vulnerabilities in Microsoft Exchange Server. We actually had a signature already in place for CVE-2021-26855, but after a review of exploit code we have changed that to cover CVE-2021-27065, which is another Exchange Server vulnerability with many similarities, but which sees much less traffic. The upshot is that we are now representing traffic against Microsoft Exchange Server vulnerabilities more accurately, which is good because—stop me if you’ve heard this one—Microsoft Exchange Server is quite the popular piece of software.
May Vulnerabilities by the Numbers
Figure 1 shows the volume of attack traffic for the top ten vulnerabilities in May by volume. Here the overwhelming popularity of CVE-2020-8958 is apparent. It is also notable, however, just how many Microsoft Exchange Server vulnerabilities are present: four out of the top ten (or really five out of the top eleven, since we can’t distinguish CVE-2022-41040 from CVE-2021-34473 with these logs) are targeting Microsoft Exchange Server. This isn’t surprising, given the ubiquity and prominence of the product in enterprise systems, but there seems to have been a marked uptick in Microsoft targeting in the last few months.
Table 1 displays the traffic volume for all of the vulnerabilities that showed up in our systems in either May or April (i.e. not all of the 67 vulnerabilities we track are present here). As usual, the change from the previous month is included, but we’ve also included two metrics that are new to this series: Common Vulnerability Scoring System (CVSS) v3.x scores, and Exploit Prediction Scoring System (EPSS) scores. We’ve included these scores because both are valuable sources of vulnerability intelligence that can help put our own observations, which are necessarily limited like all logs of Web traffic, into perspective. As EPSS scores forecast exploitation likelihood in the next 30 days, they are also time-bound. The scores represented here are from June 1 2023, or the day immediately after the period in question.
| CVE Number | May Traffic | Change from April | CVSS v3.x | EPSS Score |
| CVE-2020-8958 | 7490 | 173 | 7.2 | 83% |
| CVE-2022-24847 | 2629 | -84 | 7.2 | n/a |
| CVE-2017-9841 | 2428 | 225 | 9.8 | 97% |
| CVE-2022-22947 | 1918 | -257 | 10 | n/a |
| CVE-2021-28481 | 1385 | 522 | 9.8 | 2% |
| CVE-2020-0688 | 1362 | -68 | 8.8 | 97% |
| CVE-2022-41040/CVE-2021-34473 | 1064 | 214 | 9.8 | 97% |
| CVE-2021-26855 | 1023 | 237 | 9.8 | 98% |
| 2018 JAWS Web Server Vuln | 761 | -1941 | NA | n/a |
| CVE-2021-3129 | 560 | 28 | 9.8 | 97% |
| CVE-2019-9082 | 541 | -35 | 8.8 | 97% |
| CVE-2021-26086 | 370 | 273 | 5.3 | 94% |
| CVE-2017-1000226 | 366 | 276 | 5.3 | 0% |
| CVE-2018-10561 | 322 | -738 | 9.8 | 97% |
| CVE-2018-13379 | 316 | -154 | 9.8 | 97% |
| CVE-2019-18935 | 313 | 92 | 9.8 | 91% |
| CVE-2014-2908 | 299 | 43 | NA | 1% |
| Citrix XML Buffer Overflow | 294 | 40 | NA | n/a |
| CVE-2013-6397 | 292 | 40 | NA | 71% |
| CVE-2020-15505 | 260 | -36 | 9.8 | 98% |
| NETGEAR-MOZI | 243 | -37 | NA | n/a |
| CVE-2017-18368 | 228 | 111 | 9.8 | 98% |
| CVE-2020-25078 | 225 | 200 | 7.5 | 97% |
| CVE-2021-40539 | 188 | -18 | 9.8 | 98% |
| CVE-2021-22986 | 169 | -55 | 9.8 | 97% |
| CVE-2019-12725 | 150 | 22 | 9.8 | 97% |
| CVE-2021-44228 | 83 | 35 | 10 | n/a |
| CVE-2022-22965 | 22 | -12 | 9.8 | n/a |
| CVE-2019-9670 | 20 | -4 | 9.8 | 98% |
| CVE-2020-3452 | 16 | 3 | 7.5 | 98% |
| CVE-2022-40684 | 15 | -18 | 9.8 | n/a |
| CVE-2021-26084 | 9 | NA | 9.8 | 97% |
| CVE-2021-21985 | 8 | -2 | 9.8 | 97% |
| CVE-2021-41277 | 4 | 3 | 10 | 97% |
| CVE-2007-3010 | 3 | NA | NA | 97% |
| CVE-2018-7600 | 1 | -2 | 9.8 | 98% |
| CVE-2021-27065 | 1 | NA | 7.8 | 93% |
| CVE-2021-25369 | NA | NA | 6.2 | 0% |
| CVE-2022-1388 | 0 | -1 | 9.8 | n/a |
Table 1. Traffic volumes, change from the previous month, CVSS and EPSS scores for all vulnerabilities that were targeted in either May or April 2023.
It is particularly interesting to see some extraordinarily low EPSS scores among the top-targeted vulnerabilities. While an 83% likelihood of exploitation for CVE-2020-8958 shouldn’t be read as a false negative (it still is in the 97th percentile), CVE-2017-1000226 has a likelihood of exploitation of 0.1%, which makes this latest rash of attacks quite interesting. We will keep an eye on that EPSS score to see if it increases as logs from this targeting campaign make their way into EPSS’ training data.
Targeting Trends
To better illustrate how May contrasts with previous months, Figure 2 shows how fourteen of the most heavily targeted vulnerabilities (the top five from each month of the past year) have ebbed and flowed in terms of attack volume and rank. May 2023 didn’t see a huge amount of change in this respect other than the 2018 JAWS Web Server Vulnerability (another Internet of Things vulnerability in a digital video recorder), which decreased 72% from April traffic. While some other vulnerabilities changed rank, none of this group of fourteen changed dramatically in volume.
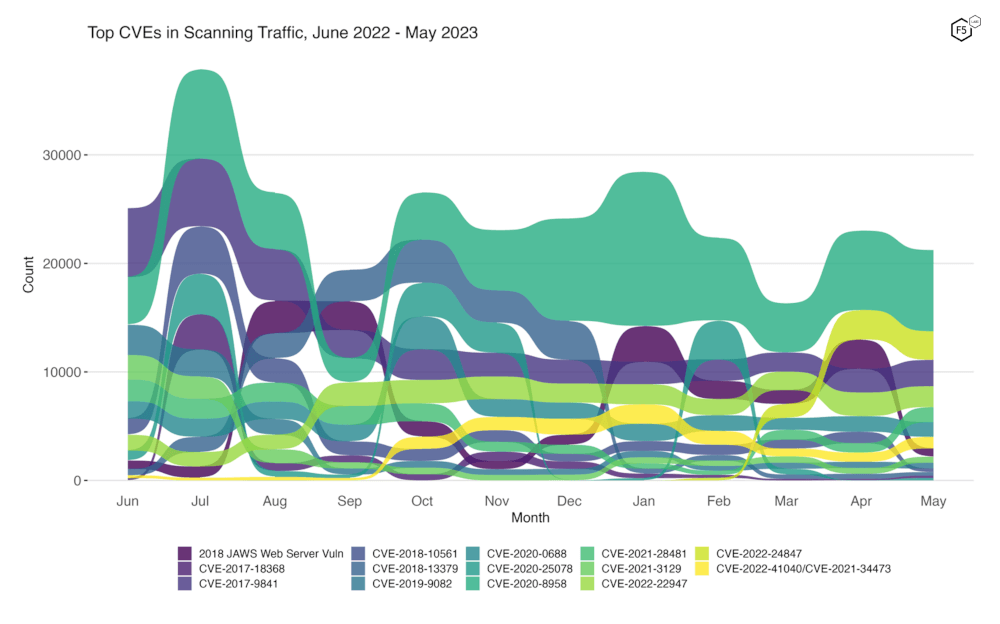
Figure 2. Evolution of vulnerability targeting trends over previous twelve months. This plot shows fourteen vulnerabilities which collectively represent the monthly top five for all twelve months.
Long Term Trends
Figure 3 shows traffic volume for the past year for all 67 of the tracked CVEs. The growth of the GeoServer vulnerability (CVE-2022-24847) over the previous three months is still apparent (third row, rightmost column), although it is interesting to see that the volume has leveled out. CVE-2020-25078, a remote administrator password disclosure vulnerability in D-Link IP cameras, has begun to grow again after declining from a local high in February 2023. We will be watching to see whether it reaches new heights or subsides again.
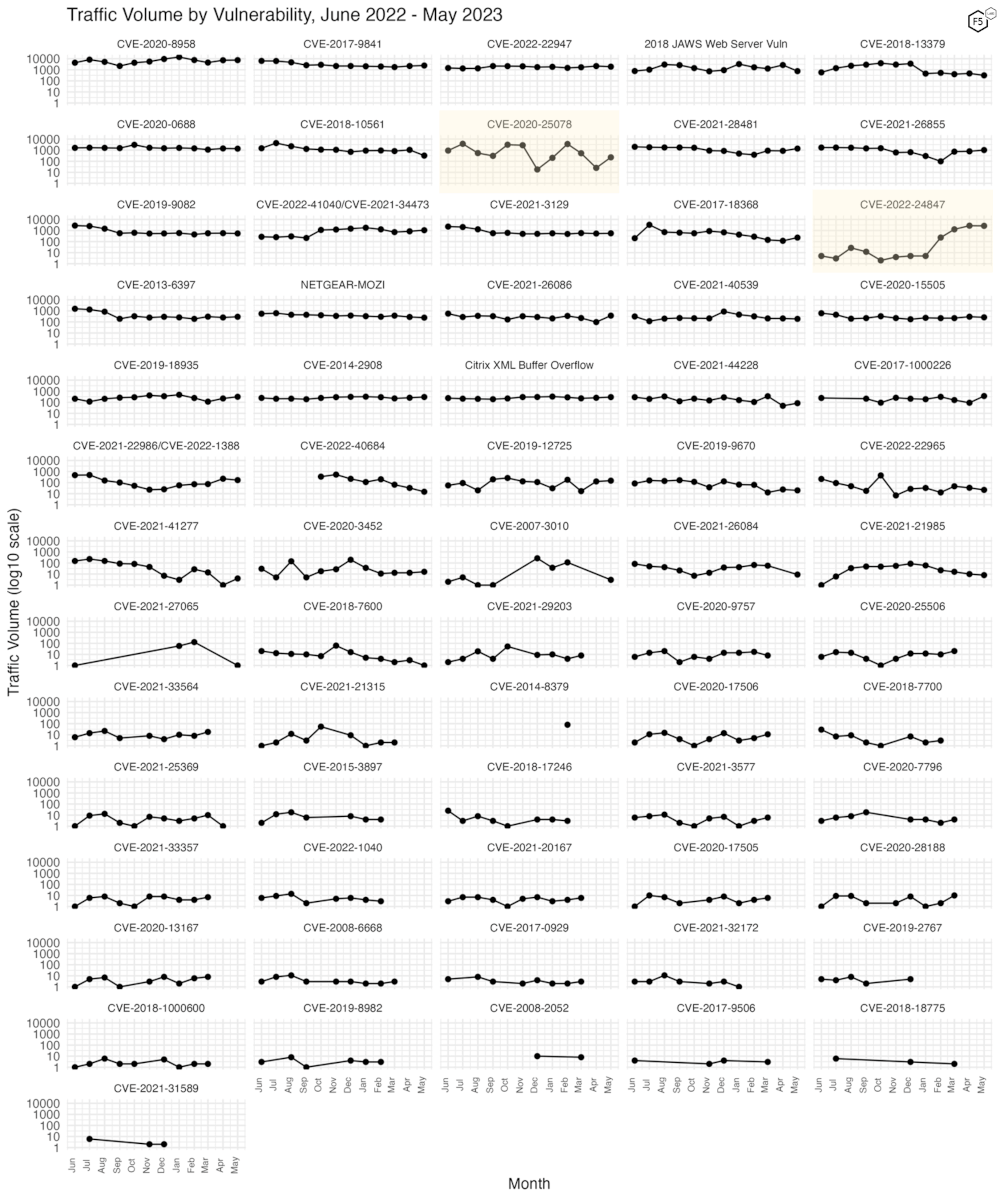
Figure 3. Traffic volume by vulnerability. May 2023 did not feature many vulnerabilities with significant change. One of our newest additions, CVE-2022-24847, leveled out after growing dramatically over the previous three months.
Conclusions
Another interesting thing about this month’s data is that our signatures happen to include the CVE with the single highest EPSS score and percentile in the dataset as of June 1: CVE-2018-7600. This is a remote code execution vulnerability in various versions of Drupal, and has a CVSS v3.x score of 9.8 (critical). However, despite the high probability of exploit, this seemingly nasty vulnerability’s attack activity was scant in our records, with May traffic against it totaling… one connection. By comparison, April was a bloodbath, featuring three connections (!).
It is tempting to interpret this kind of disparity between different intelligence sources as a sign that one, or both, are skewed or just wrong. In reality they are merely partial in different ways: the signals that we analyze for the SIS are real field observations, but represent a tiny slice of attack traffic on the Web. In contrast, EPSS’ scores are directly generated according to leading indicators, not real attack activity, although observed attacks constitute the training data that is used to weight the various indicators. In short, different kinds of sources like this should always be used complementarily, which is what makes the fact that EPSS is open-source particularly useful. We hope our own sensor intelligence is useful as well. And with that, we’ll see you in July.
Recommendations
- Scan your environment for vulnerabilities aggressively.
- Patch high-priority vulnerabilities (defined however suits you) as soon as feasible.
- Engage a DDoS mitigation service to prevent the impact of DDoS on your organization.
- Use a WAF or similar tool to detect and stop web exploits.
- Monitor anomalous outbound traffic to detect devices in your environment that are participating in DDoS attacks.


