This content has been updated to add more information on the state of EPSS and how to integrate it into your environment.
Summary
- It’s infeasible to patch all the open and critical-rated vulnerabilities in our systems.
- There is a provably more effective way to predict which vulnerabilities will be exploited that is superior to dead reckoning.
- Cyentia and Kenna teamed up to analyze several years of vulnerability data using machine learning to create a predictive model.
- Using something as simple a few free web sources and a spreadsheet, security teams can use this model to predict which vulnerabilities should be prioritized.
- This model can even be used with qualitative metrics for those who don’t like math.
Too Many Vulnerabilities, Not Enough Time
In 2018, 14,238 vulnerabilities were released1. Think about it: That’s nearly 275 vulnerabilities a week that need to be examined, vetted, prioritized, and possibly patched. It’s no wonder that vulnerability teams are extremely busy. We need an effective vulnerability prioritization process to sort out which of these vulnerabilities actually represent a danger to our organizations.
Many operational teams simply prioritize based on the criticality rating of the vulnerability itself. However, the same analysis of the vulnerabilities found that 55% of them were rated critical or high. That means, on average, every 8 to 9 hours, a significant vulnerability is released. That is still an overwhelming continuous flood to keep up with. But do you need to patch them all? Research by the Cyentia Institute found that only somewhere between “2 to 5% of CVEs are (detected as) exploited in the wild.”2
A Data-Driven Approach to Vulnerability Management
Ideally, we patch only the vulnerabilities that would actually be exploited to cause a security incident. Patching anything else is unnecessary work. But analysis is needed to tell which vulnerabilities should be patched and which will be ignored by attackers. Many IT and security teams prioritize patching using the Common Vulnerability Scoring System (CVSS) rating of 1 (lowest) to 10 (most severe). But in 2013, Mike Roytman of Kenna Security and Dan Geer of In-Q-Tel published an article showing how CVSS is a flawed system for prioritizing patching. Specifically, their analysis showed that "a high CVSS score does not imply impending risk in need of immediate mitigation."3 Instead, published exploit code was a better indicator of likely attack than vulnerability severity scoring.
The latest research in this area was released at Blackhat 2019 by Mike Roytman and Jay Jacobs of the Cyentia Institute in a presentation called “Predictive Vulnerability Scoring System,” which unveiled their “Exploit Prediction Scoring System (EPSS)” model.4
To build this model, they looked at 25,159 vulnerabilities published by MITRE’s Common Vulnerability Enumeration (CVE) over a two-year window between June 1, 2016 and June 1, 2018. This was compared against 921 observations of exploitations in the wild during the same period. The data was crunched and analyzed using machine learning to find which aspects were tell-tale signs of exploitation. Like most machine learning derived results, most of the key measures made sense but there were a few interesting nuances as well.
Finding the Likelihood of Exploitation of a Vulnerability
Based on the machine learning analysis, there were 16 significant factors usable to determine predictability.5 Each of those factors carries either a positive (more likely) or negative (less likely) weight towards predictability. Table 1 list those factors.
| Factor | Weight |
| Is this a vulnerability in a Microsoft product? | 2.44 |
| Is this a vulnerability in an IBM product? | 2.07 |
| Has vulnerability been weaponized as an attack tool exploit? | 2.00 |
| Is this a vulnerability in an Adobe product? | 1.91 |
| Is this a vulnerability in an HP product? | 1.62 |
| Is there a proof-of-concept exploit for this vulnerability? | 1.50 |
| Is this a vulnerability in an Apache project? | 1.10 |
| Count of vendor references in the vulnerability | Log(count +1 ) * 1.01 |
| Does this vulnerability allow arbitrary code execution? | 0.57 |
| Can this vulnerability be exploited remotely? | 0.23 |
| Does this exploit cause denial of service? | 0.22 |
| Does this vulnerability impact web service? | 0.06 |
| Does this exploit cause memory corruption? | -0.20 |
| Can this vulnerability only be exploited locally? | -0.63 |
| Is this a vulnerability in a Google product? | -0.89 |
| Is this a vulnerability in an Apple product? | -1.92 |
Table 1. Factors and weights contributing to likelihood of exploitability of a vulnerability.
There are four major categories of factors: the affected software origination, the type of impact, how the vulnerability can be exploited, and the count of references published with the vulnerability. In short, popular software that is easily remotely exploited to inject arbitrary code was more likely to be attacked. Note that none of these factors include the CVSS score, although some of the same factors that drive the CVSS score (such as exploit code, remote access) can also be found within the EPSS model.
The model works by tallying up all these weights and adding them to a base factor of -6.18 to get the LogOdds variable. The probability can be calculated with LogOdds with the formula 1 / (1 + e-LogOdds).
Collecting the Factors Related to the Exploitation of a Vulnerability
Let’s work through an example here with an eye towards how to measure each of these factors and perform the calculation. From 2019, we can look at CVE-2019-11043, a vulnerability in the web programming language PHP. Pulling up the National Vulnerability Database (NVD) entry for this at https://nvd.nist.gov/vuln/detail/CVE-2019-11043, we can get some basic information on the vulnerability as shown in Figure 1.
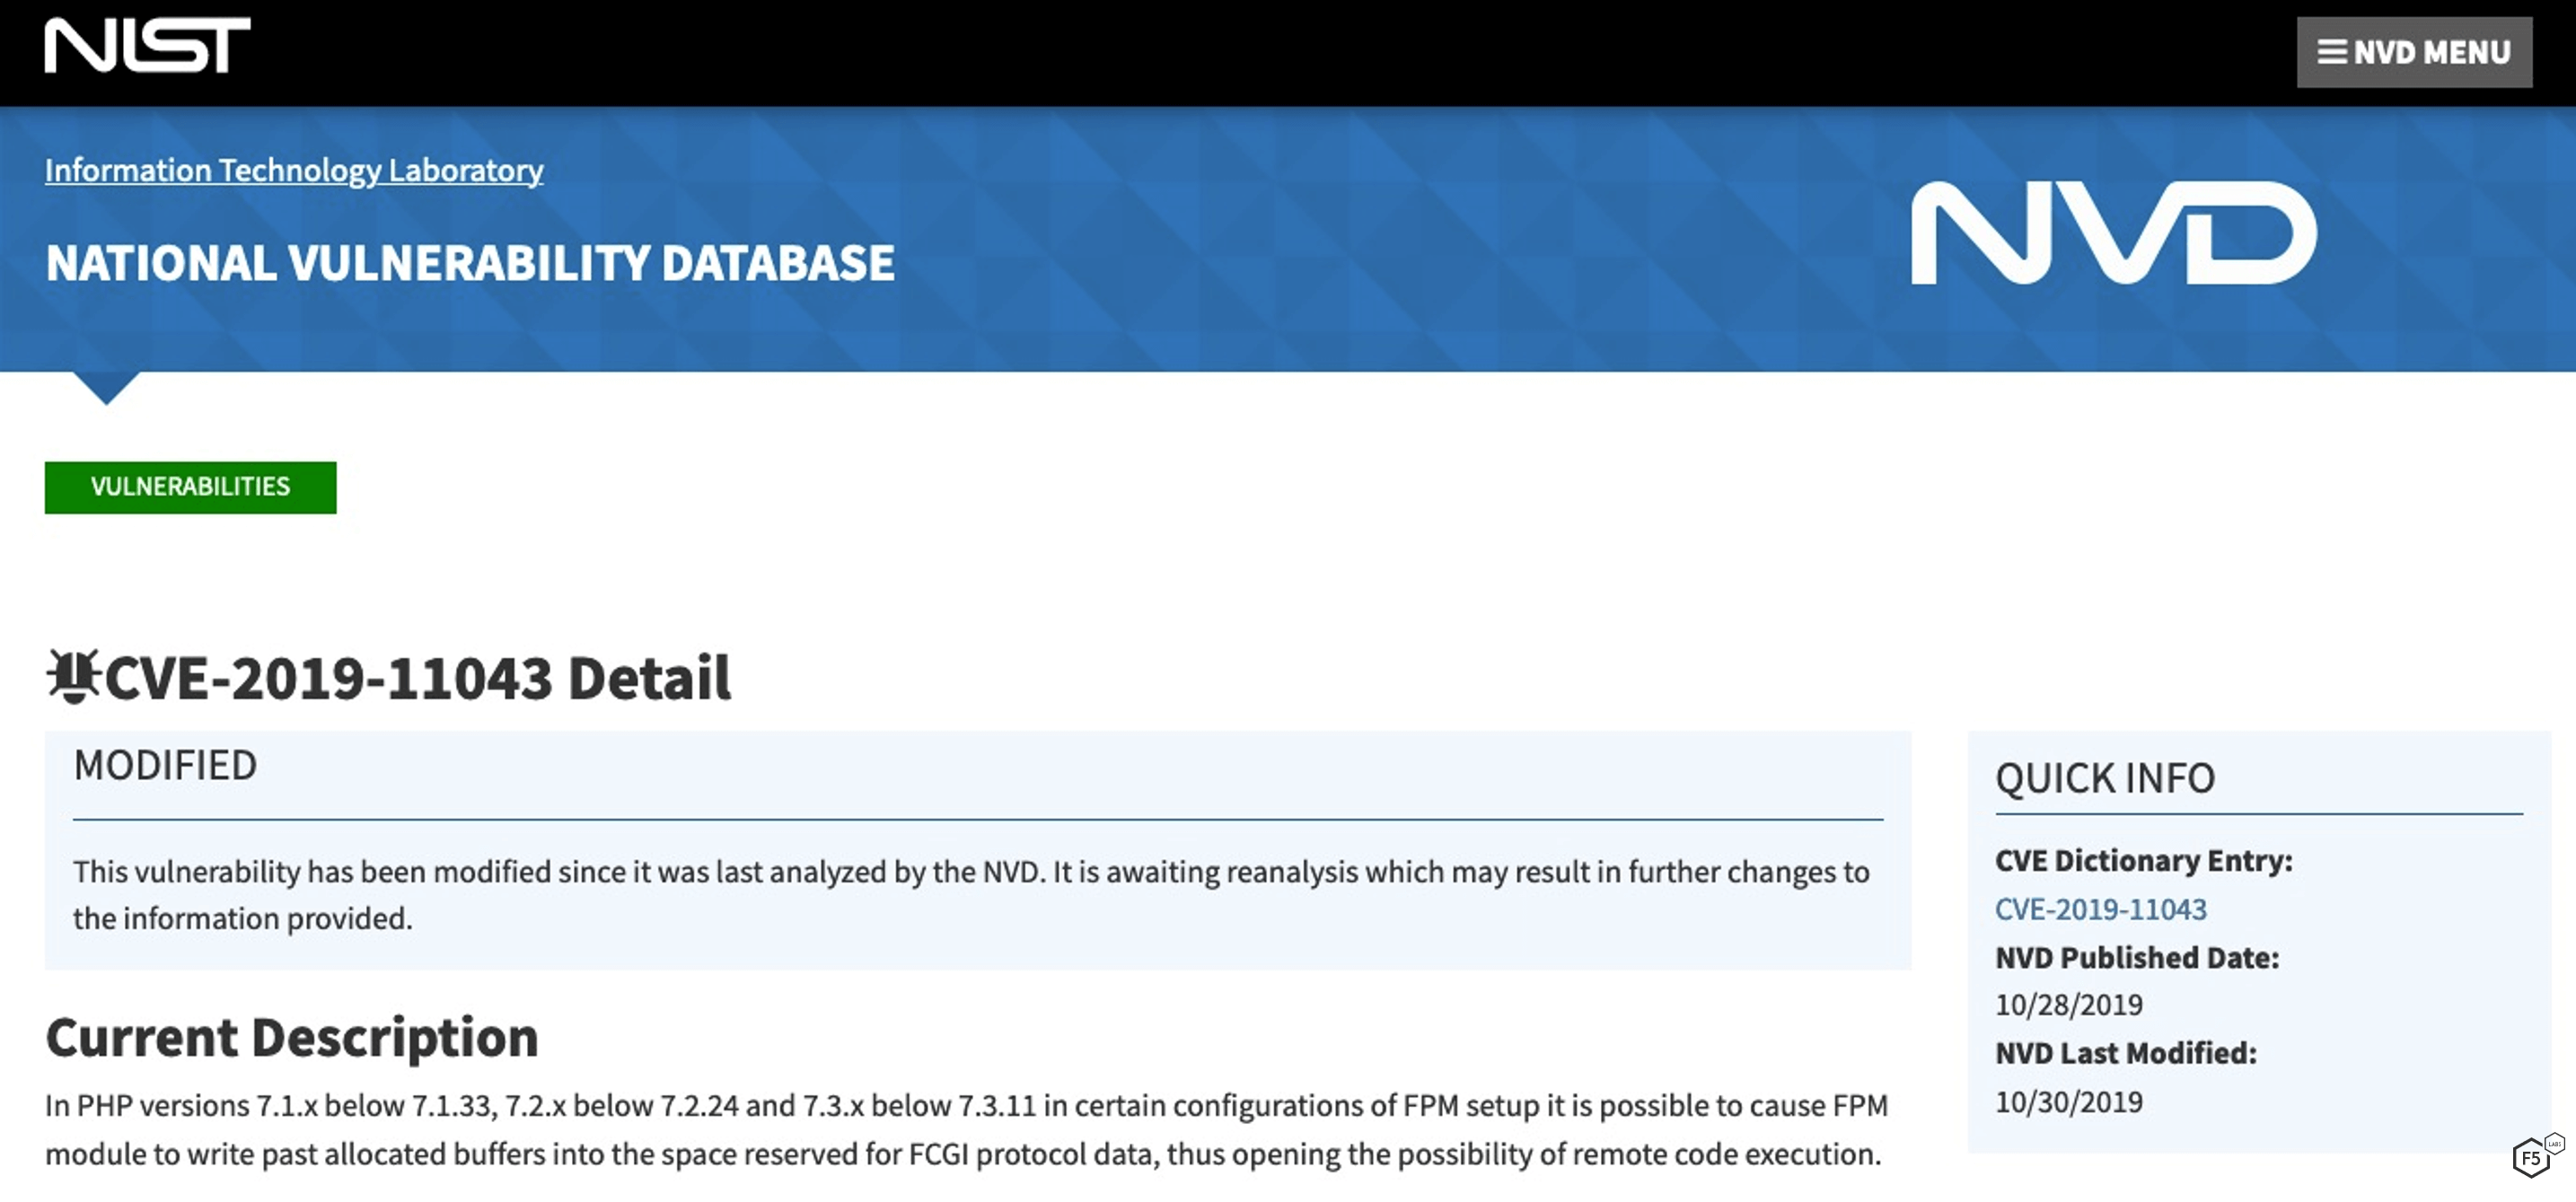
Figure 1. Description of CVE-2019-11043 at National Vulnerability Database site.
Right off the bat, PHP is a web service, so we can see that we can tick off one of the factors: "Does this vulnerability impact web service.” So that’s the first weight of 0.06.
Further down the page, there is a list of vendor references, some of which are shown in Figure 2.
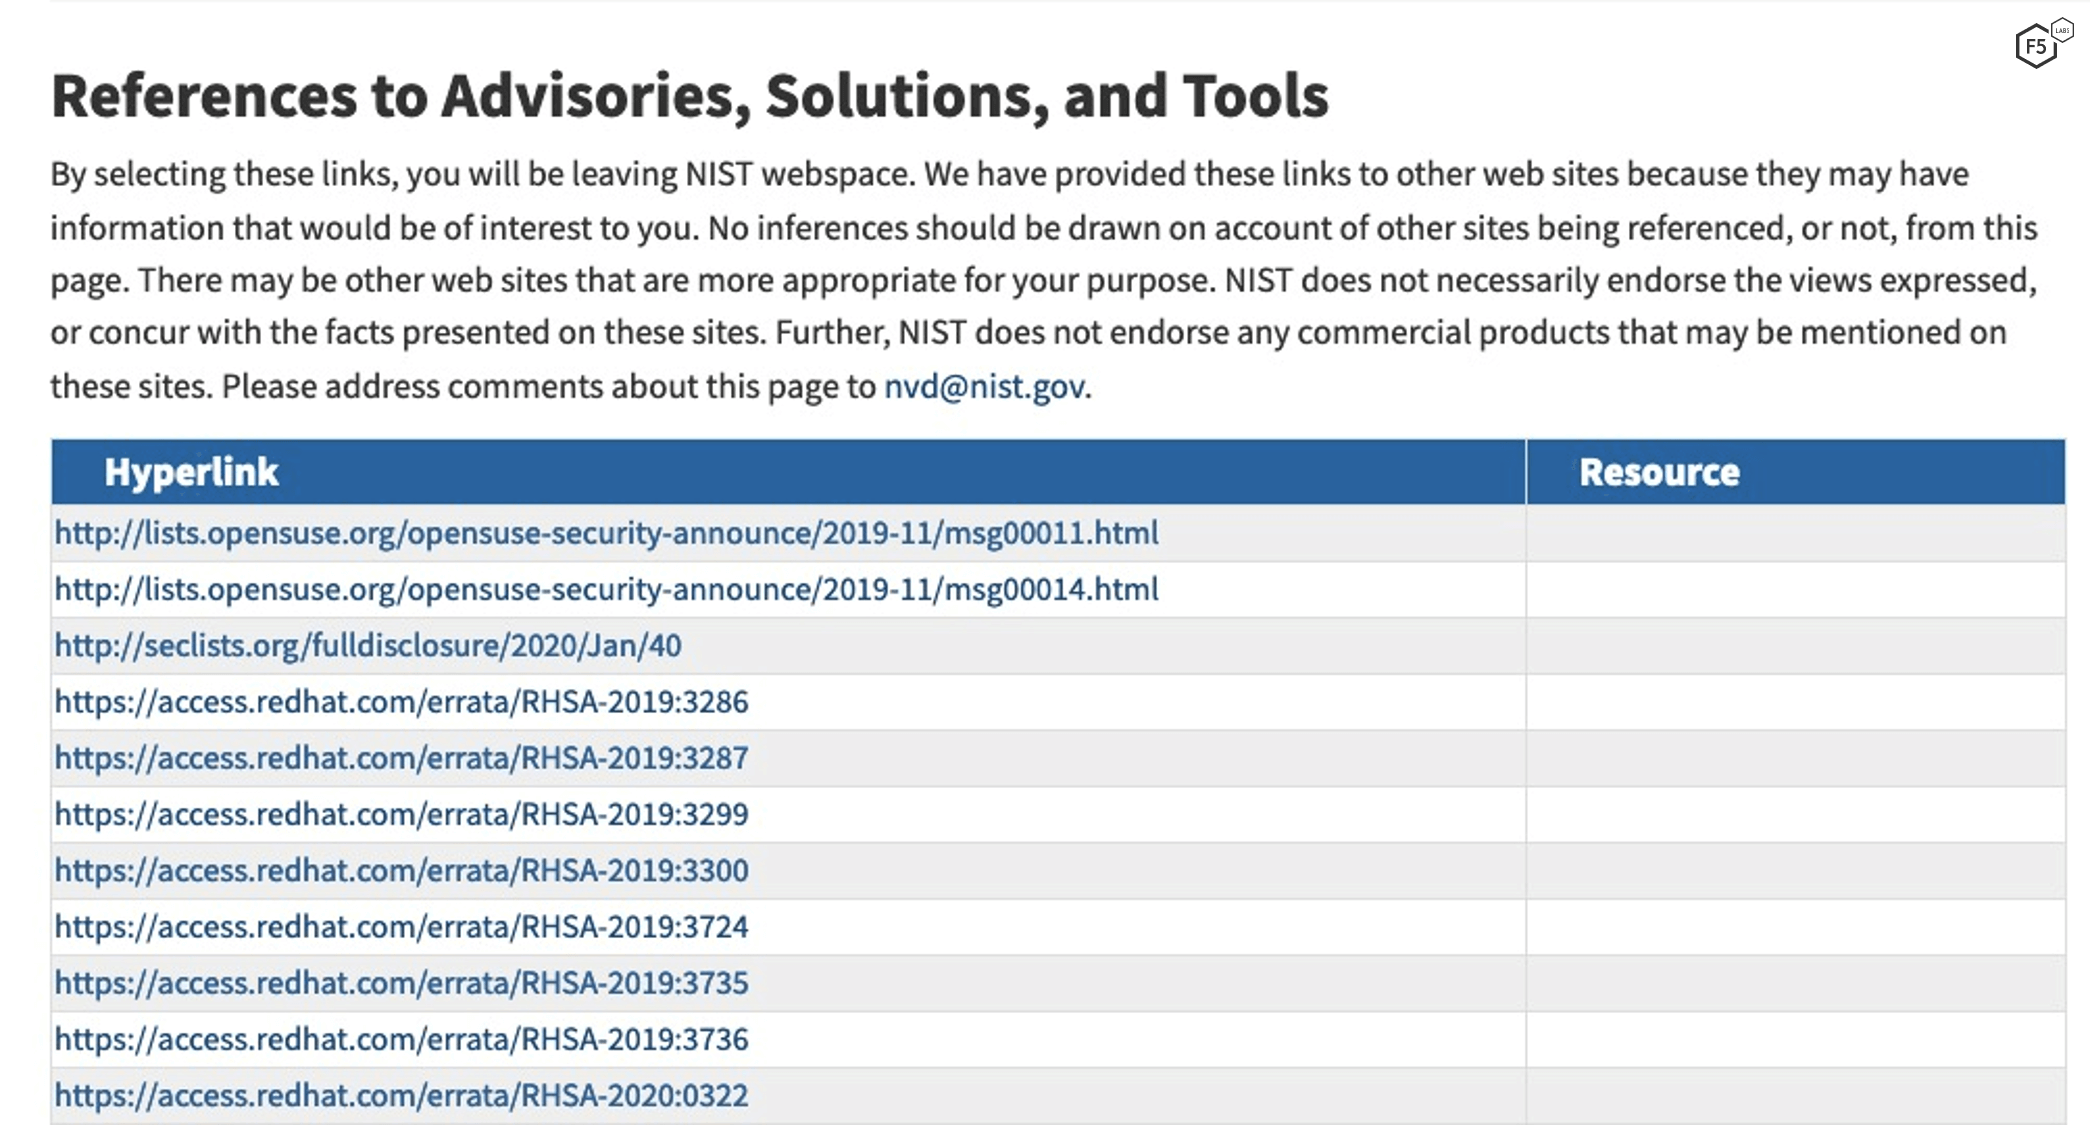
Figure 2. References for CVE-2019-11043 at National Vulnerability Database site.
We can simply count the number of references and see there are 25. In Excel, we can calculate the weight of these with “1.01*(LN(25+1))”, yielding 3.29.
Within those references, there are links to published exploits, as shown in Figure 3.

Figure 3. Exploit links for CVE-2019-11043 at National Vulnerability Database site.
Clicking on these links provides good vulnerability exploit information, as shown in Figures 4 and 5.
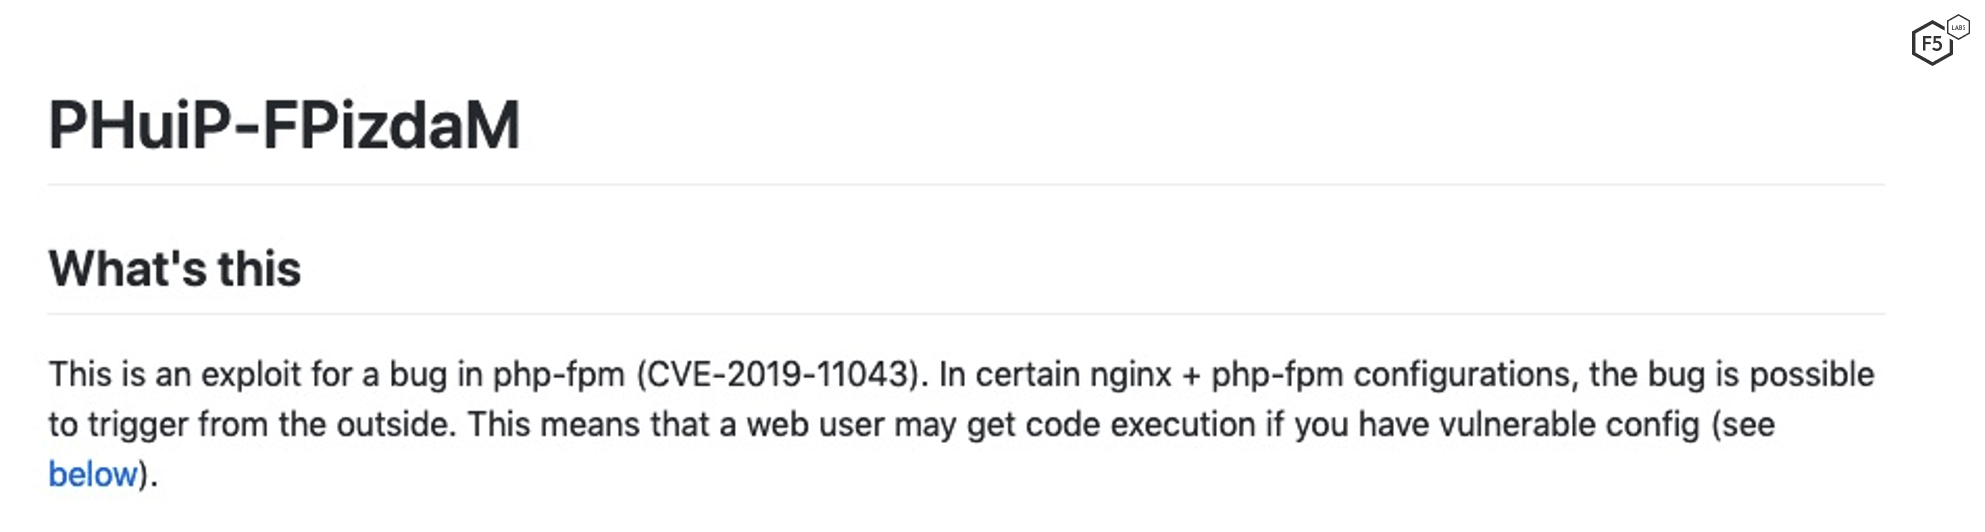
Figure 4. Exploit detail for CVE-2019-11043 from https://github.com/neex/phuip-fpizdam.
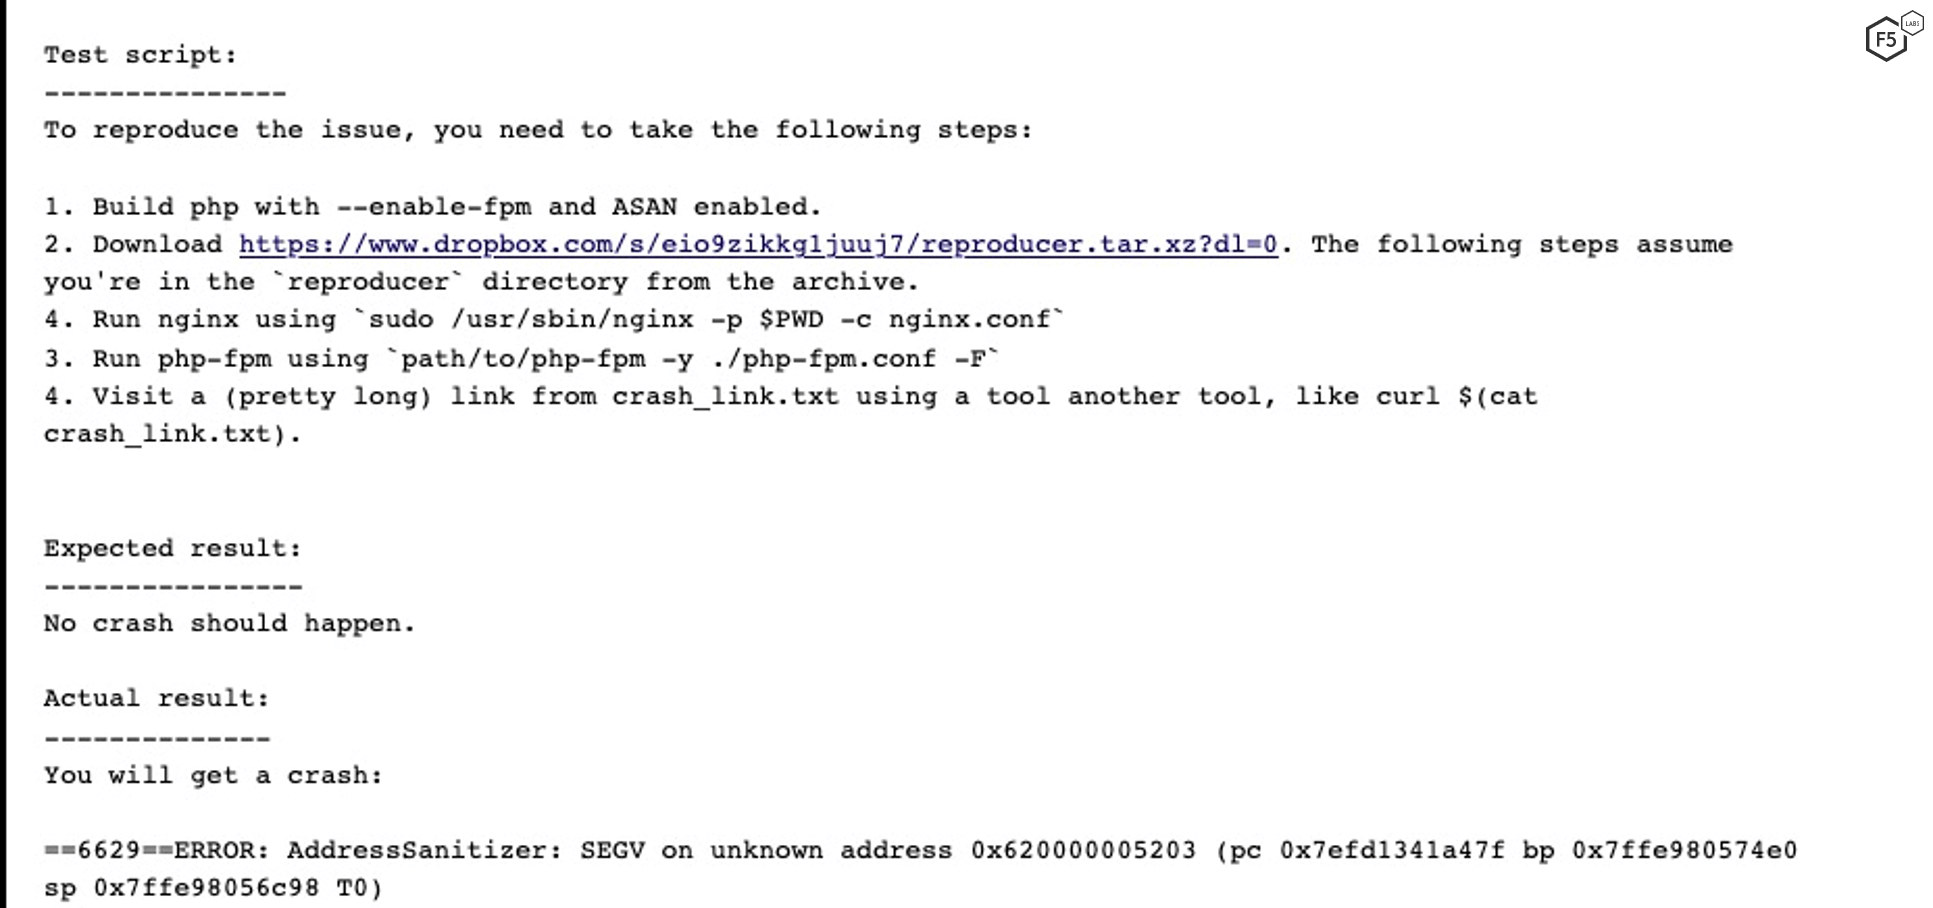
Figure 5. Exploit detail for CVE-2019-11043 from https://bugs.php.net/bug.php?id=78599.
The exploit descriptions provide more information for the other key factors. First, because there are exploits, we know factor “Proof-of-concept exploit available” is yes, adding a weight of 1.50. The first impact of the exploit shows that code execution is part of the payload, so “Enables arbitrary code execution” is a factor with a weight of 0.57. Continuing to read the second entry, we can see this can cause denial of service (“you will get a crash”), so another factor weight of 0.22. Lastly, the reproduction section shows that this works over the network, so add “Exploitable via remote access” with a weight of 0.23.
Even though there is a proof-of-concept exploit, we need to find out if this exploit has been weaponized. Per this model, weaponized exploits appear in “Rapid 7’s Metasploit framework, D2 Security’s Elliot Web Exploitation Framework, and the Canvas Exploitation Framework.” A quick check on the Rapid7 website shows 15 entries for CVE-2019-11043, as shown in Figure 6. This means we add a weight of 2.00.
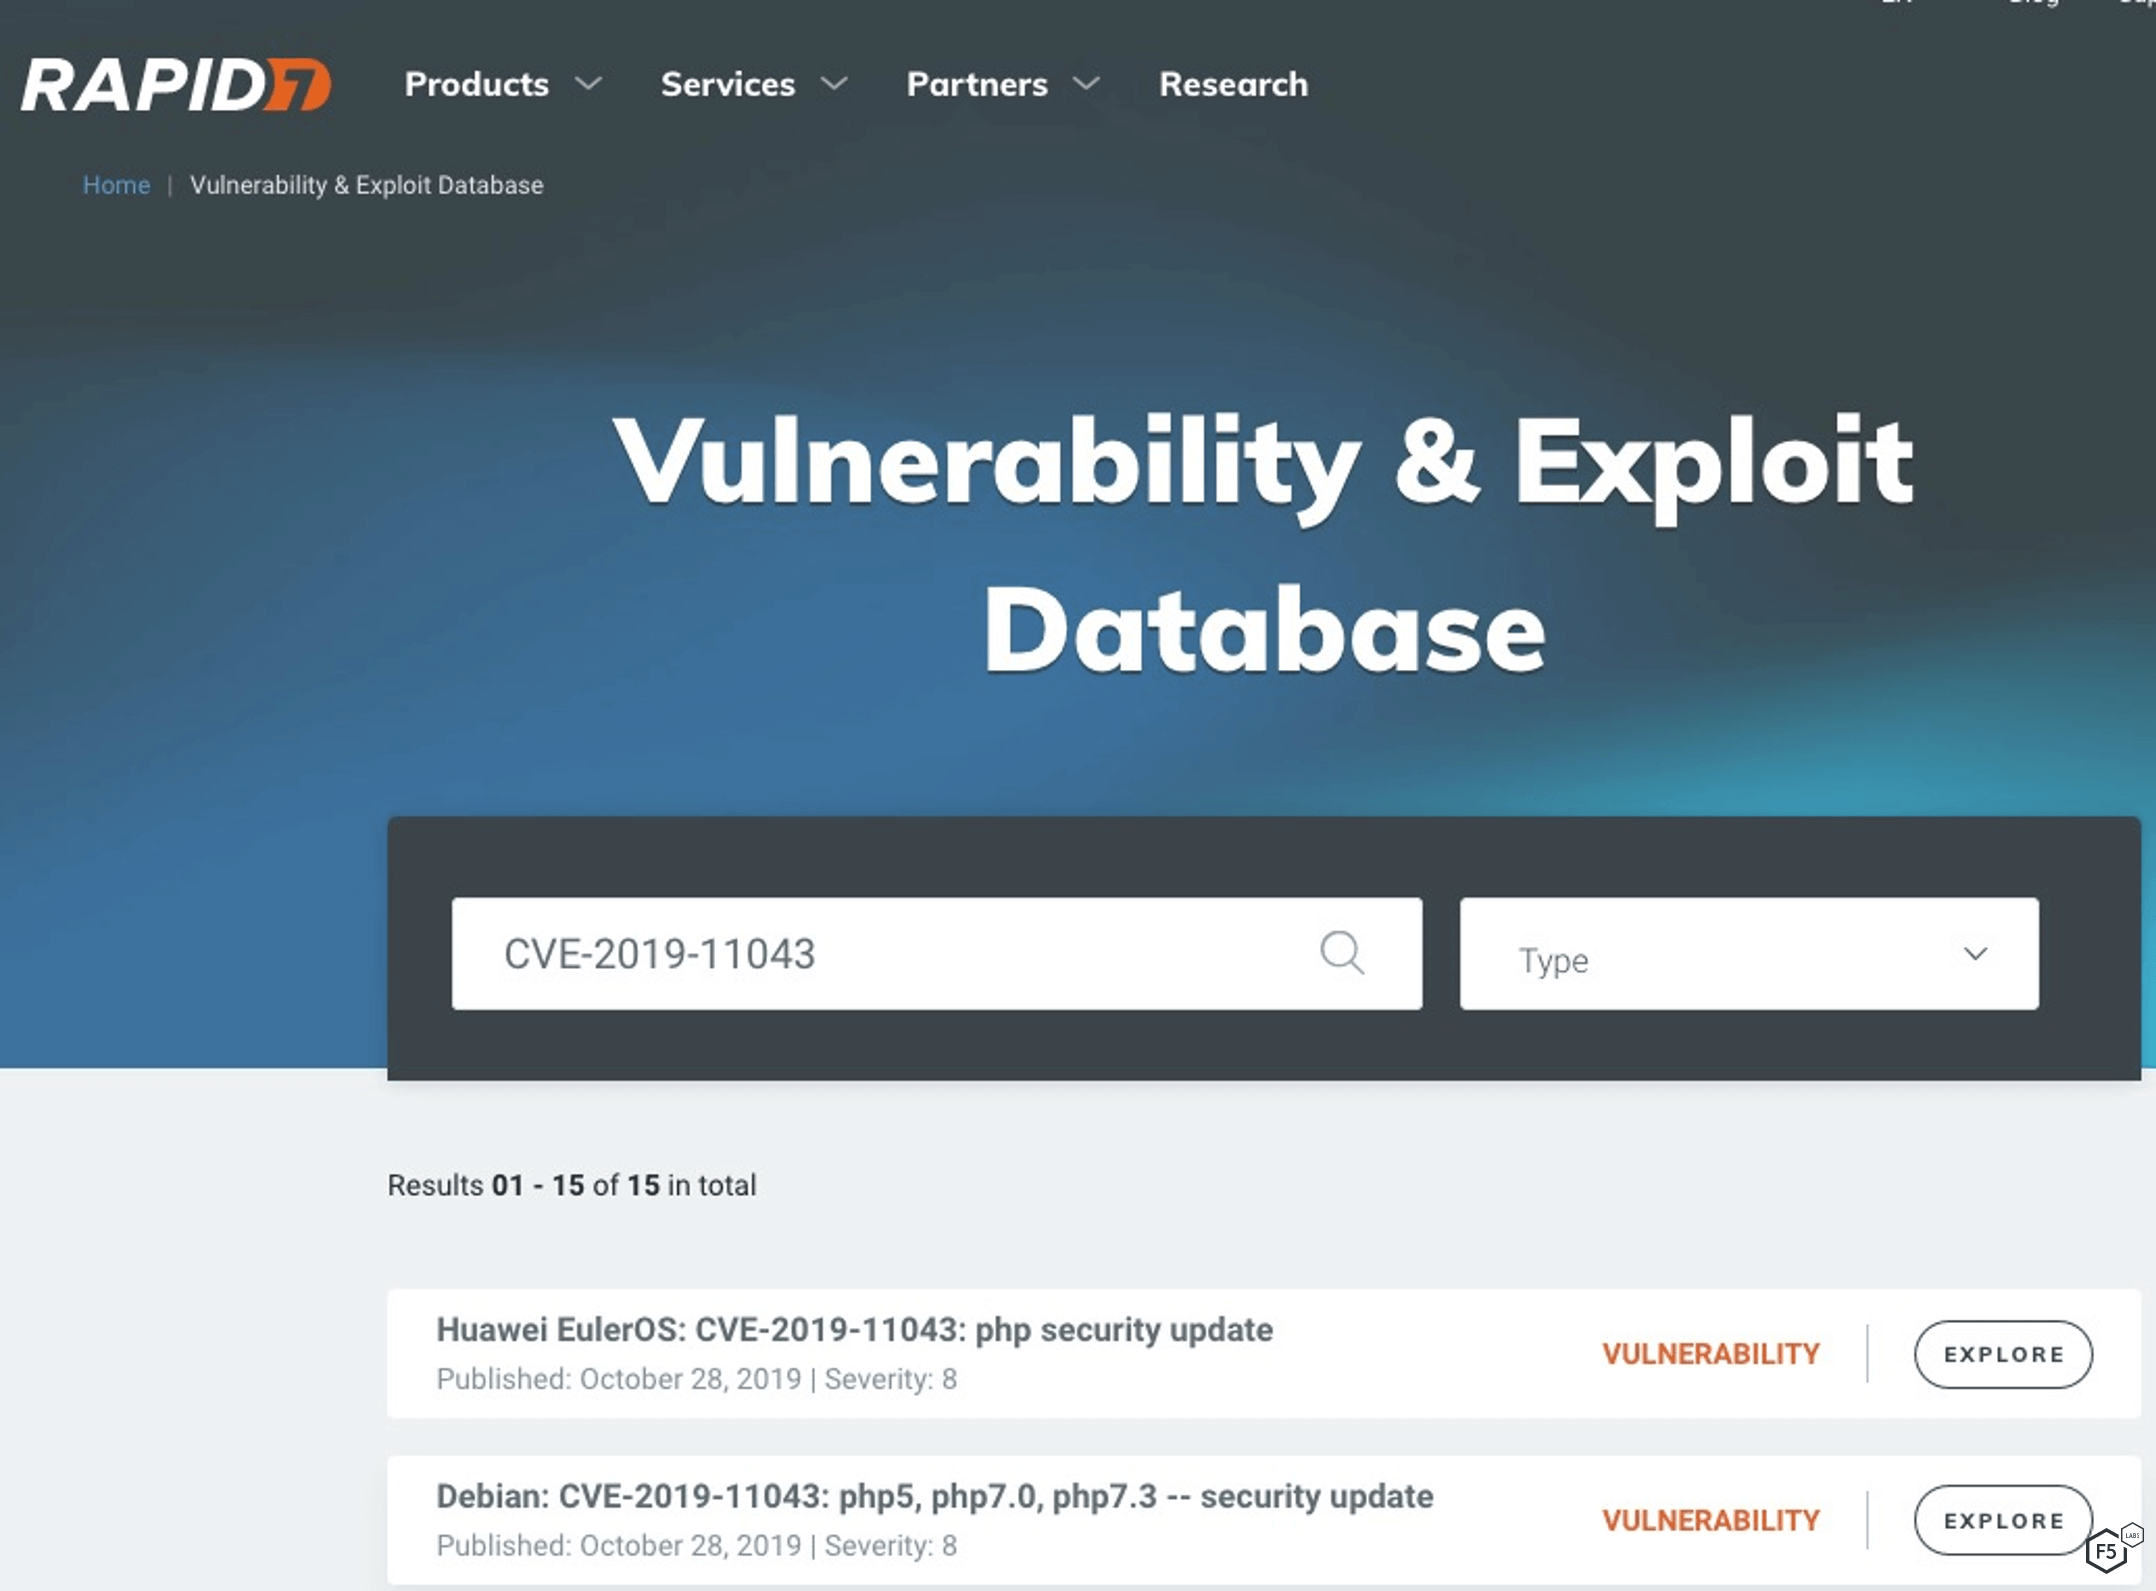
Figure 6. Rapid7 Weaponized Exploits for CVE-2019-11043 from https://www.rapid7.com/db/?q=CVE-2019-11043&q=CVE-2019-11043.
Now that we’ve learned what we can about the exploits, we can return to the NVD page. After the references, there is a list of affected software (a snippet is shown in Figure 7), which is another major factor.
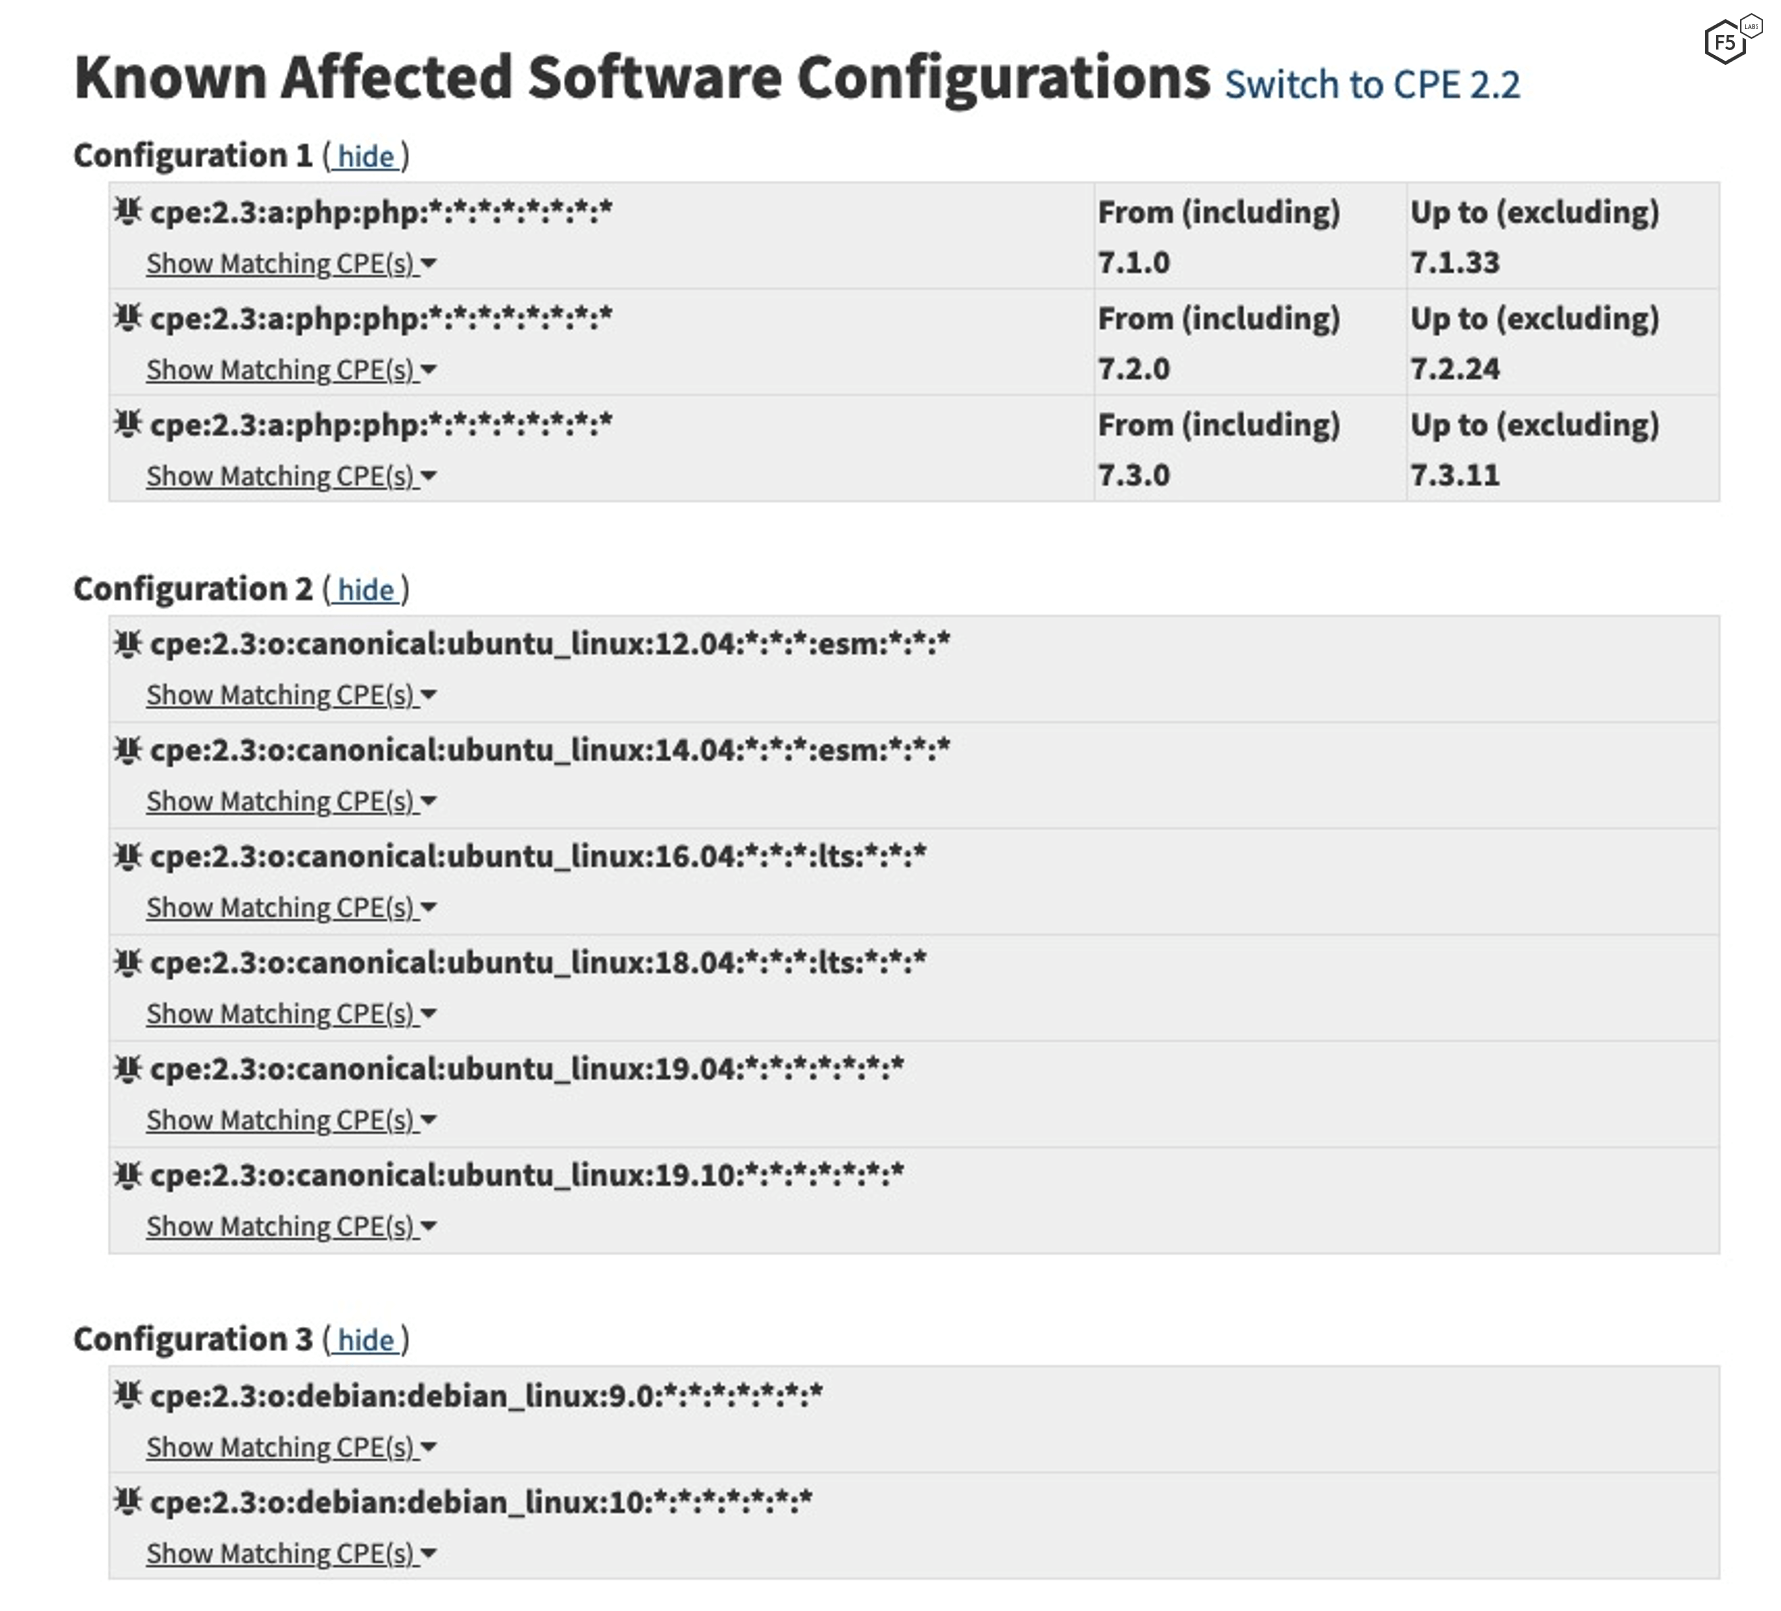
Figure 7. Affected software for CVE-2019-11043 at National Vulnerability Database site.
In this list, we don’t see any of the significant factored software types, so there are no weights to add here.
Calculating the Likelihood of Exploitation of a Vulnerability
Now that we have all our factors and weights, we can do some simple math in a spreadsheet.
| Factor | Weight |
| Base | -6.18 |
| Web related | 0.06 |
| Reference count of 25 => In Excel: 1.01*(LN(25+1)) | 3.29 |
| Proof-of-concept exploit available | 1.50 |
| Enables arbitrary code execution | 0.57 |
| Can cause denial of service | 0.22 |
| Exploitable via remote access | 0.23 |
| Weaponized Exploit | 2.00 |
Table 2. Factors and weights contributing to likelihood of exploitability of CVE-2019-11043.
Adding these numbers up, we get 1.69. To yield a probability, we need to run it through a log calculation which, in Excel, looks like: =1/(1+EXP(-3.07)). This comes out to 0.8443, which is a probability percentage, which translates to 84.4% Probability of exploitation in next 12 months. This is a higher priority patch. Looking at the factors, it appears that the highest significant factor is due to the widespread dispersal of this vulnerability, as counted in references, and the availability of exploits.
Measuring our Success
CVE-2019-11043 was released in late October of 2019. Even though the twelve months aren’t up yet, we have more information on this vulnerability. At the end of January, F5 Labs published Vulnerabilities, Exploits, and Malware Driving Attack Campaigns in December 2019 (/content/f5-labs-v2/en/labs/articles/threat-intelligence/vulnerabilities--exploits--and-malware-driving-attack-campaigns-in-december-2019.html). That update mentioned specific CVEs being targeted for attack (hint: this a great resource to use for patching priority, as well). One of the CVEs F5 Labs noted being exploited in the wild was CVE-2019-11043. Specifically, we saw two campaigns targeting ThinkPHP servers vulnerable to CVE-2019-11043. So yes, this vulnerability is getting attacked. In general F5 Labs sees a lot of PHP-related attack (/content/f5-labs-v2/en/labs/articles/threat-intelligence/application-protection-report-2019--episode-1--sensor-networks-r.html) traffic, so if we were to add a weight to this model, it would be one for PHP vulnerabilities.
Estimating the Likelihood without Using Math
That was a little bit of work (really about 10 minutes of lookups and a spreadsheet), but even that may turn some folks off. Just looking at this model, teams can easily improve their intuitive guesstimates with the following rule of thumb: The highest priority to patch should be for software from Microsoft, IBM, Adobe, or HP that has published exploit code that allows code execution.
The second most significant factor would be to look at reference count, or how widespread or embedded this vulnerability is across the technical landscape. After only about a half dozen references, the weighting for this factor gets significant.
Even though our example wasn’t from a major software source, the reference count and exploit code was enough to push this up to a higher probability.
All of these factors point at the economic rationality of attackers. They will go after vulnerabilities that are abundant, easily exploited, and allow them to quickly gain control of our systems. It’s a no brainer that these would be highly targeted.
The key contributor to this model, Kenna Security, hosts an easy-to-use calculator for the EPSS on its website,6 which is already pre-populated with major vulnerability entries.
Conclusion
An additional benefit from a simple, effective, and repeatable process like this is that it can be assigned to less-experienced security professionals or even automated. These are the kinds of benefits we wrote about earlier in how CISOs are using machine learning to augment security staffing shortages. The EPSS model is definitely something worth adding to the arsenal of security operational processes.
Update
The Exploit Prediction Scoring System (EPSS) is now part of FIRST (Forum of Incident Response and Security Teams), the custodian of the older model CVSS.
They now supply updated data to feed into your EPSS models here: https://www.first.org/epss/data_stats


