Introduction
This is the second of a series of articles tracking the amount of unwanted automation observed against F5 Bot Defense customers in different industries. Data used in this review is from F5 Bot Defense customers around the world but is heavily skewed towards North American customers. This review is meant to provide an overview of the amount of credential stuffing and other unwanted automation targeting various industries.
This review also tracks long-term automation trends for each of these industries. Such long-term trend data is helpful for security teams in various industries as they protect their applications. Security practitioners can tell whether their experience is in line with peers in their industry, as well as identify ways in which they can improve their security posture to make their organizations less attractive targets for unwanted automation.
The initial article was focused on the first half of 2023 with deep dives into particular industries and flows. A flow is defined as an application or API function e.g. Login, Sign Up, Search, Shop etc. These are functions that a given endpoint allows users to perform. This article covers the full year 2023 and dives deeply into the same topics. These reviews are not meant to be comprehensive reviews of all flows across all industries but aim to cover the most common industries and flows. Over time the list of industries and flows may be adjusted in response to audience feedback, so please feel free to reach out should you like to see specific data added to this review.
Automation Overview
Below we will look at unwanted automation from the standpoint of industry targeting, platform targeting (web vs mobile), and function (or flow) targeting, such as login or checkout.
Automation by Industry
Figure 1 below gives an overview of the average proportion of unwanted Web and Mobile API automation observed for calendar year 2023 across 13 industry verticals. Overall, automation levels ranged from 0.2% Mobile API automation on Insurance companies to 42.6% against the Healthcare industry’s Web applications. Insurance Mobile API and Healthcare Web applications were also the least and most attacked applications in the H1 2023 Bad Bot Review.
Over 2023, we observed consistently higher levels of automation against Web applications than against Mobile APIs. This is consistent with the findings in the 2023 Identity Threat Report: The Unpatchables. Figure 2 and Figure 3 below are extracted for this review.
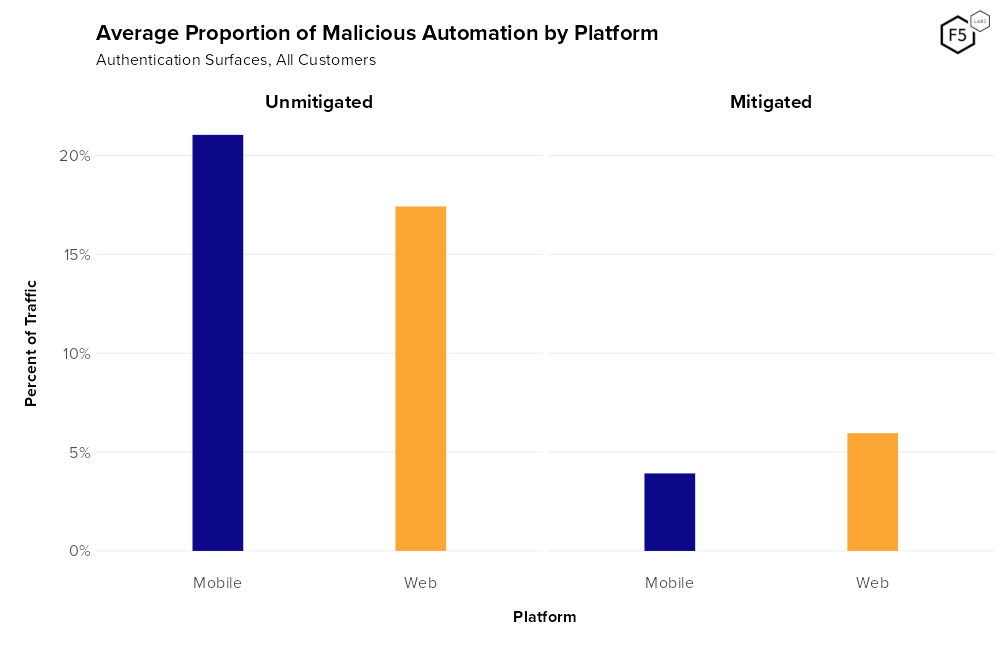
Figure 2. Average proportion of malicious automation targeting authentication, split by Web and Mobile traffic.
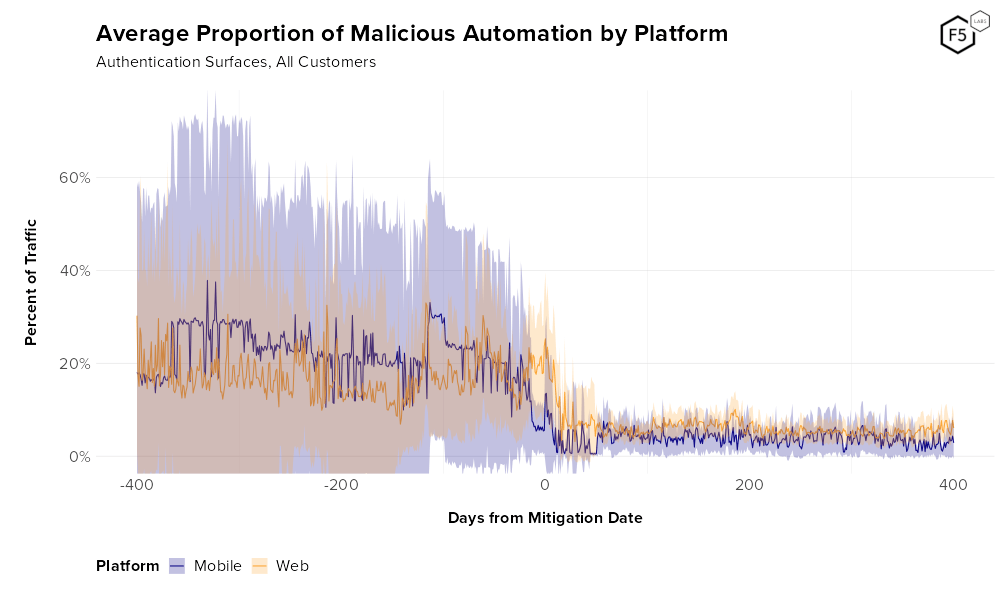
Figure 3. Timeseries of malicious automation against authentication, split out by Web and Mobile traffic. 95% confidence interval shown.
After analyzing traffic from 159 bot defense customers, this review found that in the absence of a bot defense solution, Mobile APIs experience significantly more automation than Web applications. However, once a bot defense solution is deployed in mitigation/blocking mode, we see a reversal, with Web having higher levels of persistent attacks despite consistent mitigation. Figure 2 shows that pre-mitigation, Mobile APIs experience on average 21.0% automation compared to 17.4% for Web applications. Post-mitigation, the percentage automation falls drastically for both Web and Mobile as attackers give up and others try to retool past mitigation. Automation levels of 3.9% for Mobile APIs, compared to 6.0% for Web applications were observed.
A hypothesis for why this is the case is that Mobile APIs tend to be more homogenous than Web applications. As a result, attack tools designed for attacks against one company’s Mobile APIs can easily be pointed at a different company with minimal customizations. As a result, the barrier to entry for attacks against Mobile APIs is low, resulting in higher levels of automation pre-mitigation compared to Web. Once mitigation/blocking is enabled, Mobile attackers find it easier to simply point their attack tools towards an unprotected target rather than retool, as the effort of such retargeting is minimal. On the other hand, Web attackers invest a lot of effort to customize their tools for each website and hence are unwilling to abandon all their hard work once they are mitigated. They therefore tend to persist a bit more despite mitigation as the effort of moving to another target is significant. This results in post mitigation automation being higher on Web than on Mobile. This is our working theory that explains this phenomenon. It is, however, difficult to know for sure what causes this observation.
Because the majority of Bot defense customers are in mitigation/blocking mode, it therefore makes sense that Figure 1 shows higher levels of automated attacks against Web applications compared to Mobile APIs.
Industry Trend Analysis
Our analysis showed that there are fluctuations in the level of automated attacks for each industry from month to month (as shown in Figure 4 and Figure 5 below). There are, however, some strong patterns in the proportion of unwanted automation by industry. There are several factors that affect how much automation we see on a given enterprise and by aggregation in each industry:
- Value – What is the payout of using automation against the given enterprise? What kinds of money, stored credit cards, gift cards, miles, points, discounts, services, etc., can be stolen from hacked accounts? What is the payout of success?
- Security – How well defended are enterprises in this sector? Do they have large security budgets and teams? How long will it take for fraudulent activities to be detected — in short, what is the probability of success?
- Risk – What is the probability of being identified and what are the consequences if identified?
- Deterrence (length of protection) – How long have strong defenses been in place? Have existing anti-bot defenses successfully mitigated and deterred attackers? (New Bot Defense customers tend to have higher automation percentages than those that have been protected for longer. The mix of new and old customers in each industry may also impact the industry automation overview in Figure 1, though this impact will decrease over time.)
Using this factor list, we can explain why the Airline industry, for example, is one of the most attacked. The demand for airline miles is huge and attackers that take over large numbers of airline accounts can accumulate large amounts of miles that can be used to purchase flights and first-class upgrades that have a ready market. The value of the attacks against the airline industry is very high, leading to high attack volumes. Airline flight ticket pricing is often opaque, which creates a large market for flight comparison and flight ticket hacking companies that try to game the system to get travelers the cheapest possible tickets. These companies are well resourced, highly motivated, and send a lot of automated traffic against the Airline’s flight search, seat map, and other flows.
On the other end of the percentage automation spectrum are insurance companies. The value to be gained from taking over a person’s insurance login is minimal. This low value and high risk associated with prosecution for insurance fraud makes this an unattractive industry for attackers. Insurance companies employ teams of investigators to analyze and go after fraud which makes this a risky undertaking for a very limited payout.
Web
Figure 4 below gives the 2023 trend in Web automation (%) for the 13 industries highlighted in Figure 1 above. The image legend is sorted from highest to lowest automation (%) based on December 2023 numbers for ease of reference.
Throughout 2023, we observed several interesting industry trends in Web automated attacks. These trends can be gleaned through a thorough analysis of Figure 4 above and the corresponding table of values (Table 1). It is hard to explain a lot of these trends as they are often influenced by large events like sales or major marketing events (e.g., Black Friday, Cyber Monday, back-to-school, Memorial Day), summer holiday travel, mergers and acquisitions, changes in applications and security posture, breaches, and credential leaks. They can also be influenced by less obvious factors, such as a new advanced persistent threat actor targeting a specific industry, a new automation tool or technique, or an increase or decrease in the underlying enterprise base for that industry. This data is therefore meant to be directional, and to allow security teams to see if their experience is indicative of wider industry factors or is unique to their own enterprise.
We will, however, highlight the top 4 trends observed over the year in Web automation:
- Healthcare had the highest levels of unwanted Web automation (except for a dip in May). Automation against Healthcare Web applications continued to rise, peaking at 54.0% in December 2023. Most of this automation, as we shall reveal later, was primarily web scrapers targeting healthcare provider search pages.
- The Hospitality industry has seen a steady increase in automation, starting off as the eighth most targeted industry in January 2023 with 11.7% automation. Attacks against customers in this industry started to rise markedly in April, coinciding with the beginning of bookings for summer holiday travel. Attacks against hospitality companies peaked at 41.8% in September.
- A similar trend to the hospitality industry was observed in the Airline industry which started off with 19.7% automation in January, peaking at 33.1% also in September 2023, in line with the summer holiday travel trend.
- Credit unions, despite being one of the least targeted industries throughout the first half of 2023, saw a marked rise in attacks between June and July 2023, increasing from 1.2% automation in May to 6.8% in June and 6.3% in July, before going back down to 0.9% in August.
Tables 1 and 2 below give the raw numbers used to create Figure 4.
| Industry | Jan | Feb | Mar | Apr | May | Jun |
| Healthcare | 44.90% | 50.90% | 44.30% | 45.10% | 27.30% | 40.20% |
| Hospitality | 11.70% | 14.80% | 18.70% | 16.80% | 24.70% | 30.50% |
| Telecom | 24.80% | 20.90% | 22.00% | 26.10% | 27.50% | 25.30% |
| eCommerce | 14.80% | 33.90% | 19.60% | 12.30% | 21.60% | 15.00% |
| Airline | 19.70% | 22.00% | 16.90% | 21.70% | 17.70% | 17.60% |
| Fashion | 21.10% | 23.00% | 18.90% | 17.70% | 24.10% | 16.00% |
| Grocery | 21.30% | 19.10% | 32.10% | 17.40% | 32.20% | 16.30% |
| Entertainment | 7.60% | 7.80% | 14.00% | 15.30% | 19.00% | 9.80% |
| State/Local Gvt | 3.30% | 4.10% | 22.30% | 12.30% | 6.80% | 6.40% |
| QSR | 16.50% | 10.00% | 12.40% | 5.40% | 5.90% | 4.70% |
| Bank | 3.80% | 3.80% | 6.40% | 7.60% | 4.30% | 3.30% |
| Credit Union | 1.10% | 2.30% | 1.10% | 1.10% | 1.20% | 6.80% |
| Insurance | 1.00% | 5.50% | 0.90% | 1.30% | 2.00% | 2.30% |
Table 1. Average malicious Web automation for 2023 (Jan-Jun), by industry.
| Industry | Jul | Aug | Sep | Oct | Nov | Dec |
| Healthcare | 46.58% | 36.40% | 42.50% | 38.10% | 41.00% | 54.00% |
| Hospitality | 23.53% | 35.90% | 41.80% | 33.80% | 33.60% | 30.10% |
| Telecom | 23.15% | 18.80% | 17.60% | 21.20% | 19.00% | 20.60% |
| eCommerce | 14.51% | 23.50% | 25.10% | 20.20% | 21.60% | 18.00% |
| Airline | 24.63% | 29.40% | 33.10% | 10.20% | 10.80% | 13.40% |
| Fashion | 22.28% | 22.80% | 21.80% | 18.60% | 12.00% | 9.80% |
| Grocery | 9.44% | 6.80% | 5.30% | 8.60% | 10.20% | 8.40% |
| Entertainment | 9.62% | 2.60% | 14.30% | 7.70% | 4.00% | 1.80% |
| State/Local Gvt | 6.92% | 7.70% | 10.30% | 2.20% | 10.50% | 2.40% |
| QSR | 4.00% | 3.60% | 3.30% | 2.70% | 5.00% | 8.50% |
| Bank | 4.09% | 5.20% | 4.50% | 2.60% | 3.70% | 3.10% |
| Credit Union | 6.36% | 0.90% | 1.10% | 1.20% | 4.70% | 2.90% |
| Insurance | 2.97% | 2.00% | 2.10% | 2.50% | 3.30% | 2.70% |
Table 2. Average malicious Web automation for 2023 (Jul-Dec), by industry.
Mobile
The 2023 Mobile API automation (%) industry trend is shown in Figure 5 below.
Similar to the Web automation trends, there are many interesting trends to be gleaned from the data. However, we will highlight the top 4 trends observed.
- Entertainment is far and away the most targeted industry on Mobile. This includes attacks against streaming services’ Mobile APIs. The attraction of these kinds of attacks and the high resell value of compromised user accounts in this sector is clear.
- Airlines had the second most targeted Mobile APIs. The automation against this industry’s Mobile APIs follows the same trend as attacks against its Web applications, with automation increasing from 7.1% in January and peaking at 17.6% in September. Automation for the airline industry showed a significant increase in line with summer holiday travel.
- Healthcare, Ecommerce and grocery retail industries saw a spike in automated attacks in March 2023.
- Telecom and Airline industries also saw a spike in automated attacks against their Mobile APIs in April and September 2023.
Tables 3 and 4 show the raw data used for Figure 5.
| Industry | Jan | Feb | Mar | Apr | May | Jun |
| Entertainment | 43.60% | 35.50% | 41.96% | 34.93% | 42.87% | 45.48% |
| Airline | 4.30% | 5.40% | 1.24% | 6.63% | 3.40% | 9.63% |
| Fashion | 3.20% | 24.00% | 13.60% | 14.02% | 16.33% | 17.47% |
| Telecom | 11.40% | 5.10% | 6.58% | 13.92% | 5.35% | 7.67% |
| Healthcare | 0.70% | 0.60% | 21.42% | 0.31% | 0.87% | 0.33% |
| eCommerce | 1.90% | 2.00% | 8.63% | 1.18% | 1.73% | 0.63% |
| Hospitality | 1.20% | 1.20% | 1.03% | 1.30% | 1.22% | 1.35% |
| Grocery | 2.50% | 5.90% | 4.69% | 0.64% | 0.56% | 1.42% |
| QSR | 0.60% | 0.60% | 0.72% | 1.64% | 1.24% | 1.11% |
| Bank | 0.70% | 1.80% | 0.97% | 0.19% | 0.33% | 0.55% |
| Credit Union | 1.30% | 1.00% | 0.29% | 1.85% | 0.38% | 0.19% |
| Insurance | 0.10% | 0.10% | 0.14% | 0.14% | 0.14% | 0.12% |
Table 3. Average malicious Web automation for 2023 (Jan-Jun), by industry.
| Industry | Jul | Aug | Sep | Oct | Nov | Dec |
| Entertainment | 31.28% | 24.75% | 34.93% | 38.30% | 36.30% | 34.10% |
| Airline | 6.78% | 7.11% | 17.61% | 15.30% | 15.00% | 5.50% |
| Fashion | 6.44% | 6.78% | 13.22% | 0.10% | 0.10% | 0.10% |
| Telecom | 3.58% | 4.45% | 7.93% | 5.90% | 3.70% | 4.00% |
| Healthcare | 0.12% | 0.11% | 0.23% | 2.80% | 3.27% | 0.10% |
| eCommerce | 0.45% | 0.84% | 0.60% | 0.40% | 2.00% | 2.80% |
| Hospitality | 1.30% | 1.44% | 1.39% | 1.40% | 1.90% | 1.90% |
| Grocery | 0.82% | 0.49% | 0.44% | 0.30% | 0.30% | 0.30% |
| QSR | 1.35% | 0.72% | 0.68% | 0.60% | 0.20% | 0.10% |
| Bank | 0.53% | 0.41% | 0.22% | 0.20% | 0.50% | 0.10% |
| Credit Union | 0.05% | 0.09% | 0.06% | 0.10% | 0.20% | 0.20% |
| Insurance | 0.12% | 0.46% | 0.38% | 0.20% | 0.20% | 0.20% |
Table 4. Average malicious Web automation for 2023 (Jul-Dec), by industry.
Automation by Flow
A flow is defined as an application or API function e.g. Login, Sign Up, Search, Shop etc. These are functions that a given endpoint allows users to perform. Different kinds of flows therefore attract different kinds of attackers, e.g. Login attracts credential stuffing and account takeover, while Product Search attracts scrapers and Shop flows attract sneaker and other reseller bots. A list of definitions for the flows included in this review have been provided in the Appendix. Figure 6, below, shows an overview of Web and Mobile API Automation (%) by flow for the full calendar year 2023.
Figure 6 is ordered in decreasing order of average unwanted automation % across both Web and Mobile. There are a few key takeaways from this analysis:
- The Search flows (that are most targeted by Web scrapers) have the highest levels of unwanted automation, with 20.1% of all Web traffic to these flows coming from automated scrapers. Scrapers tend to be significantly more active on Web than on Mobile APIs.
- Gift card flows (which include gift card balance check, buy gift card, redeem gift card etc.) experienced the second highest percentage of unwanted automation during the period. 21.1% of Web and 1.9% of Mobile API gift card transactions were unwanted automation. This shows evidence of the prevalence of gift card cracking bots against retailers in the Fashion, Grocery and QSR industries. These gift card bots tend to be more active during the last quarter of the year (holiday shopping period), when many people are buying gift cards and loading them with funds. As a result, gift cards were the 4th most targeted flow as at H1 2023 and in the second half of the year rose to become the second most targeted for the full year 2023.
- The third most targeted flows are Quotes flows specifically targeting Insurance companies. Rate scrapers are responsible for 15.1% of all Web insurance quotes. These bogus quotes cause a lot of problems for insurance companies and lead to the reverse engineering of their rate cards, which are insurance companies’ intellectual property.
- Shop flows (which include add to cart, checkout, shipping etc.) experienced the fourth highest percentage of unwanted automation during the period. 14.4% of Web and 9.3% of Mobile API Shop transactions were unwanted automation. This shows evidence of the prevalence of reseller bots against Shop flows. F5 Labs recently wrote an article series on these kinds of bots, including two case studies showcasing this activity. The article series can be found on our Bots and Automated Attacks Research Series page. Quote flows are the third most targeted with most automation against this flow being against Insurance quote flows.
Figure 7 below provides a heatmap showing which combinations of industries and flows receive the most automation for the full calendar year 2023. The color coding goes from yellow for low levels of automation (%) to purple for higher levels.
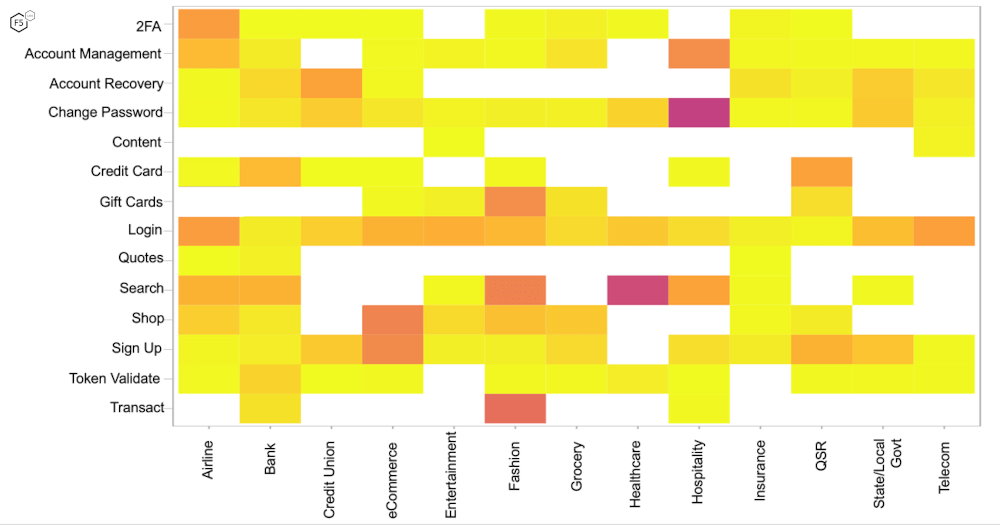
Figure 7. Heat map of malicious automation in 2023 by industry and flow (site function). Purple represents the highest level. Note that the blank spaces represent industry/flow pairs where we did not have sufficient data to provide statistically relevant information.
Some of the key industry – flow pairs that experienced the most automation were the following:
- Login is heavily targeted across all industries, with some industries experiencing heavier attacks than others, with Telecoms, Entertainment and Airlines being amongst the most attacked.
- Scrapers are also active across most industries with heavy automated activity against the Healthcare (rates and network scraping), Fashion (inventory, price and review scraping) and Airlines (inventory, price and seat availability scraping) industries.
- The hospitality industry’s change password flow is one of the most targeted. This is due to significant automated attacks that are attempting to take over user accounts, as well as the fact that the volume of legitimate users that change their password is very low. Most users would forget their passwords and go through the Reset Password flow. Very few users would proactively change their password.
- Fake account creation attacks are heavy against eCommerce sign up pages as well as reseller bot attacks against the Shop flows of eCommerce, Fashion and QSR industries.
What Normal Login Success Rates Look Like
A simple way to try and estimate how much credential stuffing or automation you are getting on your login flows is to look at the login success rate - this is a key indicator for unwanted automation or account takeover activity.1 Central to this approach is knowing what the expected average login success rate should be for your enterprise. This is hard to estimate in isolation as there is no objective source of truth. Historical data (even periods with the highest historical success rates) may still include significant amounts of unwanted automation. This rate also varies significantly from one industry to the next. This makes it hard to find credible sources of this information. To aid with this, F5 Labs will be publishing average human/legitimate login success rates by industry. These are shown in Figure 8 below for the full calendar year 2023.
As highlighted in Figure 8 above, the highest legitimate human login success rates are for the Finance Industry (Credit Unions and Banks). This makes sense because:
- These are accounts that are very valuable, hence users are less likely to forget their login credentials.
- Accounts are accessed with high frequency, reducing chances of forgetting or mistyping passwords that are entered frequently.
- Credentials are more likely to be saved into password managers or autocompleted by browsers due to regular usage.
- These accounts typically have very short time outs and users even in the same session may be logged out after several minutes of inactivity. This causes users to have to login a lot and hence are more likely to successfully do so.
The lowest average success rates in this list were for Grocery, Hospitality and State and Local government industries, which tend to be low for two different sets of reasons.
Grocery
- Sessions tend to be extremely long, with users seldom being asked to reauthenticate after the first login both on Web and Mobile. As a result, many users will have forgotten their credentials when they eventually have to authenticate.
- Low success rate, especially on Mobile, due to credentials not being stored in the browser (like on Web); when a new app has been installed and is being used to log in for the first time, users are often unable to recall their password.
- This is seen as a lower tier of account and users do not use the same strong passwords and do not take as much effort to remember these passwords as the cost of forgetting it is minimal.
Hospitality and State and Local Government
- The infrequency of needing to access these accounts for most users results in them forgetting their passwords and having to reset them. There is also some turnover of users as people move in and out of states, in the case of state/local government site accounts.
- There are often several state login systems that may not share credential information leading to confusion on the part of users as to which credentials to use on a given state site vs another.
- This is seen as a lower tier of account and users do not use the same strong passwords and do not take as much effort to remember these passwords as the cost of forgetting it is seen as minimal.
Conclusions
2023 was typical from a bot stats perspective. Entertainment, Airline and Fashion Retail industries are the most targeted industries on Mobile APIs while Healthcare, Hospitality and Telecoms were the most targeted on Web. Hospitality and Airlines saw a surge in automated attacks coinciding with the summer travel period with automation rising from April and peaking in September 2023. There were some large Mobile API attacks in March targeting Healthcare, eCommerce and Grocery Retail industries, while another set of Mobile API attacks in April and September targeted the Telecom and Airline industries.
The view of automation by flows shows that Search, Gift Card, Quote and Shop flows are the most targeted. Search flows are targeted by high volume scrapers. These tend to be well funded, resourced, and persistent bots. The second group of highly targeted flows are Gift Card flows, especially during the holiday shopping period, against many of the Retail industries. Login success rates are a good way of keeping an eye on potential credential stuffing and account takeover activity. The human login success rates vary by industry for a number of reasons, and average human login success rates by industry and Platform (Web vs Mobile API) were provided to assist security teams in knowing when their experience falls out of line with industry standards which may be indicative of credential stuffing and other automated account takeover activity.


