Executive Summary
- Threats to digital identities are continuous in nature, widespread in targeting, and progressive in their evolution.
- The average proportion of credential stuffing in unmitigated traffic for sampled organizations across all sectors was 19.4%.
- Post-mitigation, the average rate of credential stuffing was 6.0%.
- Mobile endpoints generally see higher rates of automation pre-mitigation than web endpoints.
- Travel, telecommunications, and technology firms experienced higher credential stuffing rates than other sectors.
- While authentication endpoints see higher traffic and automation rates than account management endpoints, account management endpoints serve critical roles for attackers, such as the creation of canary accounts and facilitation attacks for information gain.
- 65% of credential stuffing traffic was composed of unsophisticated HTTP requests with no browser or user emulation.
- Around 20% of malicious automation traffic on authentication endpoints was sophisticated, in that it successfully emulated human behavior on a real browser, including mouse movements and keystrokes.
- Aggregators, which play a significant role in several industries such as finance, can be both a source of noise in terms of detecting malicious automation, as well as a vector in their own right for attackers.
- Many organizations use authentication success rate to identify unwanted automation, but aggregator and canary account traffic can make authentication success rate metrics unreliable.
- The phishing industry has matured, with phishing kits and services driving down the requisite technical expertise and cost.
- Phishing appears to target financial organizations and large-scale/federated identity providers such as Microsoft, Facebook, Google, and Apple the most.
- Reverse phishing proxies, also known as real-time phishing proxies or man-in-the-middle (MITM) phishing, have become the standard approach. These proxies can harvest session cookies and defeat most multi-factor authentication (MFA).
- Detection evasion tools that defeat capabilities such as Google Safe Browsing are also a high priority for phishing.
- Multi-factor authentication bypass techniques have become more common, with successful strategies based on malware, phishing, and other social engineering vectors observed.
- Multi-factor authentication technologies based on public key cryptography (such as the FIDO2 suite of protocols) are significantly more resistant to observed MFA bypass techniques.
[back to top]
Introduction
Welcome to the 2023 Identity Threat Report. The purpose of this report is to assess and summarize the current threat landscape facing organizations as a result of the digital identities that they issue to legitimate users. In other words, we are mostly talking about credentials. Why not just call this a Credential Threat Report? The reason is because credentials are changing, and thinking about them in terms of identity instead of just a username and password situates this analysis in terms of where technology is going, not where it has been.
The growing maturity of cloud computing, with attendant shifts towards decentralized architectures and APIs, has highlighted the complexity of managing credentials in increasingly interconnected systems. It has also illuminated the importance of managing non-human entities like servers, cloud workloads, third-party services, and mobile devices. So this isn’t just a change in terminology—it is important to assess identity threats because it increasingly appears that identity is becoming a confluence of risk and attacker focus.
What’s not in the report? Well, we called this report “The Unpatchables” because digital identities represent a source of technical risk that is impossible to completely mitigate even in theory. They stand in distinction to vulnerabilities, which are binary in nature—either a system has a vulnerability to be exploited or it does not. If a system is vulnerable, we patch it (or at least we should). In contrast, we can’t patch against users. As a result, we’ll not only do our best to encapsulate various ways that attackers target identities, we’ll also try to assess how this form of threat is qualitatively different from the threat of a technical exploit.
Before we jump into the deep end, we should standardize on a few bits of terminology: for the purposes of this report, an identity is an artifact that an entity—which could be a human user, a workload, a computer, or an organization—uses to identify themselves to a digital system. Examples of digital identities include username/password pairs (credentials) but can also include other personally identifiable information or cryptographic artifacts such as digital certificates.
Digital identities cannot stand on their own; they require a system to accept and validate them. In other words, for a digital identity to function there must be at least two parties involved: an entity and an identity provider (IdP).
Note that each entity has many digital identities—at least one per IdP in normal circumstances.1 Many human users have hundreds of distinct digital identities, which reflects the fragmentary nature of the web and is part of the problem when it comes to identity threats.
This helps illustrate how identities can be chained to one another. For instance, most of us use a personal email address to manage accounts and credentials for other resources. This ties the fate of one identity to another, because if that mail is compromised a threat actor can use it to reset passwords or carry out various types of fraud on all accounts created and authenticated using that compromised email address.
In the following report we will look into three extant threats to digital identities: credential stuffing, phishing, and multi-factor authentication (MFA) bypass. This is clearly not an exhaustive overview of all forms of digital identity nor all possible threats to them—we wish we had more data about service accounts and non-human entities, since they appear to be playing a bigger role both in benign activity and the attack surface as time goes on. Still, we hope our findings here can at least contribute to the growing understanding of digital identity as we navigate our way through the present and future of the web.
[back to top]
Sources
We have relied on several different sources for this report, partly to view different aspects of digital identity that attackers target, but also because no single source of data is ever complete when it comes to the Internet. These are the sources that informed this research:
F5 Distributed Cloud Bot Defense Telemetry
Telemetry from a subset of production instances of F5® Distributed Cloud Bot Defense is the most data-rich source we have for this report and will serve as the primary source for our analysis of credential stuffing.
F5 Leaked Credential Check Data
F5 also offers a service called Leaked Credential Check that checks credentials submitted to protected sites against stores of known compromised credentials. We used this source at times to assess the characteristics of the stolen credential supply chain.2
Dark Web Threat Intelligence
We work with several organizations that specialize in collecting, translating, and interpreting threat actor discussions and transactions on the dark web.
Anti-Phishing Working Group (APWG) eCrime Exchange (eCX)
The APWG is a non-profit coalition of security practitioners and researchers focused on sharing observations and intelligence around phishing and other forms of cybercrime. The eCX contains a collection of phishing observations from the wild that we used to analyze phishing targeting.
Miscellaneous F5 Threat Intelligence
Several distinct threat intelligence or security research teams contributed to this report, including the Bot Defense Threat Analytics and Reporting (TAR) group, the Global Cyber Threat Intelligence and Investigation team, security engineers from F5 Distributed Cloud App Infrastructure Protection (AIP), as well as malware reverse engineers from the Security Research team.
[back to top]
Credential Stuffing
Credential stuffing is one of the two primary threat vectors we’ll discuss in this report; it is already widely recognized as a fundamental source of cybersecurity risk. Much has already been said on this topic (including by us in the 2021 Credential Stuffing Report), but what we’ll do this time around is quantify it, explore its variations over time and space, and contextualize it. To do this we will break this section into three main parts: prevalence; targeting trends; and tactics, techniques, and procedures (TTPs)
The primary source for this section will be Distributed Cloud Bot Defense telemetry. That means that we need to briefly touch on the characteristics of the data we’re analyzing and how it relates to credential stuffing.
Credential stuffing is a numbers game. It hinges on the fact that people reuse passwords, but the likelihood that any single publicly compromised password will work on another single web property is still small. Making credential stuffing profitable is all about maximizing the number of attempts, and that means it is also all about automation.
Distributed Cloud Bot Defense is, strictly speaking, an anti-automation tool. In addition to protecting against credential stuffing attacks, it also covers other attack vectors that rely on large scale automation, like content scraping and reseller bots targeting retail sites.3 However, because credential stuffing only appeals to attackers when automation comes into play, that makes automation the battlefront against credential stuffing. Much of the following analysis, therefore, will focus on the concept of “malicious automation,” specifically against authentication or account management endpoints, as indicative of credential stuffing strategies.
The Distributed Cloud Bot Defense data we have analyzed here comes from production instances of 159 Distributed Cloud Bot Defense customers. This is a subset of the full customer base because variations in configuration mean that not every customer, or every data field for every customer, applies for every analysis. In sum the time period of this analysis is from early March 2022 to late April 2023, and the dataset contains a total of 320 billion transactions, of which roughly 60 billion were evaluated as malicious automation.
We also need to briefly discuss some potential biases that could come along with this source:
- Selection bias: the data in this report comes from a subset of customers who have already signed up for protection from automated attacks. We don’t know how much of a malicious bot problem any of them had before, but we do know that they sought out an anti-bot solution. It is possible that we are selecting from a pool of organizations that have markedly bigger bot problems than the baseline, although we believe this data is representative for two reasons: new customers’ levels of malicious automation vary widely, and even those who seek out bot protection often underestimate its prevalence on their own system.
- We also don’t know what other anti-bot controls were present in these customers’ environments, nor many of the details about the organizations’ architecture, operations, and business models that might affect malicious bot activity. Hopefully, by analyzing as many different organizations as possible, we can overcome any bias that would result from existing controls in customer environments.
[back to top]
Prevalence
Quantifying the prevalence of credential stuffing across multiple different organizations is difficult because credential stuffing attacks against a single organization often occur in intense waves, then subside to a lower baseline level for some time. It will take analysis from several different angles to get a complete sense of the landscape. With that said, let us start with Figure 1, which shows the daily mean proportion (with 95% confidence interval) of malicious automated traffic against the authentication surfaces of 159 customers. (We will explore other endpoints later on.)
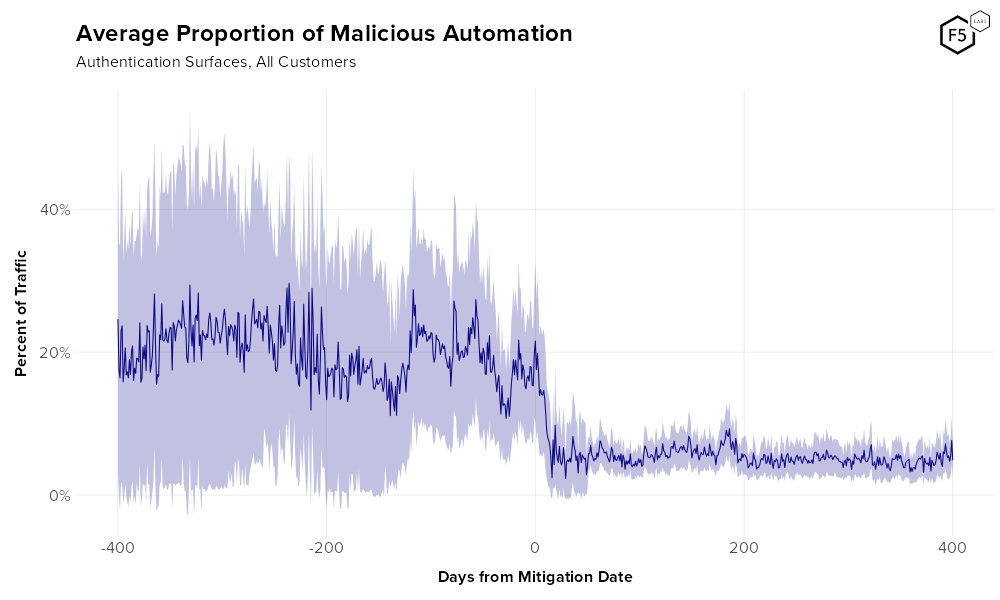
Figure 1. Average rate of malicious automation against authentication over time for all customers. Pale purple denotes a 95% confidence interval. Note the dramatic change in traffic upon mitigation.
Figure 1 shows that across a wide range of customers, the “baseline” rate of malicious automation in unmitigated traffic hovers between 10 and 30 percent. However, also visible in Figure 1 is an elephant in the room that is important to understand, which is the issue of enabling bot mitigation and its effect on attacker behavior.
The Effects of Mitigation Mode
F5 Labs’ mission is to deliver threat intelligence, not to promote products. For this reason, we are a little reluctant to include post-mitigation observations such as the right half of Figure 1, because on the surface it might look like we are touting the efficacy of Distributed Cloud Bot Defense, and that’s not our job.
However, observing and characterizing attacker behavior is our job, and what this plot shows is not really how many attacks are being blocked, but that attacker behavior changes when an anti-bot solution is implemented. There are several things we can learn by observing how attackers react to seeing their attacks mitigated. For this reason, we are including post-mitigation telemetry in this analysis and will frequently refer to “unmitigated” and “mitigated” traffic.
It is also helpful to understand what this means in terms of the outcome of the attack. Prior to entering mitigation mode, Distributed Cloud Bot Defense will evaluate requests and classify them as malicious or benign, but will pass them on to the destination server either way (much like observation or pass-through mode on a firewall). Once a customer is in mitigation mode, requests that are evaluated as automated are dropped.4 In other words, all post-mitigation attack traffic shown in this report was unsuccessful.
Attackers respond in various ways to mitigation. As you can see from the dramatic decline in automation post-mitigation, many give up and look for easier targets, but attacks rarely drop to zero even when they are completely unsuccessful, for several reasons. New threat actors can begin attacking a site without realizing others have already failed. Furthermore, they might not realize their own attempts are failing, because the effect of an anti-bot solution is not always obvious to attackers. Credential stuffing success rates tend to be low, so many attackers simply conclude they had the wrong credentials and keep trying. Some will detect the mitigation and try to escalate with more advanced techniques, which are detected by other signals and rule sets. (We’ll get to the question of attack sophistication further on in the report.)
With that aside out of the way, Figure 2 shows that the simple mean rate of automation across all customers pre-mitigation is 19.4%, and post-mitigation is 6.0%. The threat of credential stuffing, as you’ll see, is fairly complex, but if we were going to boil it down to a single number, this is it: across 159 customers in a range of industries, on average one in five authentication requests comes from malicious automated systems, i.e., credential stuffing bots.
Figure 2. Simple mean automation rate for 159 customers pre- and post-mitigation. The mean pre-mitigation automation rate is 19.4%, the post-mitigation automation rate is 6.0%.
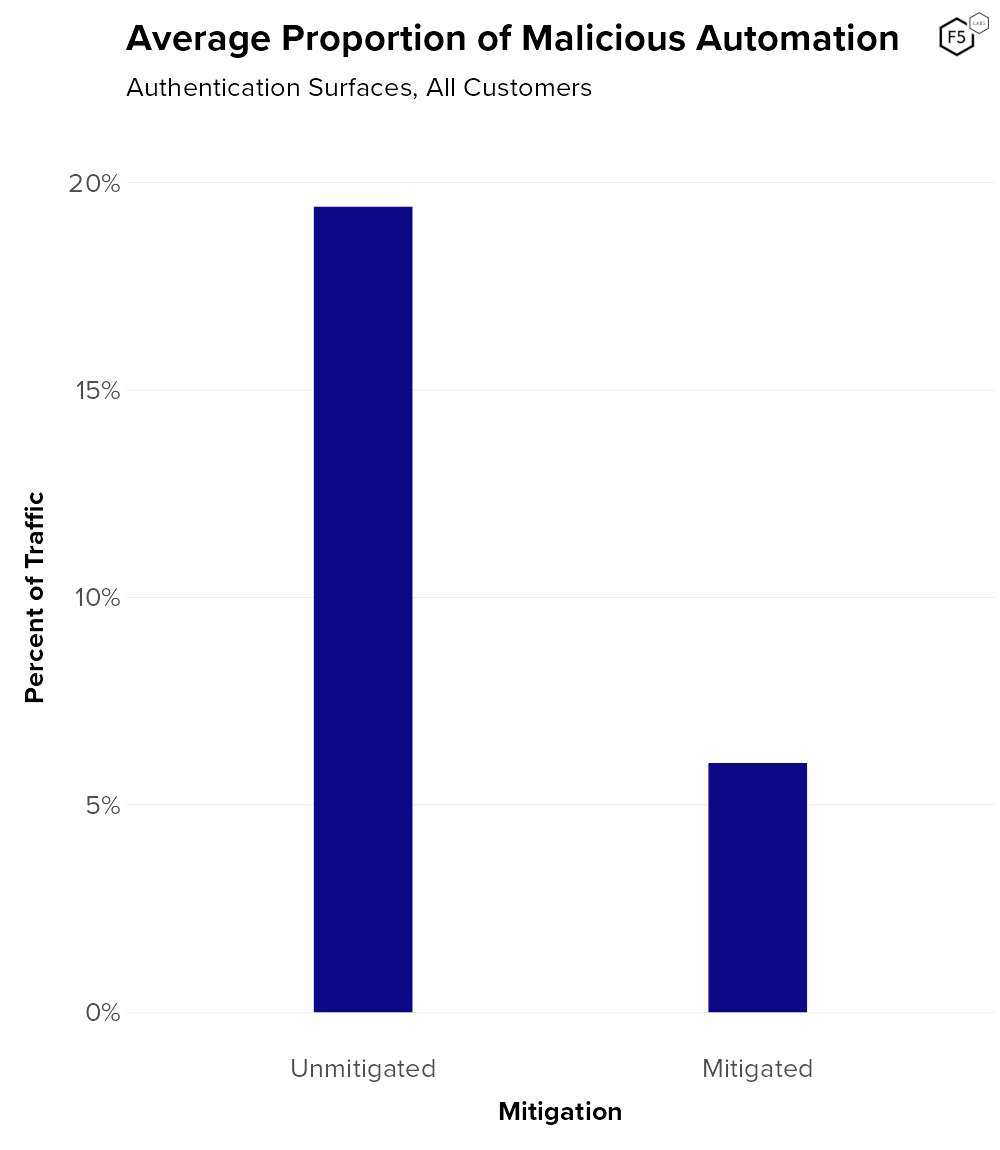
Figure 2. Simple mean automation rate for 159 customers pre- and post-mitigation. The mean pre-mitigation automation rate is 19.4%, the post-mitigation automation rate is 6.0%.
When it comes to credential stuffing, attackers tend to show a slight preference for mobile endpoints (21.0% pre-mitigation) over web endpoints (17.4% pre-mitigation), as is visible in Figure 3. We can also see that attacks against mobile endpoints also subside more post-mitigation.
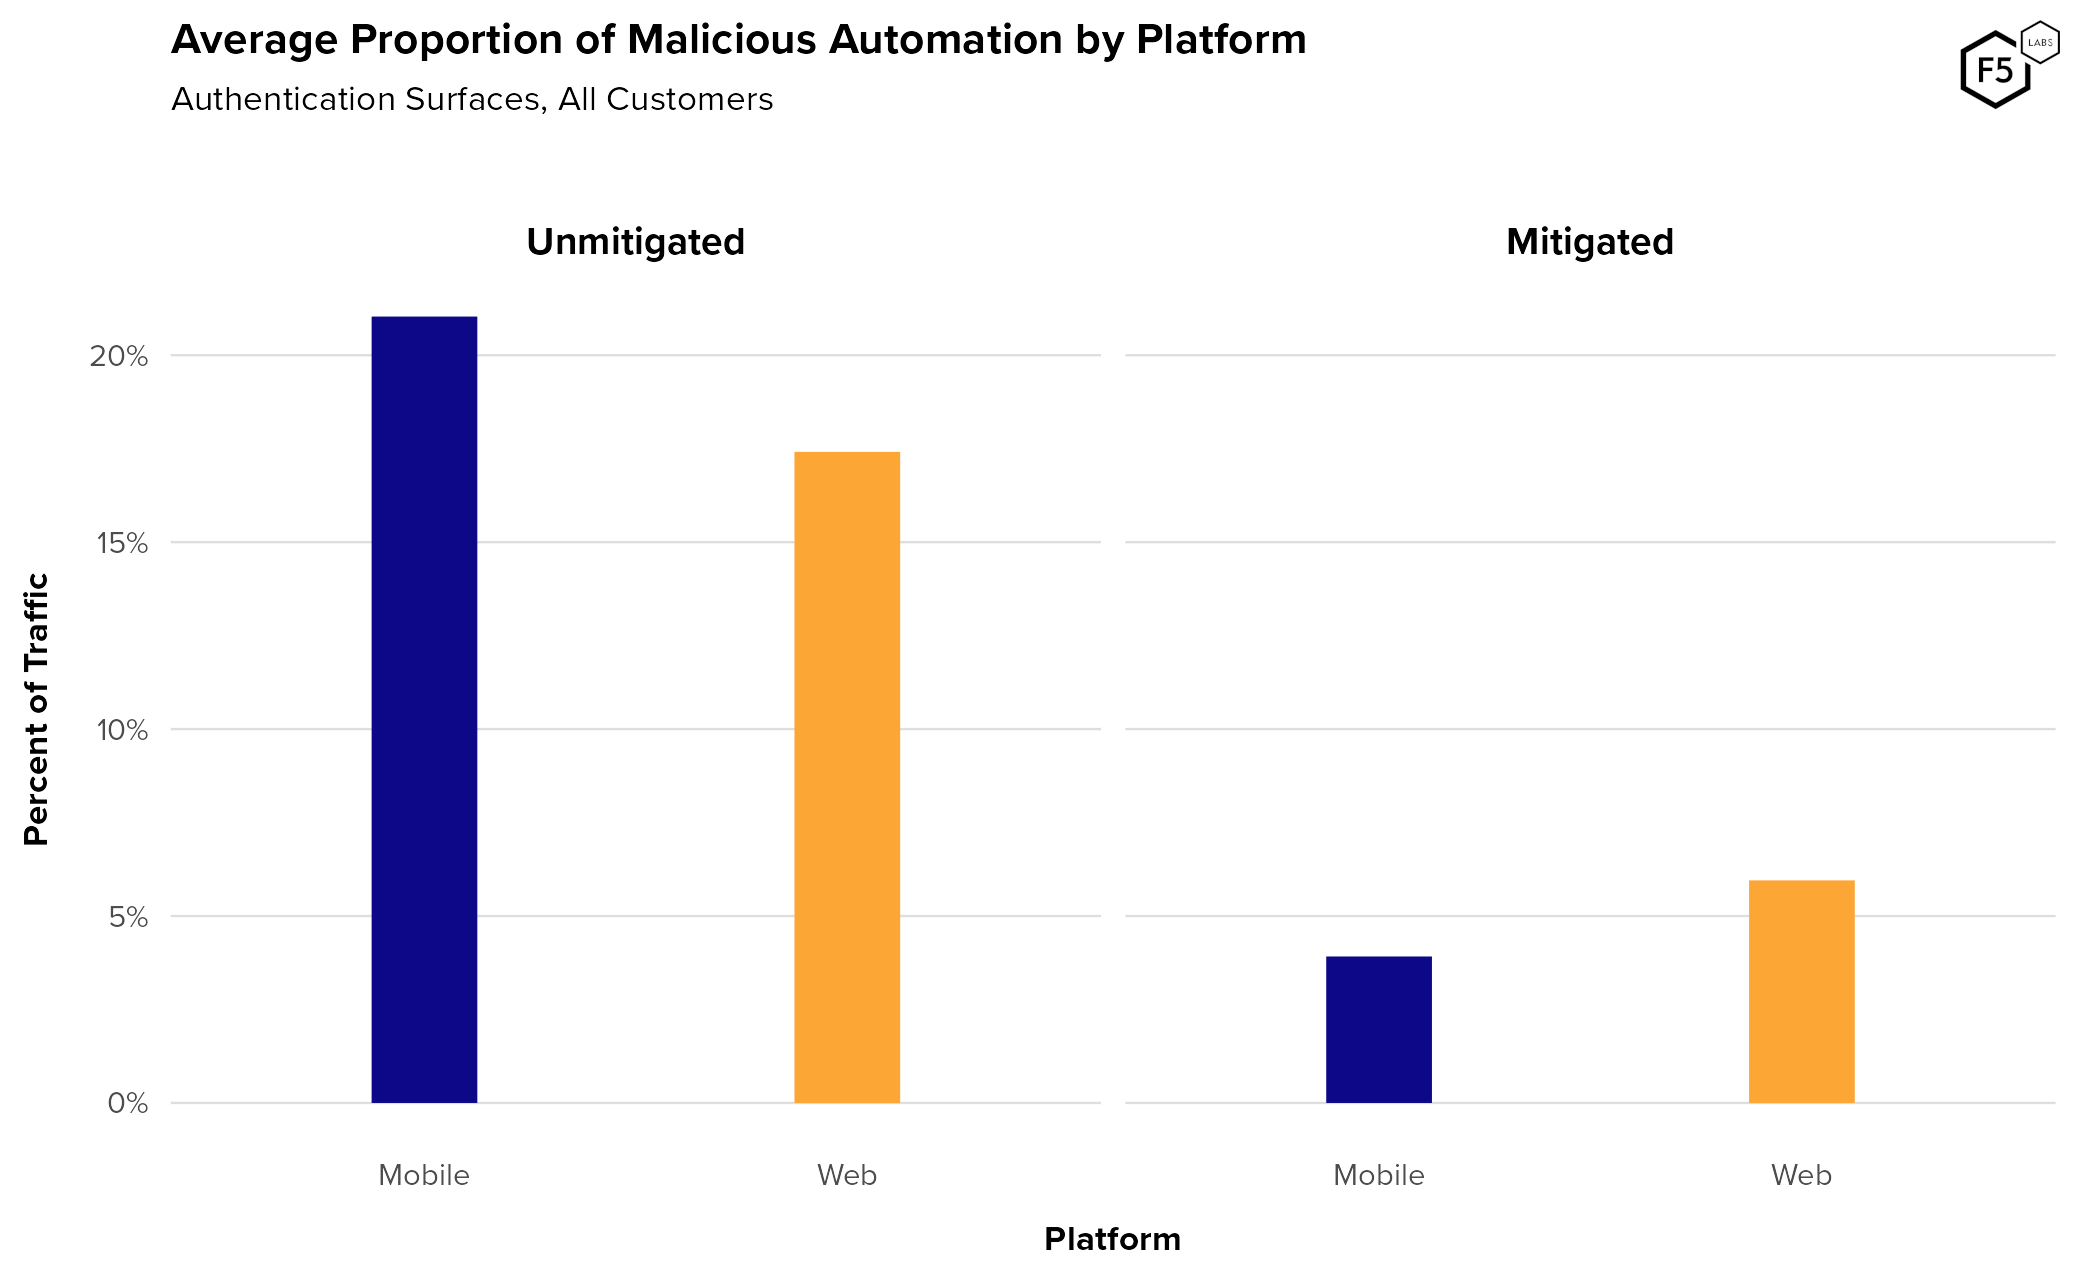
Figure 3. Average malicious automation by platform. Mobile endpoints experience slightly more credential stuffing than web endpoints before mitigation but show a greater decline after mitigation.
Figure 4 shows the automation rate over time for mobile and web endpoints. The overlap in the 95% confidence intervals means that this difference is not statistically significant based on this data, but this is consistent with observations from other customers and time periods. This view highlights the higher post-mitigation automation rate for web over mobile. One explanation for this is that mobile apps communicate over APIs, which tend to be more standardized than sites that are built for direct human interaction. This means that it is comparatively easier for an attacker targeting a mobile API to redirect their attack to another IdP than it would be for someone targeting a website. Figure 4 also shows that while mobile automation is higher on average, it is also more variable over time and therefore harder to predict.
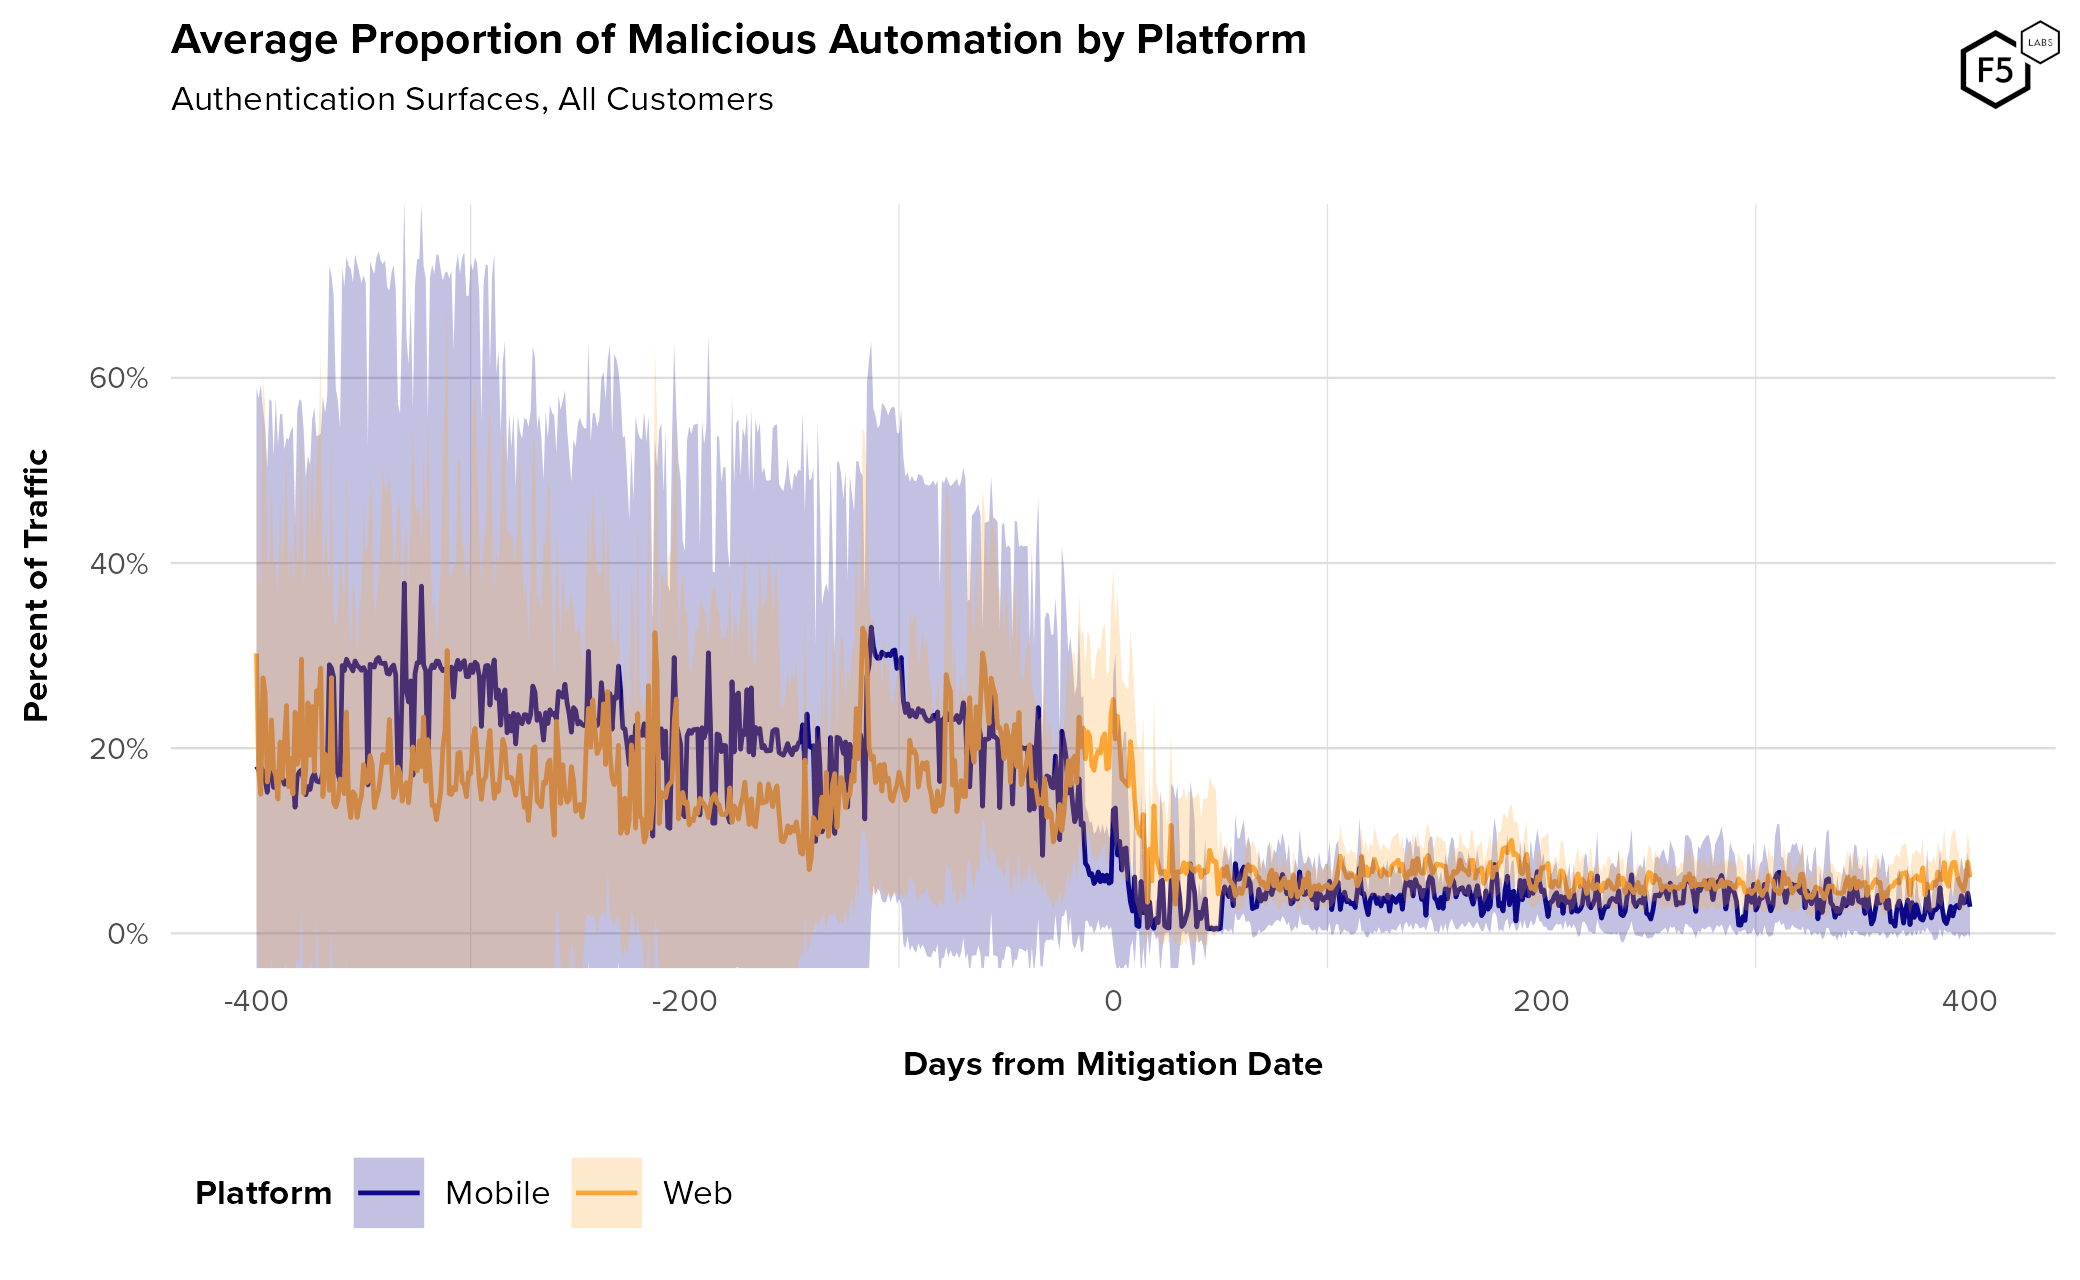
Figure 4. Average rate of malicious automation against authentication over time, broken out by platform. While mobile endpoints see slightly higher automation rates pre-mitigation, web endpoints tend to stay higher post-mitigation.
[back to top]
Targeting by Endpoint and Industry
The focus so far has been on authentication endpoints, but they are not the only target for identity-related attacks. Account management endpoints (such as account creation or password reset) also receive malicious automated traffic. Figure 5 shows the average pre- and post-mitigation automation rates for account management endpoints, broken out by platform. The overall average rate of pre-mitigation account management attacks was 13.0% for mobile and 7.3% for web. We saw the same trend as in authentication attacks of higher mobile automation pre-mitigation, subsiding to a lower post-mitigation level.
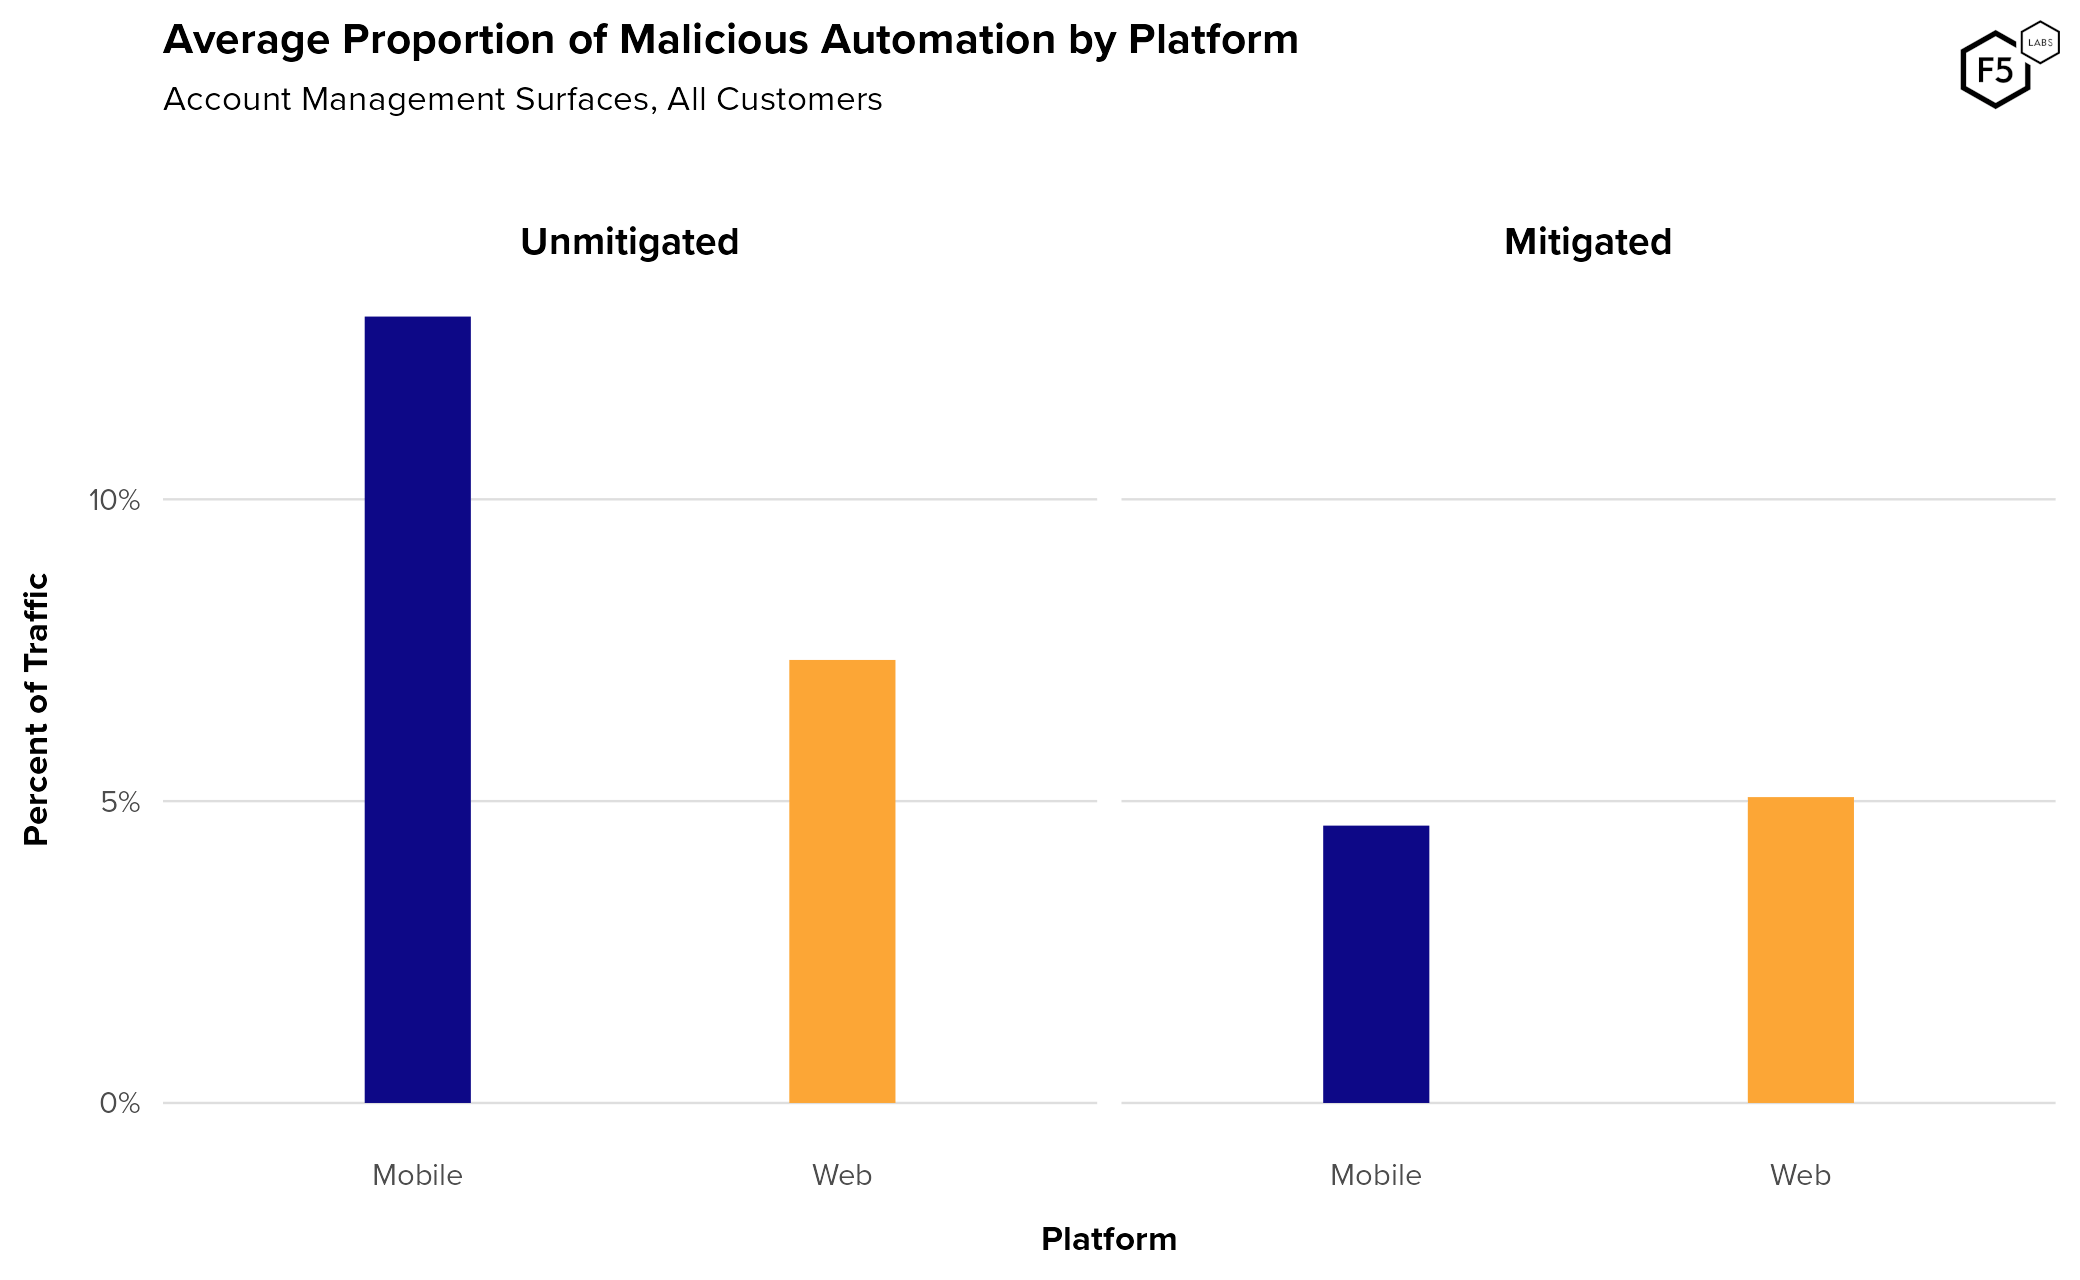
Figure 5. Average automation rates against account management endpoints, pre- and post-mitigation, broken out by platform. Overall, the automation rate against account management endpoints is lower than that of authentication endpoints.
Figure 6 shows the automation rate over time by platform. Here we also see the greater variability in mobile attack rates that we saw in attacks against authentication. Our hypothesis that mobile APIs engender easy target switching holds here as well.
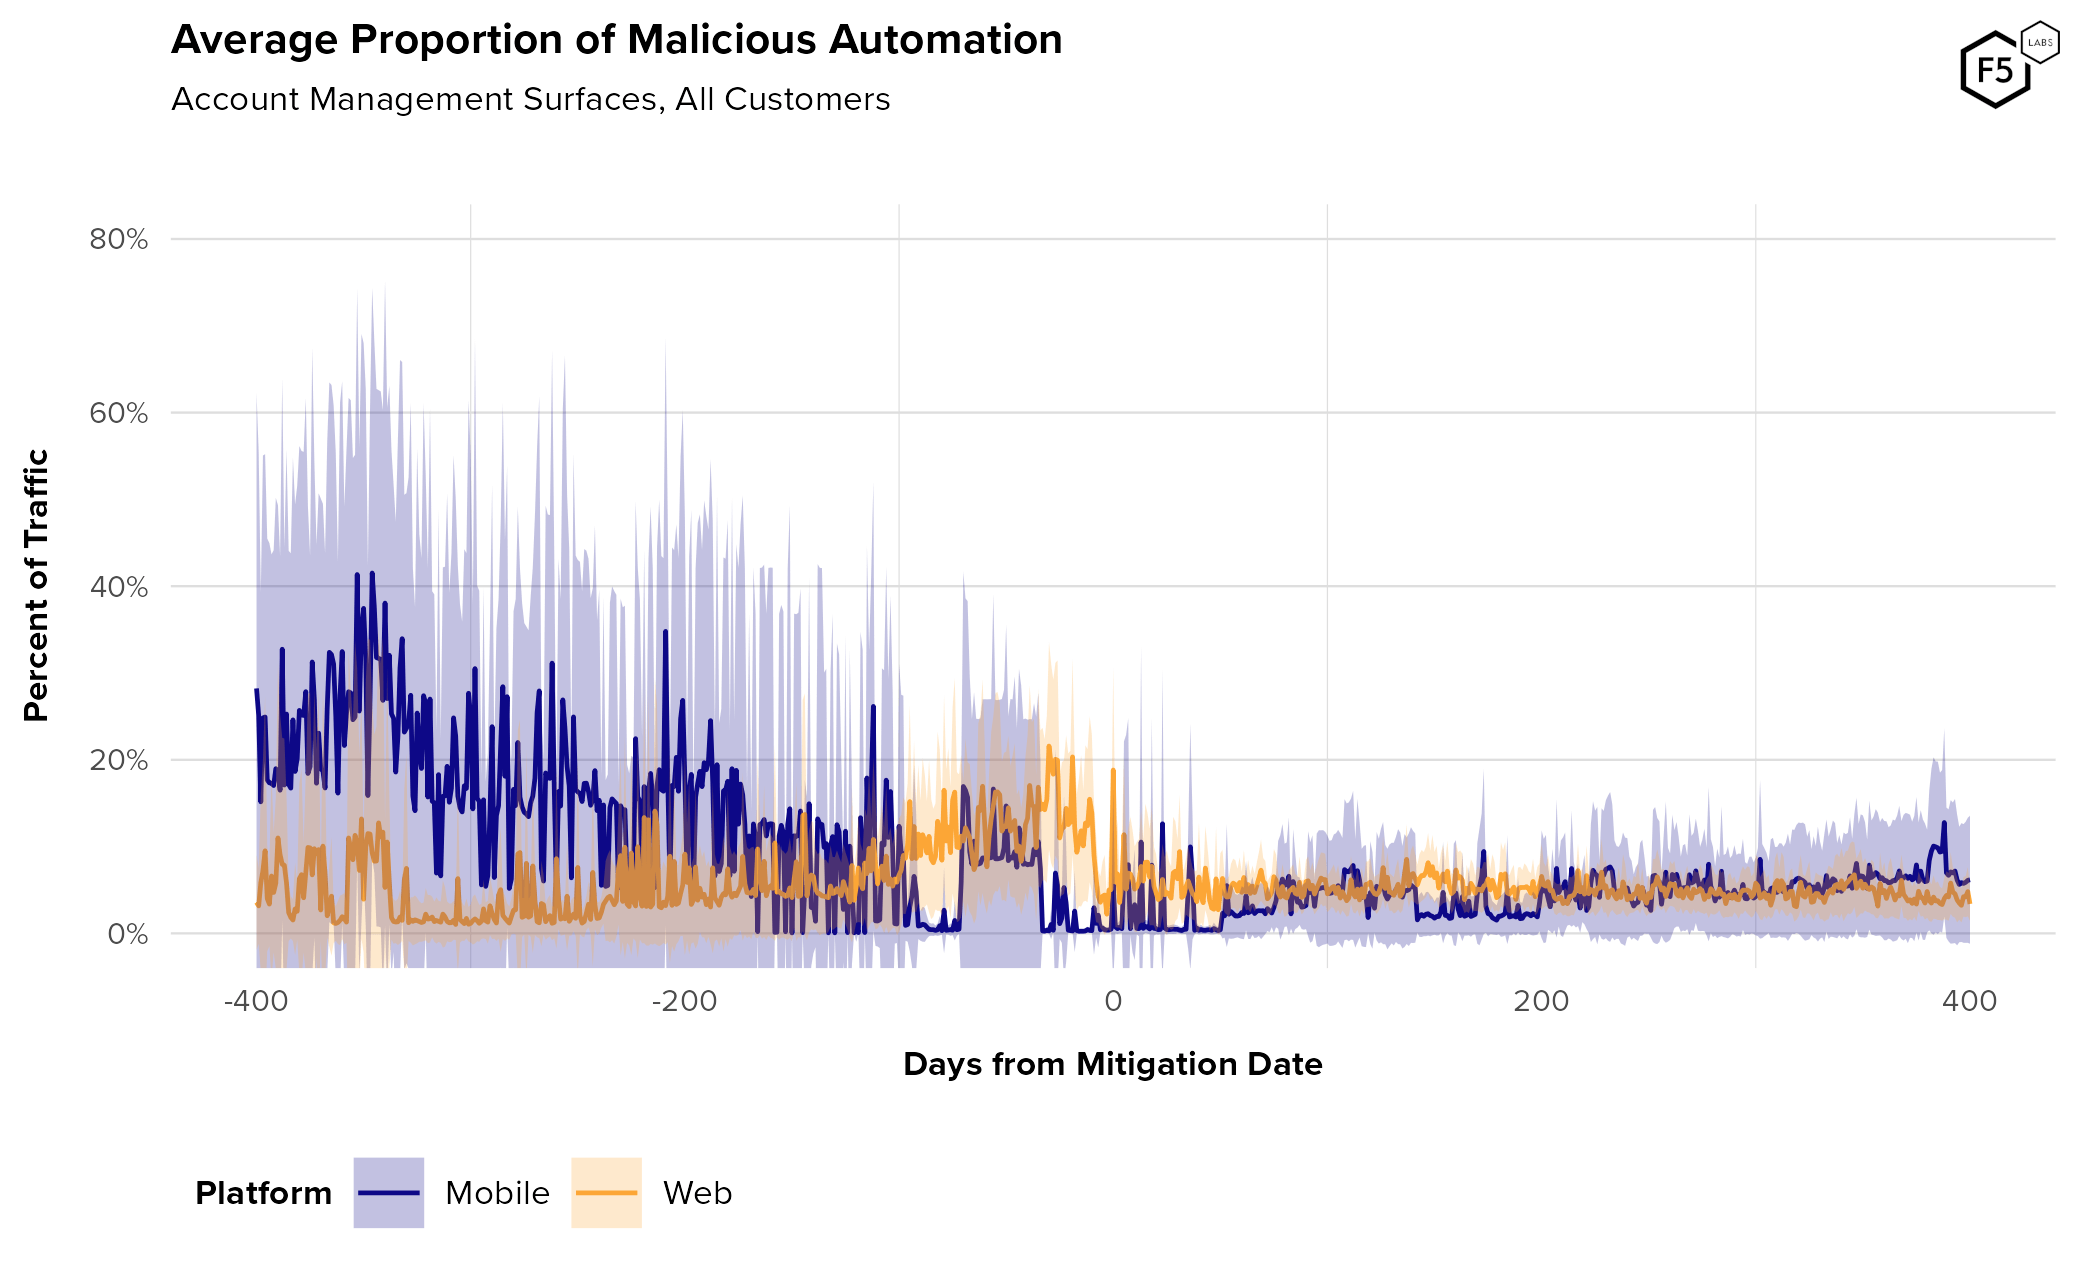
Figure 6. Average rate of malicious automated traffic against account management endpoints. While authentication surfaces average about 20% malicious automation, account management surfaces average about 12.5%.
However, it is also important to note that the volume of traffic against account management endpoints is significantly lower. Figure 7 shows the normalized daily amount of malicious traffic against authentication and account management endpoints. The average pre-mitigation attack traffic against account management flows was roughly 5,700 connections per day, whereas the average pre-mitigation attack traffic for authentication flows was 408,000.
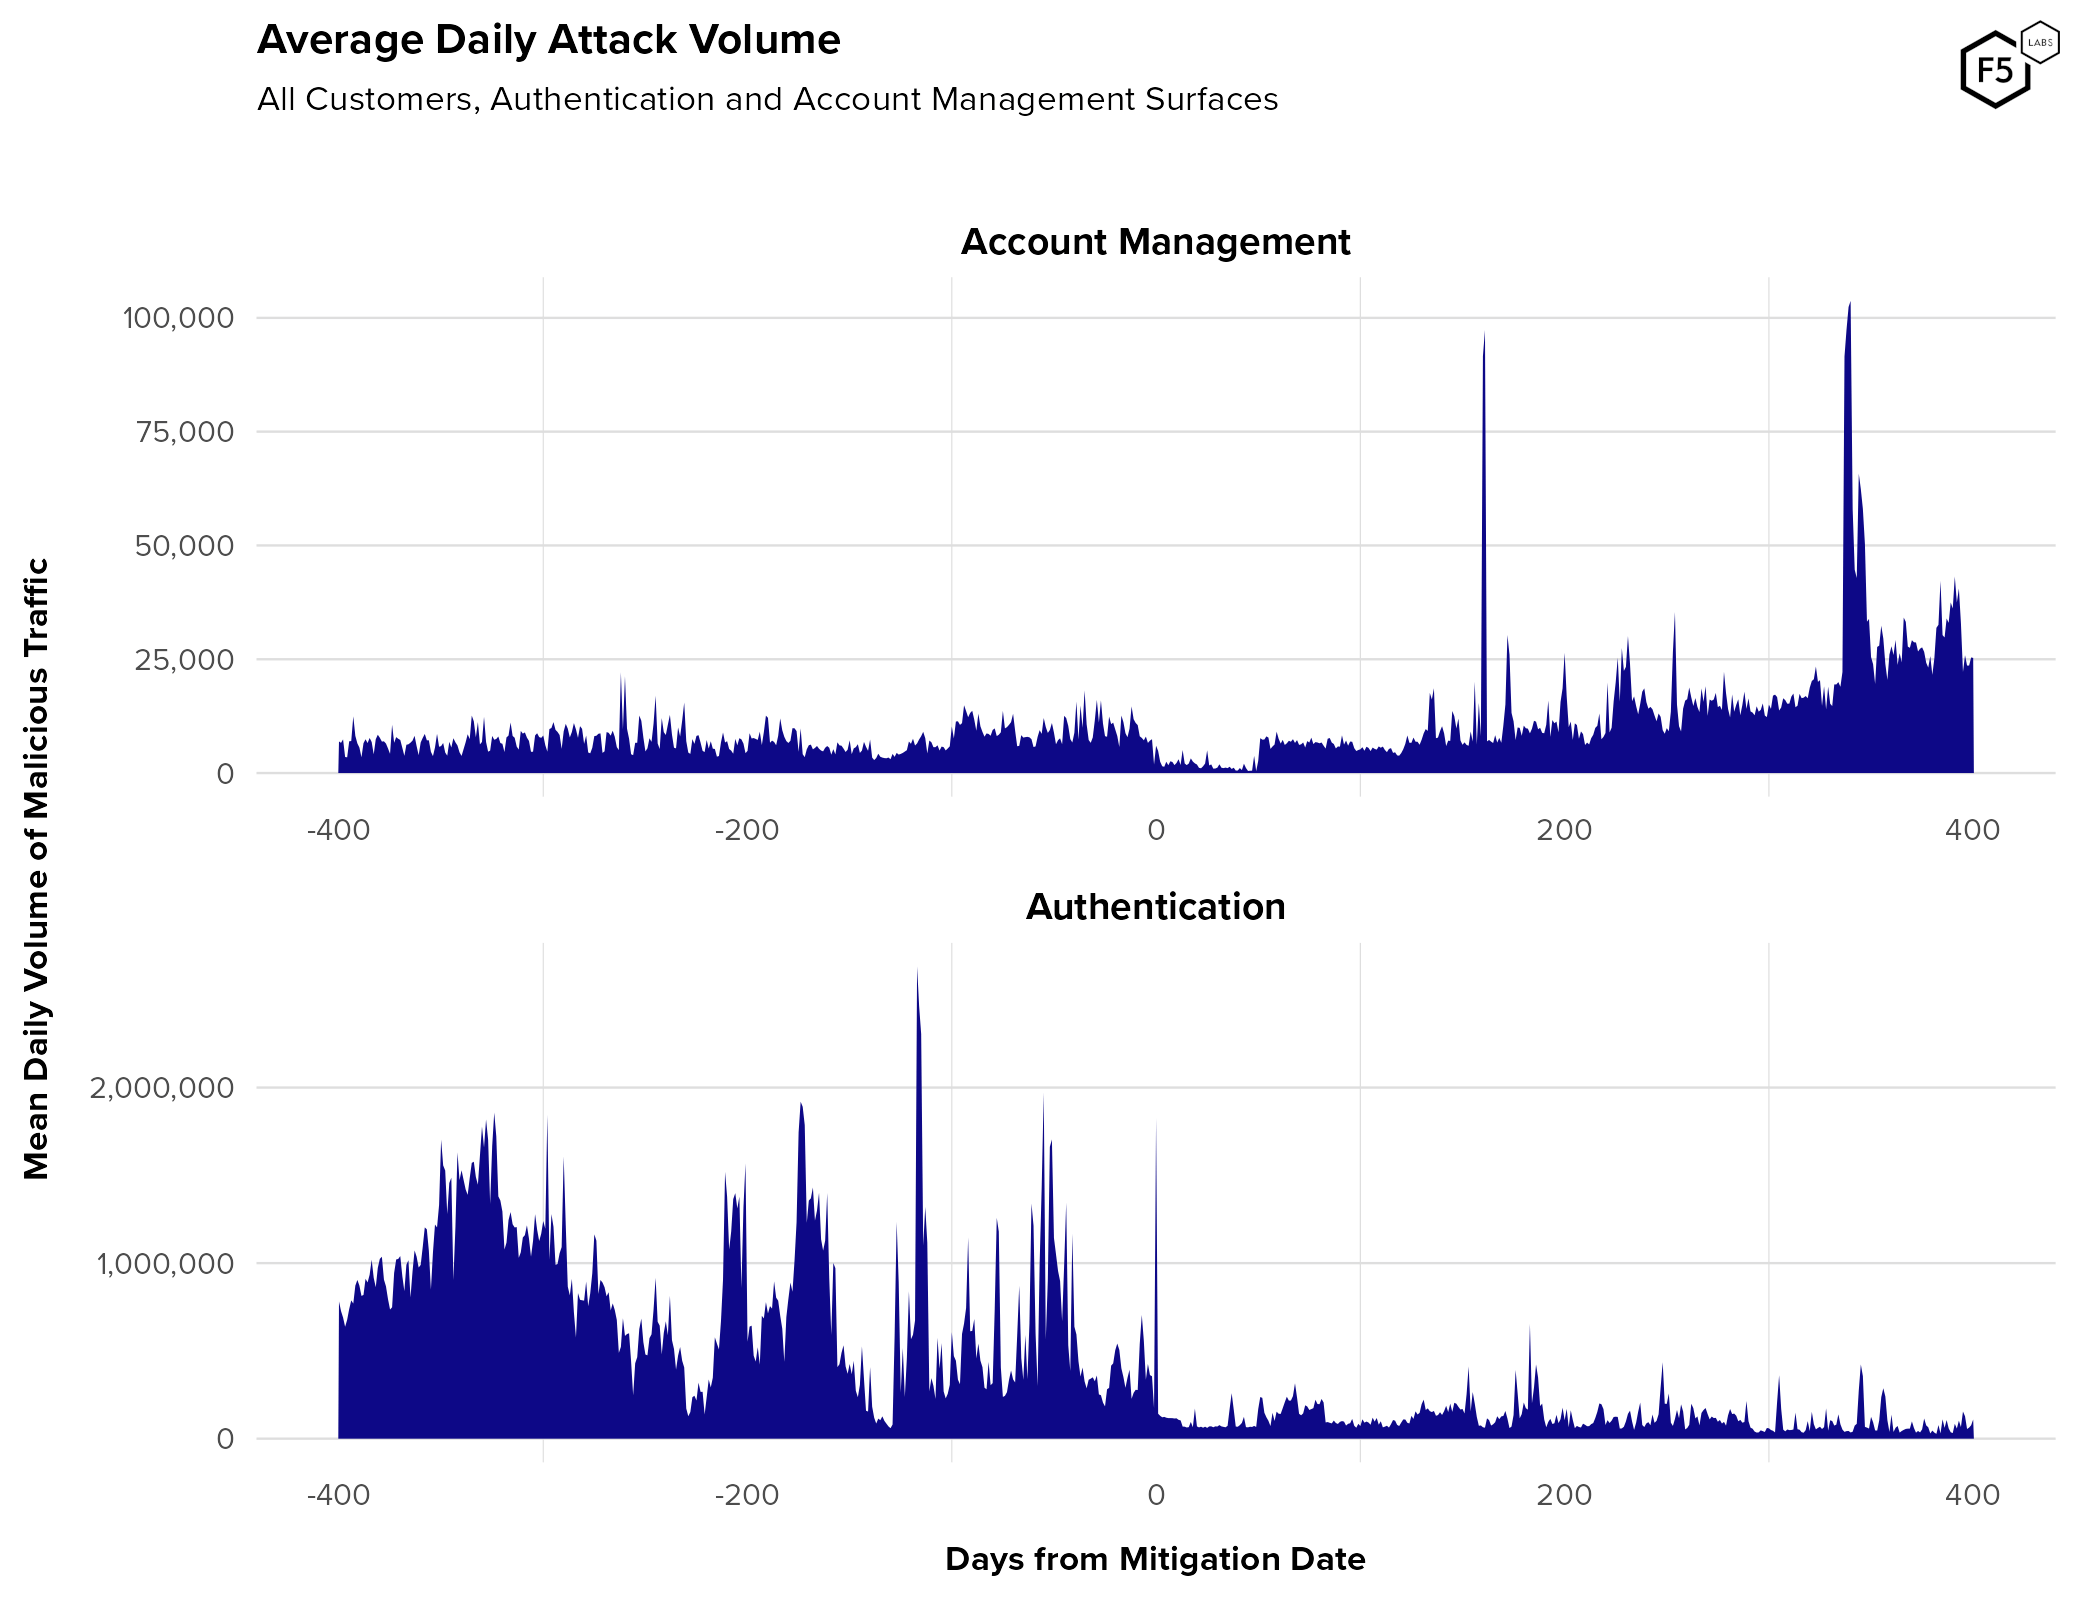
Figure 7. Average daily attack volume, pre- and post-mitigation, for account management and authentication endpoints. Note the different scales for y-axes; authentication endpoints see significantly more traffic.
Also note that average account management attack volumes did not decrease post-mitigation (even if automation rates did decrease). It is possible that this is due to attacker activity around fake accounts. There are several overlapping reasons why fake account traffic would differ from credential stuffing traffic:
- Whereas credential stuffers might assume their stolen credentials are no good and move on, actors accessing fake accounts know that they have the right credentials. They will therefore use password reset endpoints to try to recover their accounts.
- Furthermore, those fake accounts might be storing significant value as a result of fraud. Actors are sometimes unwilling to move on from these unclaimed proceeds.
- Fake account attacks usually involve learning and exploiting the inner workings of a specific platform, as in the case of reseller bots or disinformation campaigns. This makes it more difficult for attackers to give up and move on to a new target without significant losses.
To better understand the kinds of services that attackers target in account management endpoints, Figure 8 shows the distribution of malicious pre-mitigation attacks by account management function. Account creation endpoints saw the most malicious automation, followed by account recovery functions. In this data, check eligibility functions are almost exclusively present in financial services customers and represent endpoints for customers to apply for offers that require vetting, such as new bank accounts or credit cards. In other industries, this same label might signify vetting by retailers for limited time offers, credit unions for membership requirements, identification verification for healthcare organizations, program eligibility for government agencies, or device refresh eligibility for telecommunications companies.
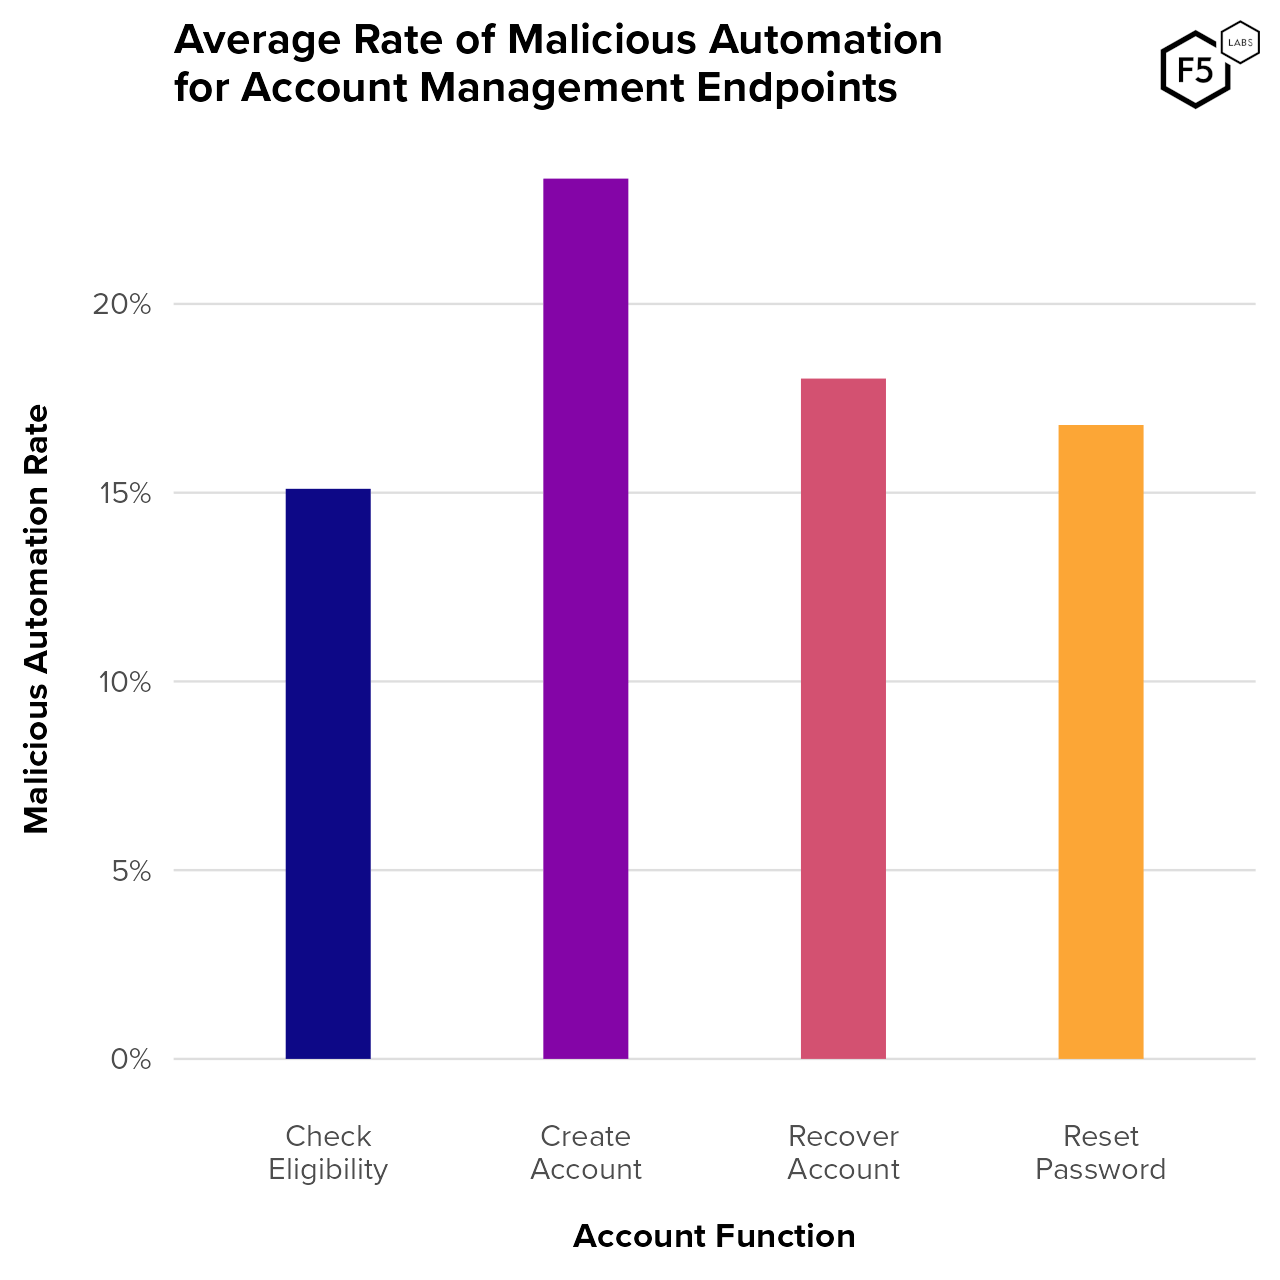
Figure 8. Average malicious automation rate by account management function. Account creation endpoints see the highest proportion of malicious traffic, followed by account recovery and password reset endpoints.
Reset password endpoints are often used for facilitation attacks in which attackers are validating credentials for a given web property. The attacker focus on creating new accounts is also visible in Figure 9, which represents the average distribution of malicious account management traffic. (Figure 8 measures the prevalence of malicious account traffic against corresponding benign account traffic, whereas Figure 9 measures the proportion of malicious traffic each distinct account management endpoint receives for an average customer). Note that recover account is actually present in Figure 9, it’s just very small and hard to see.
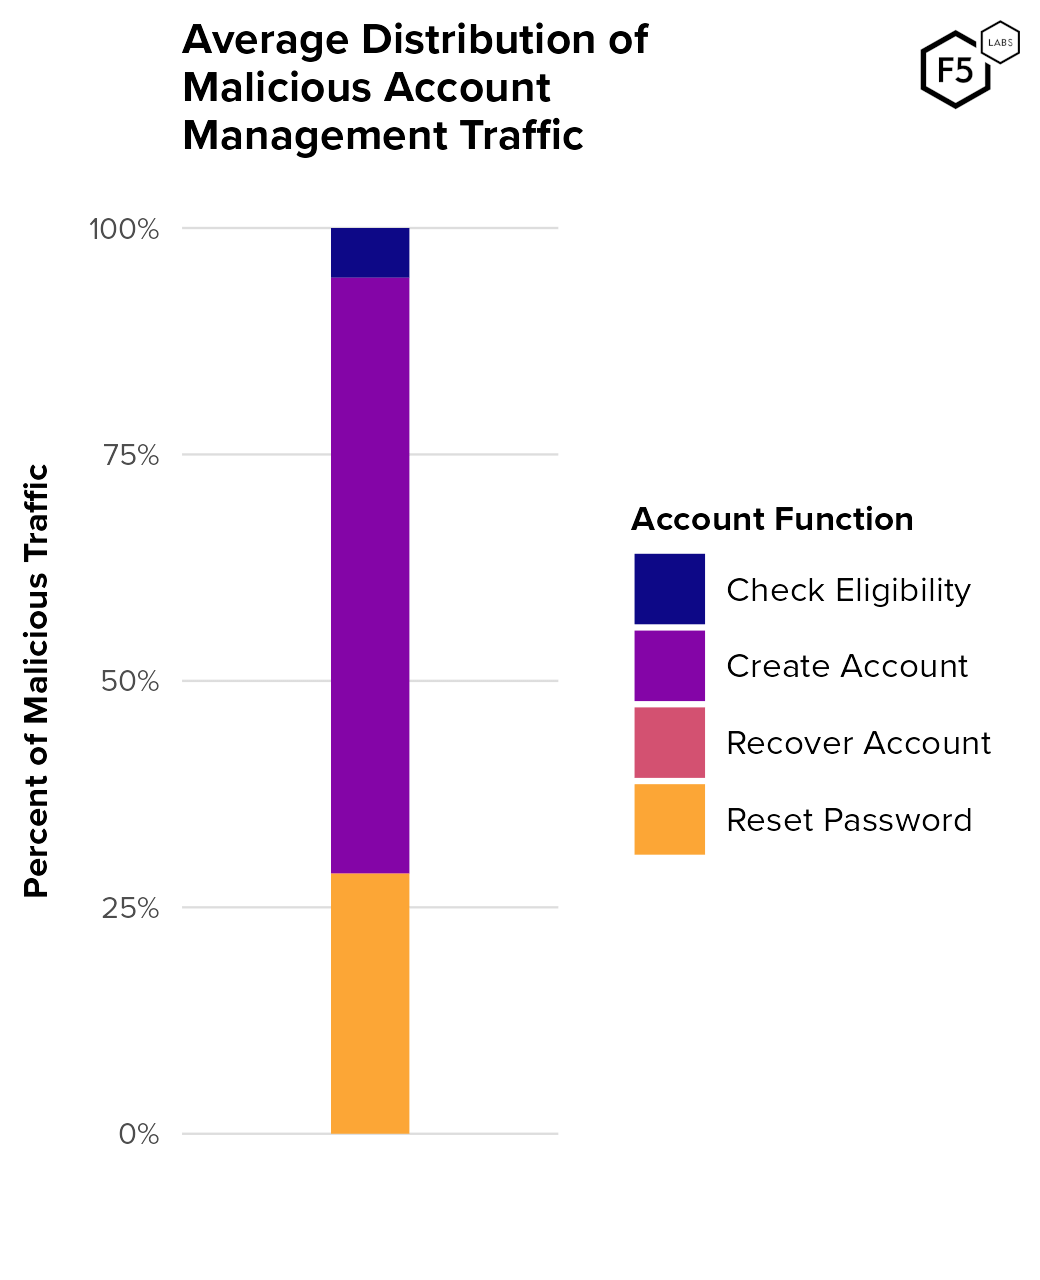
Figure 9. Distribution of malicious account management traffic by function. In this view, the average organization experiences significantly more malicious traffic against account creation endpoints than password reset or other endpoints.
The attacker focus on account creation is linked to a distinct tactic known as canary accounts, which we’ll cover in more detail in the “Tactics, Techniques, and Procedures” section below, but first we’ll cover the question of industry/sector targeting.
Industry Targeting
Figure 10 shows average automation rates against authentication by industry, both pre- and post-mitigation. In our data the technology, telecommunications, and travel sectors experienced the highest rates of unmitigated malicious automation, with media just behind.
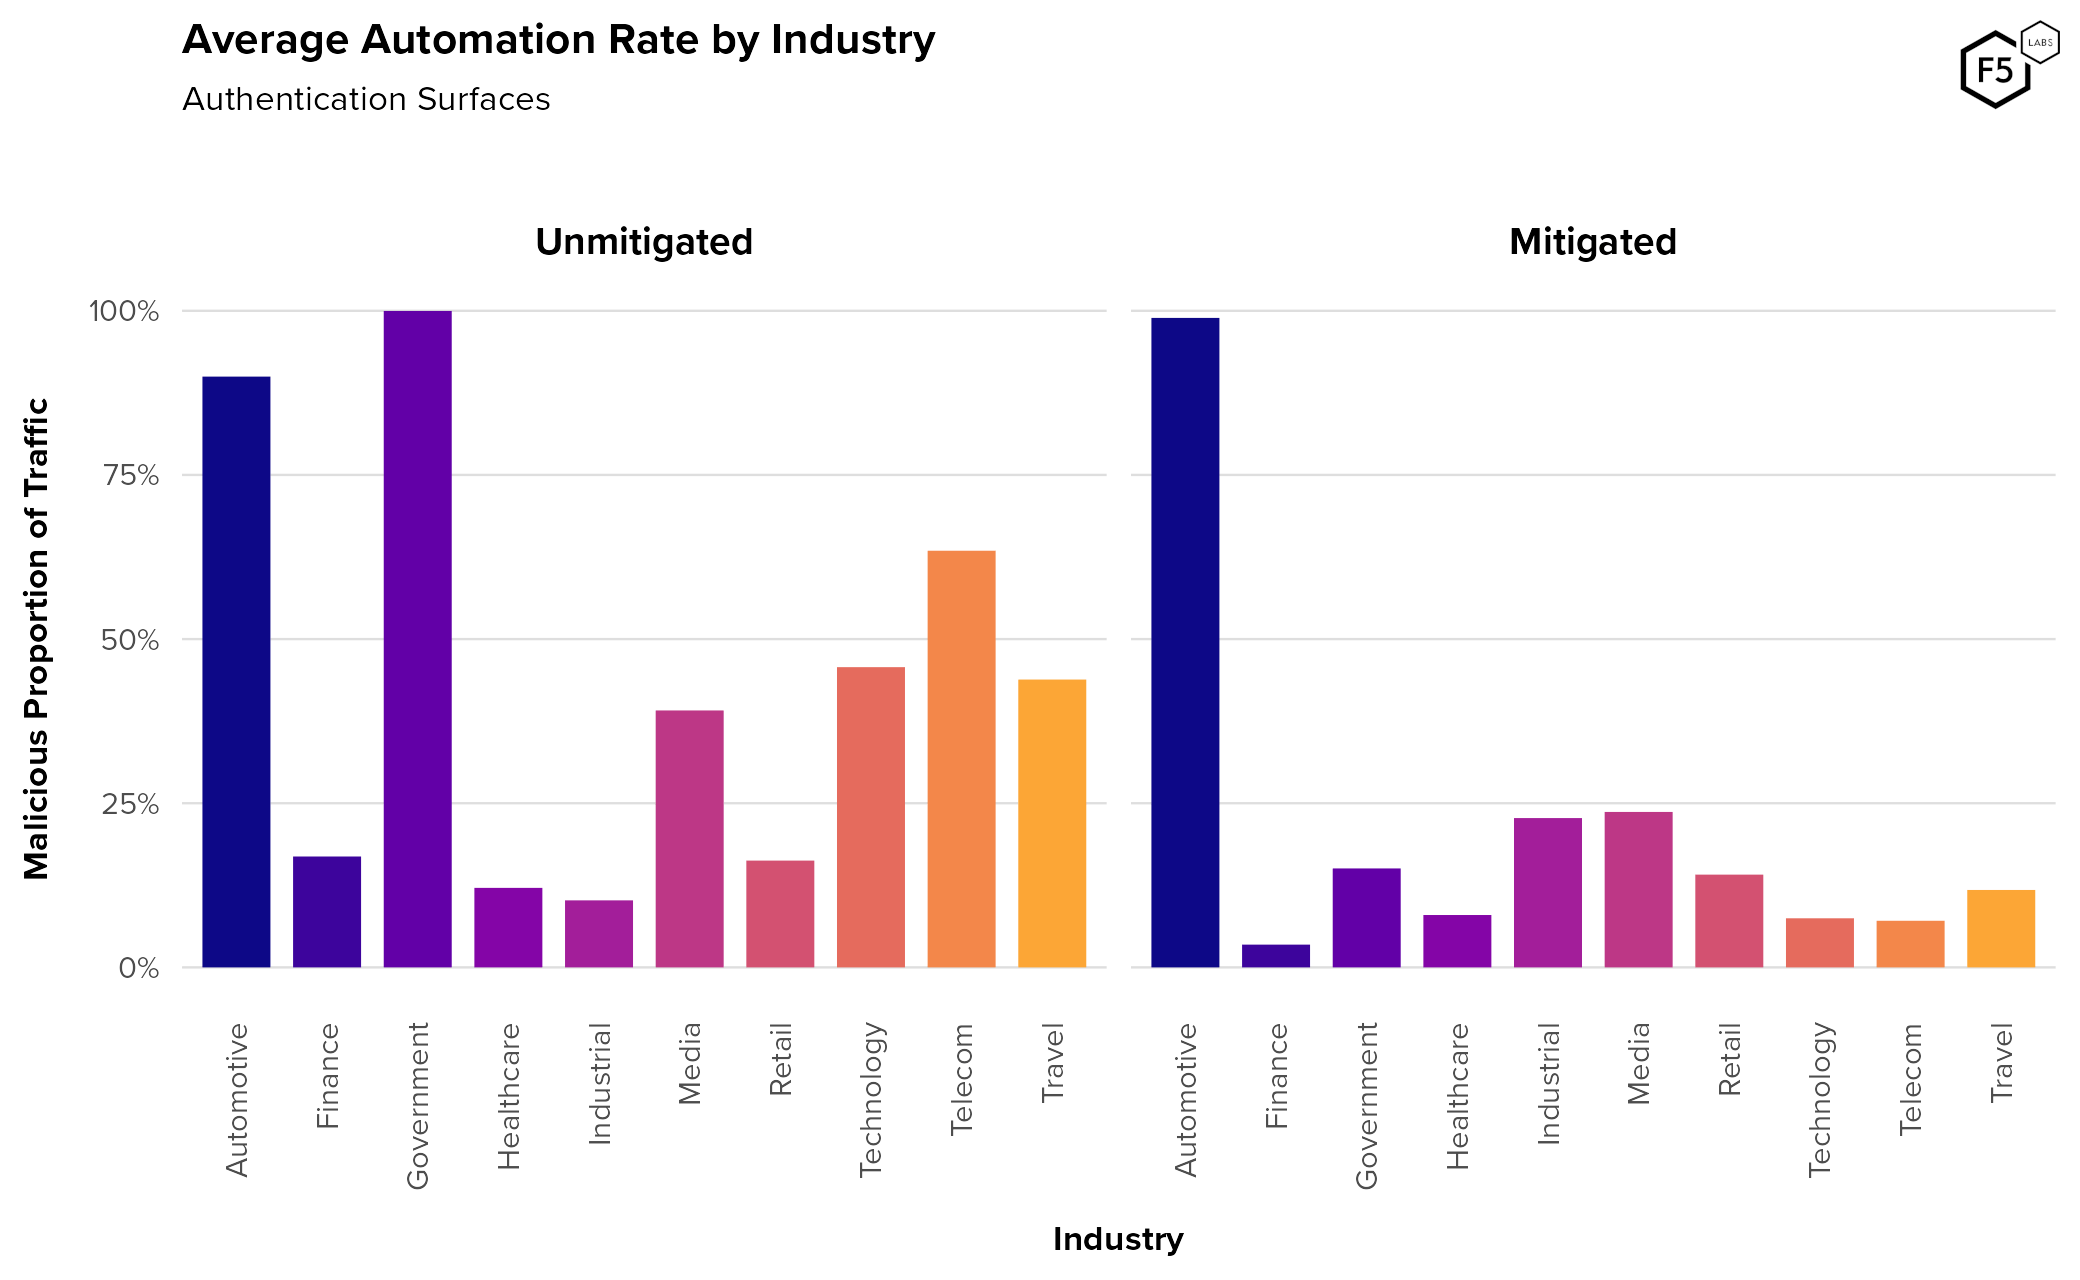
Figure 10. Average automation rate per industry for authentication surfaces. The technology, telecom, and travel industries tend to see the highest rates of pre-mitigation automation. The high findings for government and automotive pre-mitigation are potentially anomalous.
The high rate of malicious automation against the government and automotive sectors is probably anomalous. While there were a number of distinct government organizations across several nation-states in this data set, only one organization had any pre-mitigation telemetry that qualified for our analysis. We therefore have a smaller and potentially less representative sample size of traffic targeting governments, and should treat this finding with caution. Similarly with automotive—this finding is based on a limited amount of time, during which the client was experiencing an attack.
Figure 11 looks at malicious automation rates by industry for account management surfaces. In this view, barring the anomalous automotive industry, the travel industry experienced the highest average malicious automation, at 43%. However, as with the authentication analysis, this high rate for automotive organizations is probably anomalous: there is only one qualifying organization in that sector for account management endpoints, the time period pre-mitigation is very short, and that period was marked by an attack campaign. This observation is probably not representative of a baseline for that industry. In contrast, the travel industry does have a larger and more diverse sample size and so is a more reliable observation.
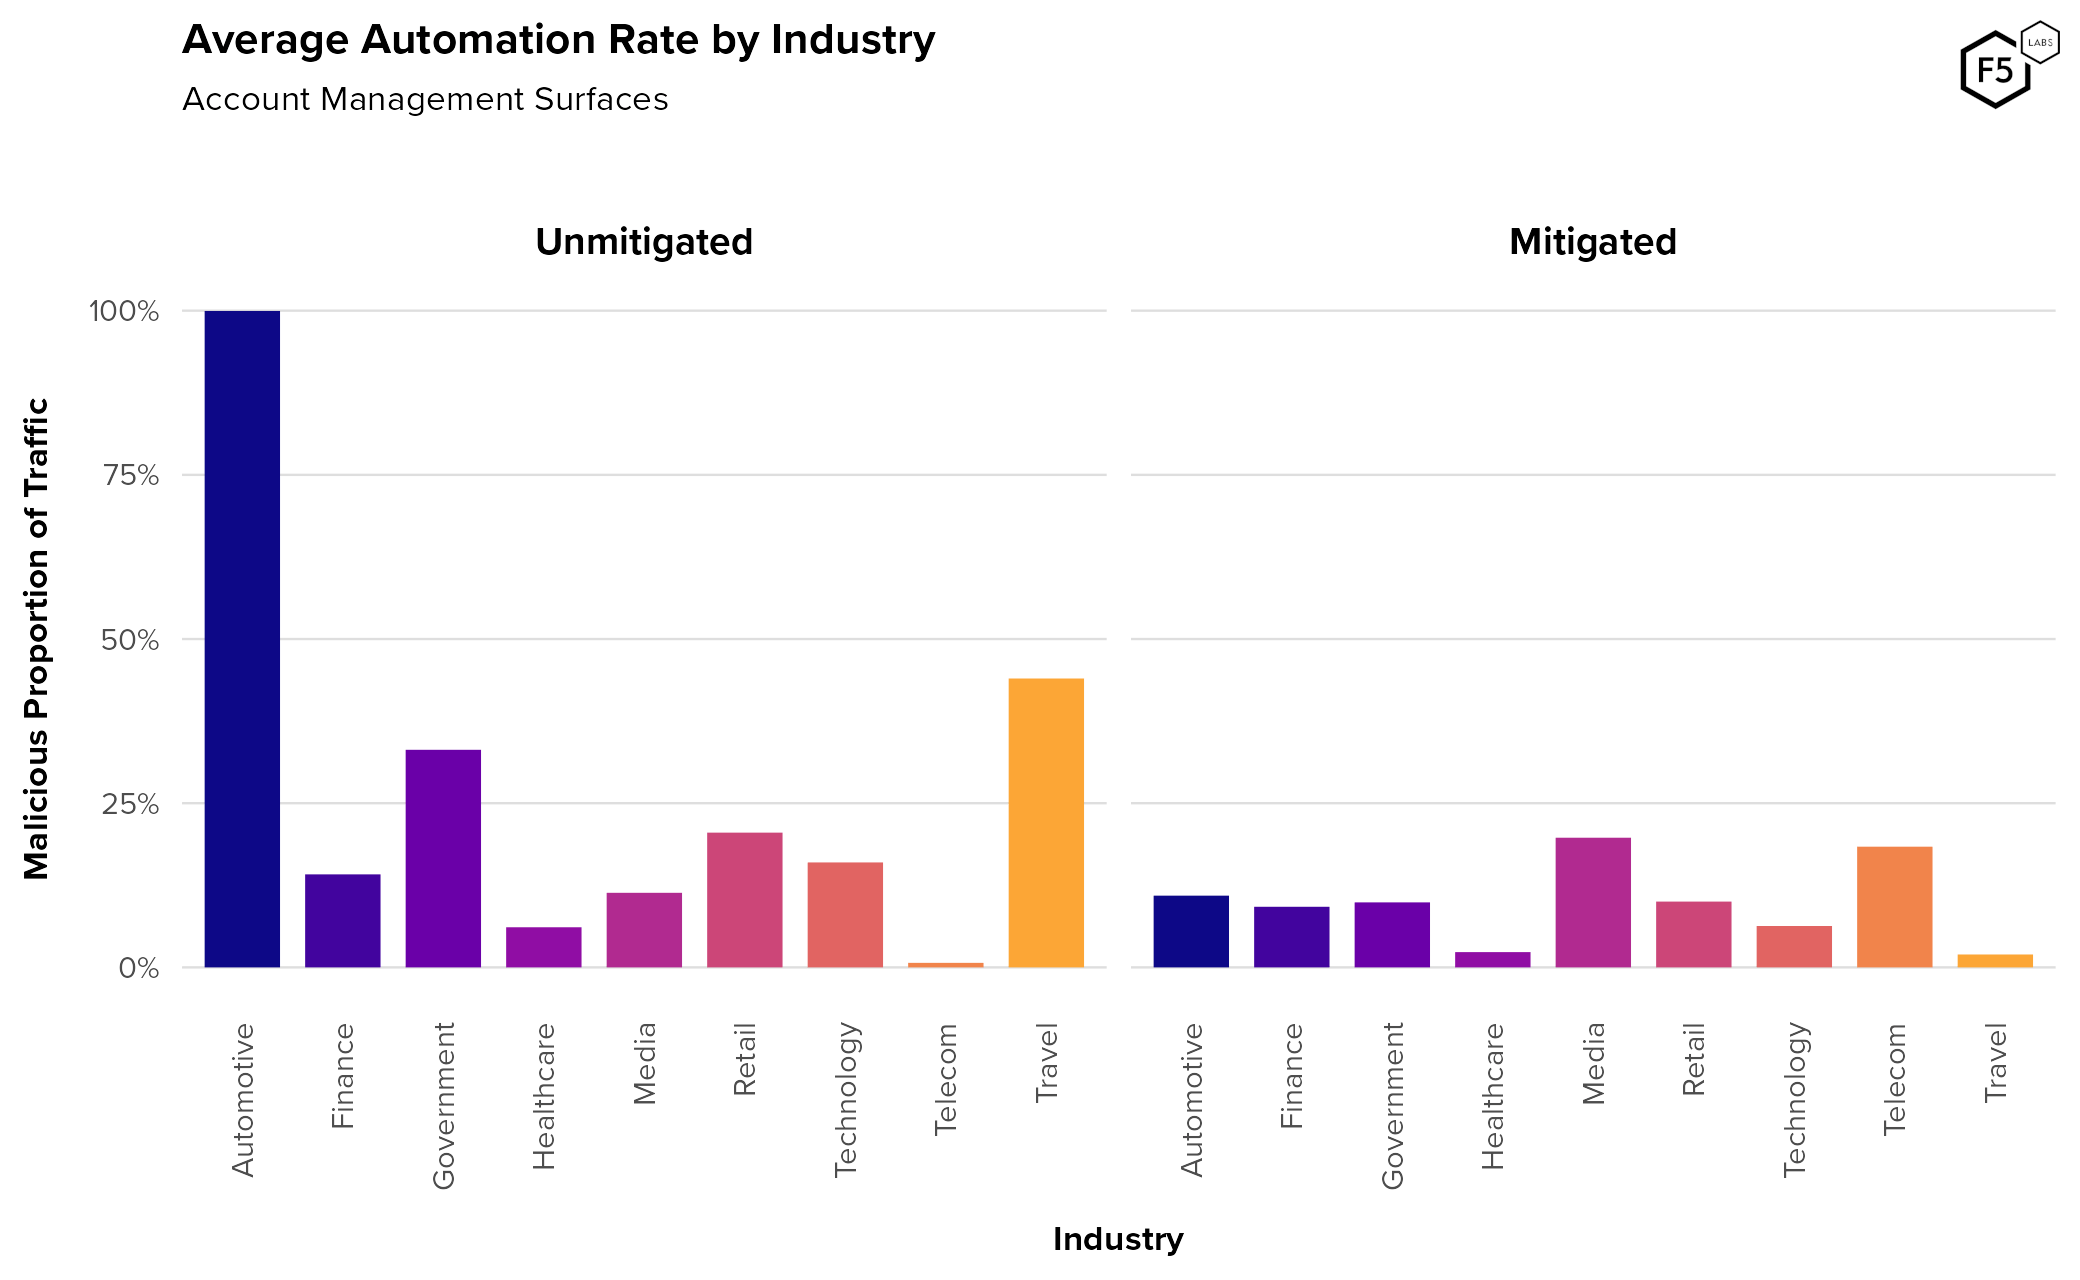
Figure 11. Average automation rate per industry for account management surfaces. The automotive and travel sectors experienced the highest rate of pre-mitigation malicious automation for account management, though the automotive measurement is potentially anomalous.
The sectors that appear overrepresented in Figure 10 and Figure 11 illustrate the effect that the speed of onboarding can have on the telemetry. In both of these cases, organizations came to F5 ready to mitigate as soon as possible, because they were already aware that they were experiencing an impactful attack campaign. In contrast, some organizations prefer to leave the anti-bot controls in observation mode for a long time, or protect a subset of endpoints for testing purposes, until they are confident about the capabilities of the tool. While short onboarding runways often solve customers’ problems, they do skew our data somewhat.
[back to top]
Tactics, Techniques, and Procedures
Now let’s examine attackers’ approaches and toolsets, starting with the question of attacker sophistication. In the context of credential stuffing, we can take for granted that the traffic will be automated because manual, one-at-a-time credential stuffing will never be profitable enough to justify attackers’ time.5 Because of this, the primary differentiator of sophistication in credential stuffing is the extent to which attackers are able to mimic legitimate human traffic, and the primary measure of an anti-bot solution’s capability is its ability to see through this mimicry and correctly identify malicious automated traffic. The rise of anti-bot solutions also means that there is a secondary degree of sophistication, which is the degree to which the threat actor is aware of and able to circumvent or reverse engineer anti-bot solutions.
Attacker Sophistication
There are many different metrics by which F5 evaluates traffic, and we don’t want to reveal too much, so we have simplified these metrics into three strata of sophistication. We will expand more on some of these TTPs in case studies below.
Basic Sophistication
These are attacks in which attackers aren’t trying to emulate human traffic. They often use tools like SentryMBA, Burp Suite, or cURL to send simple HTTP requests. These attacks also contain no effort to circumvent (or detect) an anti-bot solution. Figure 12 is a screenshot of the dark web forum cracked[.]to, showing user “arceustheta08” teaching users how to use Burp Suite for credential stuffing.
![Figure 12. Dark web screenshot from cracked[.]to with instructions for using Burp Suite for credential stuffing.](https://cdn.studio.f5.com/images/k6fem79d/production/6263a010b2468416e0a6b9bbe1a5502149c9504e-2285x1241.png)
Figure 12. Dark web screenshot from cracked[.]to with instructions for using Burp Suite for credential stuffing.
Intermediate Sophistication
Intermediate attackers have succeeded in some aspects of emulation but usually are not successfully simulating full human browsing. Most of the flags for intermediate sophistication arise not from their emulation techniques, but from tampering with the anti-bot solution.
Advanced Sophistication
These are indicative of attackers emulating human browsing behavior with tools like Selenium, Puppeteer, Browser Automation Studio, or custom tools. This traffic is characterized by mouse movements, keystrokes, and realistic screen dimensions, in addition to realistic traffic characteristics such as user agent strings. They are often able to circumvent many of the simpler anti-bot challenges and so are usually identified through subtle inconsistencies in emulation. Occasionally sophisticated attacks require manual identification and the creation of a new signature.
With those definitions out of the way, Figure 13 shows the distribution of sophistication in attacks pre- and post-mitigation. For unmitigated authentication endpoints, basic, low-sophistication attacks made up 65% of malicious traffic, intermediate attacks around 12%, and advanced attacks 20%. Post mitigation, basic attacks fell to 44%, intermediate attacks grew significantly to 27%, and advanced attacks grew slightly to 23%. (As a side note, the reason some of these don’t add all the way up to 100% is due to the presence of some attack flags in the data that do not apply to this analysis.)
For unmitigated account management endpoints, basic attacks made up 64.6% of malicious traffic, intermediate attacks 19.6%, and advanced 15%. Post-mitigation, account management endpoints saw 52.7% basic attacks, 22.3% intermediate attacks, and 22.3% advanced attacks. This higher “retention rate” for unsophisticated attackers on account endpoints might be due to the same fake account forces we identified around Figure 7 above: because fake account attackers know they have the right credentials and often have significant value invested, unsophisticated actors might stick around for longer than they would if they were credential stuffing authentication endpoints.
In summary: across all four combinations (authentication or accounts, mitigated or unmitigated), basic attacks constitute the largest proportion of traffic. The only category in which basic attacks didn’t constitute the outright majority was for post-mitigation authentication surfaces. Generally speaking, authentication endpoints experienced higher proportional sophistication than account management endpoints.
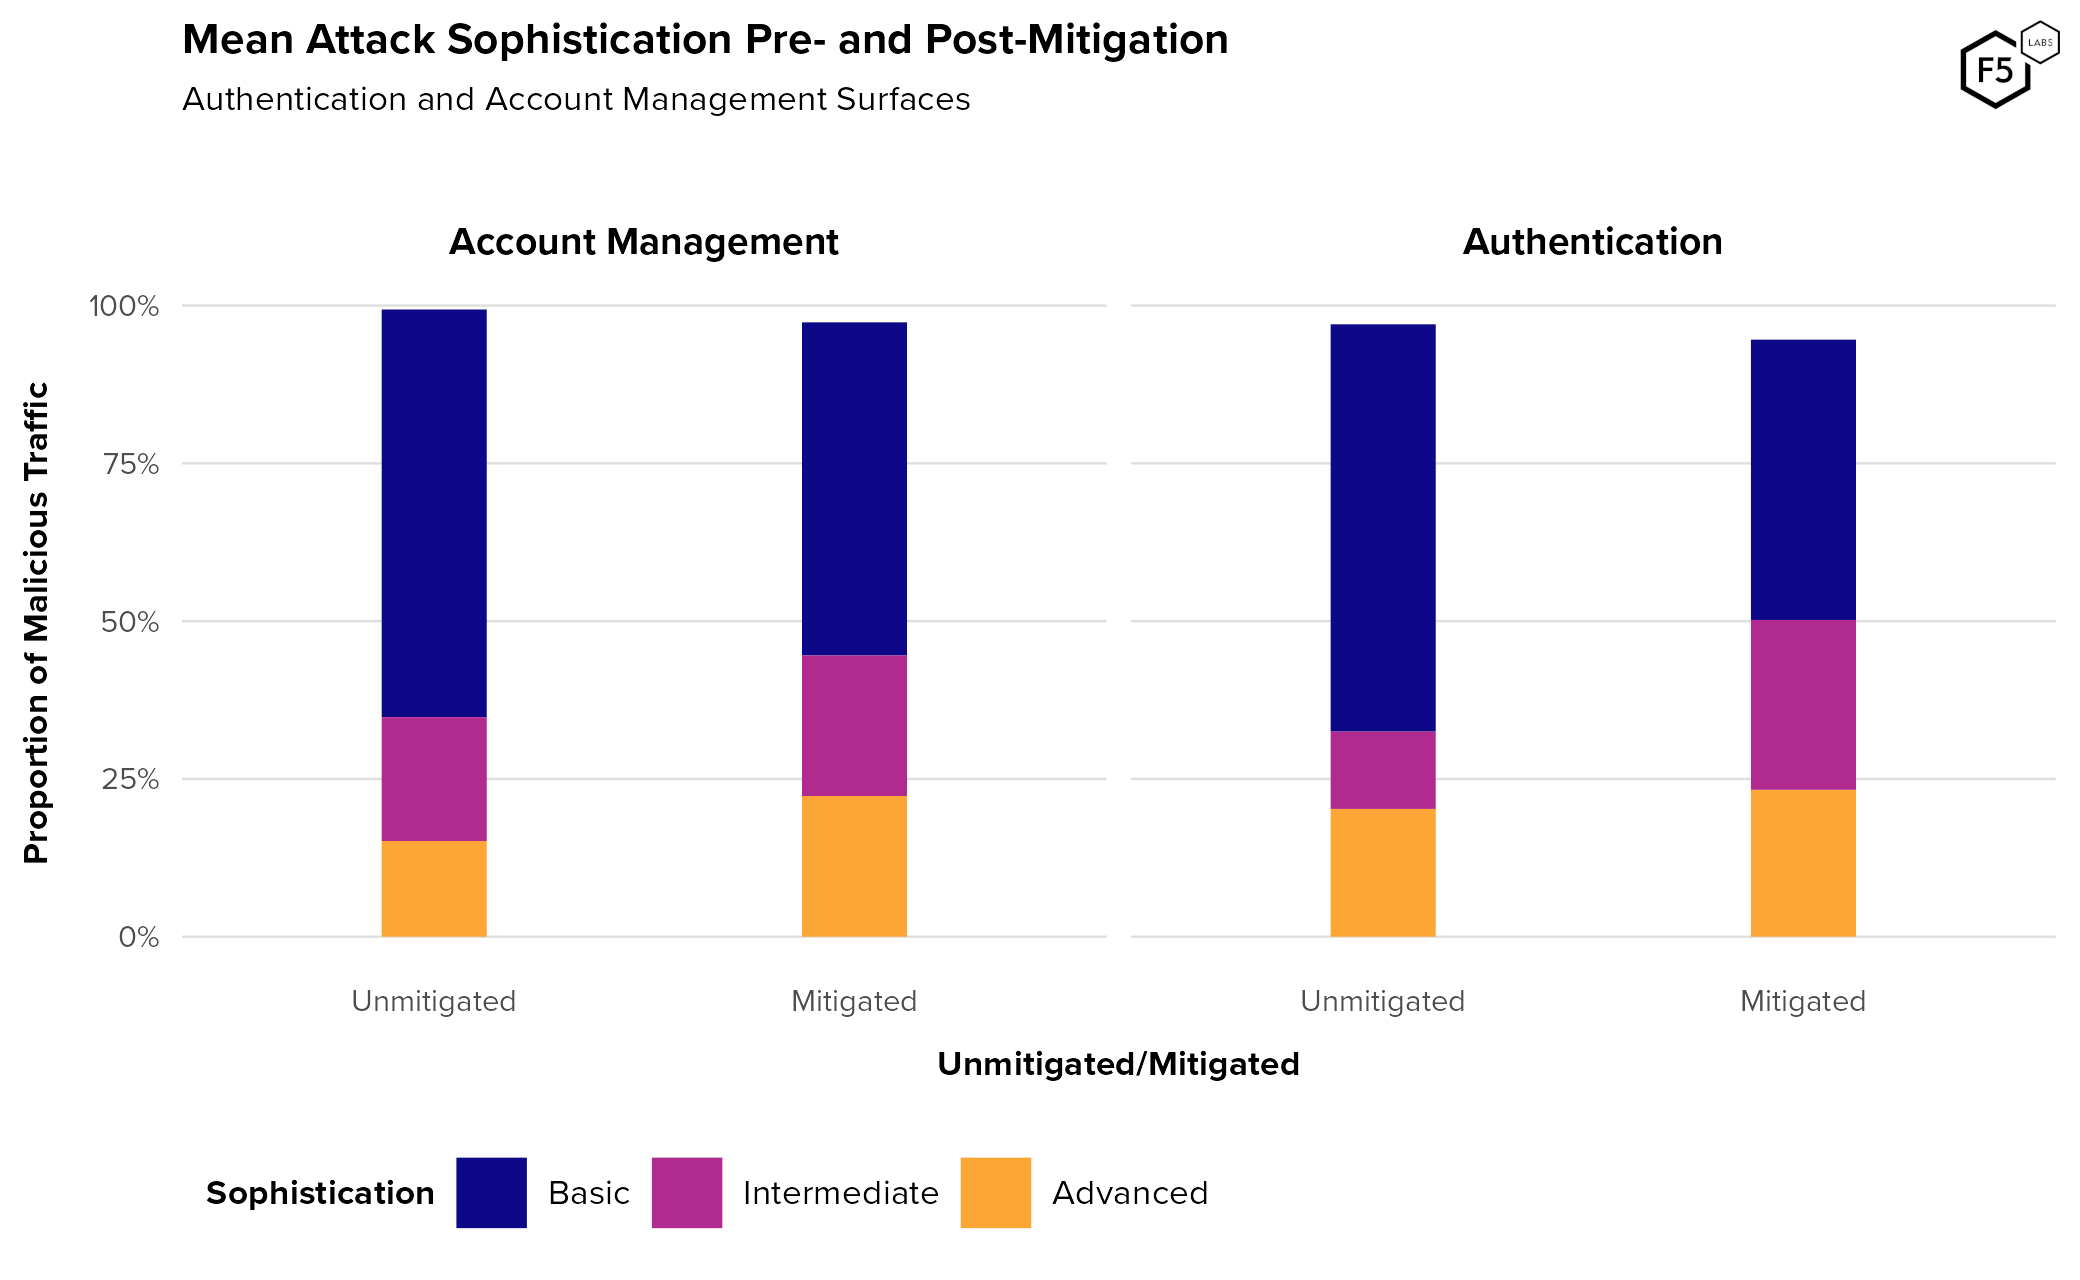
Figure 13. Average attack sophistication as a proportion of attack traffic. Note that post-mitigation attacks tend to have a slightly higher level of sophistication, although not to a significant degree.
We approached this analysis with a specific hypothesis in mind, which was that enabling mitigation would result in a shift towards greater proportional sophistication, as unsophisticated actors moved on and those with greater capabilities brought them to bear.6 Figure 13 reveals that the hypothesis appears valid but not dramatic. For both Authentication and Account Management endpoints, turning on mitigation mode resulted in a shift toward higher sophistication, although on different levels for the two different types of flows: whereas advanced attacks grew the fastest upon mitigation for account management flows, authentication flows saw much more growth in intermediate attacks, that is, attacks that attempted but failed to circumvent anti-bot tools. At the same time, authentication still experienced a higher proportion of advanced techniques in both periods.
If we break that down by industry (Figure 14), the trend towards greater sophistication upon mitigation, particularly due to a decline in basic traffic, is clear across nearly all sectors and endpoints. A few distinctions between sectors are apparent, although again, nothing appears extremely conclusive.
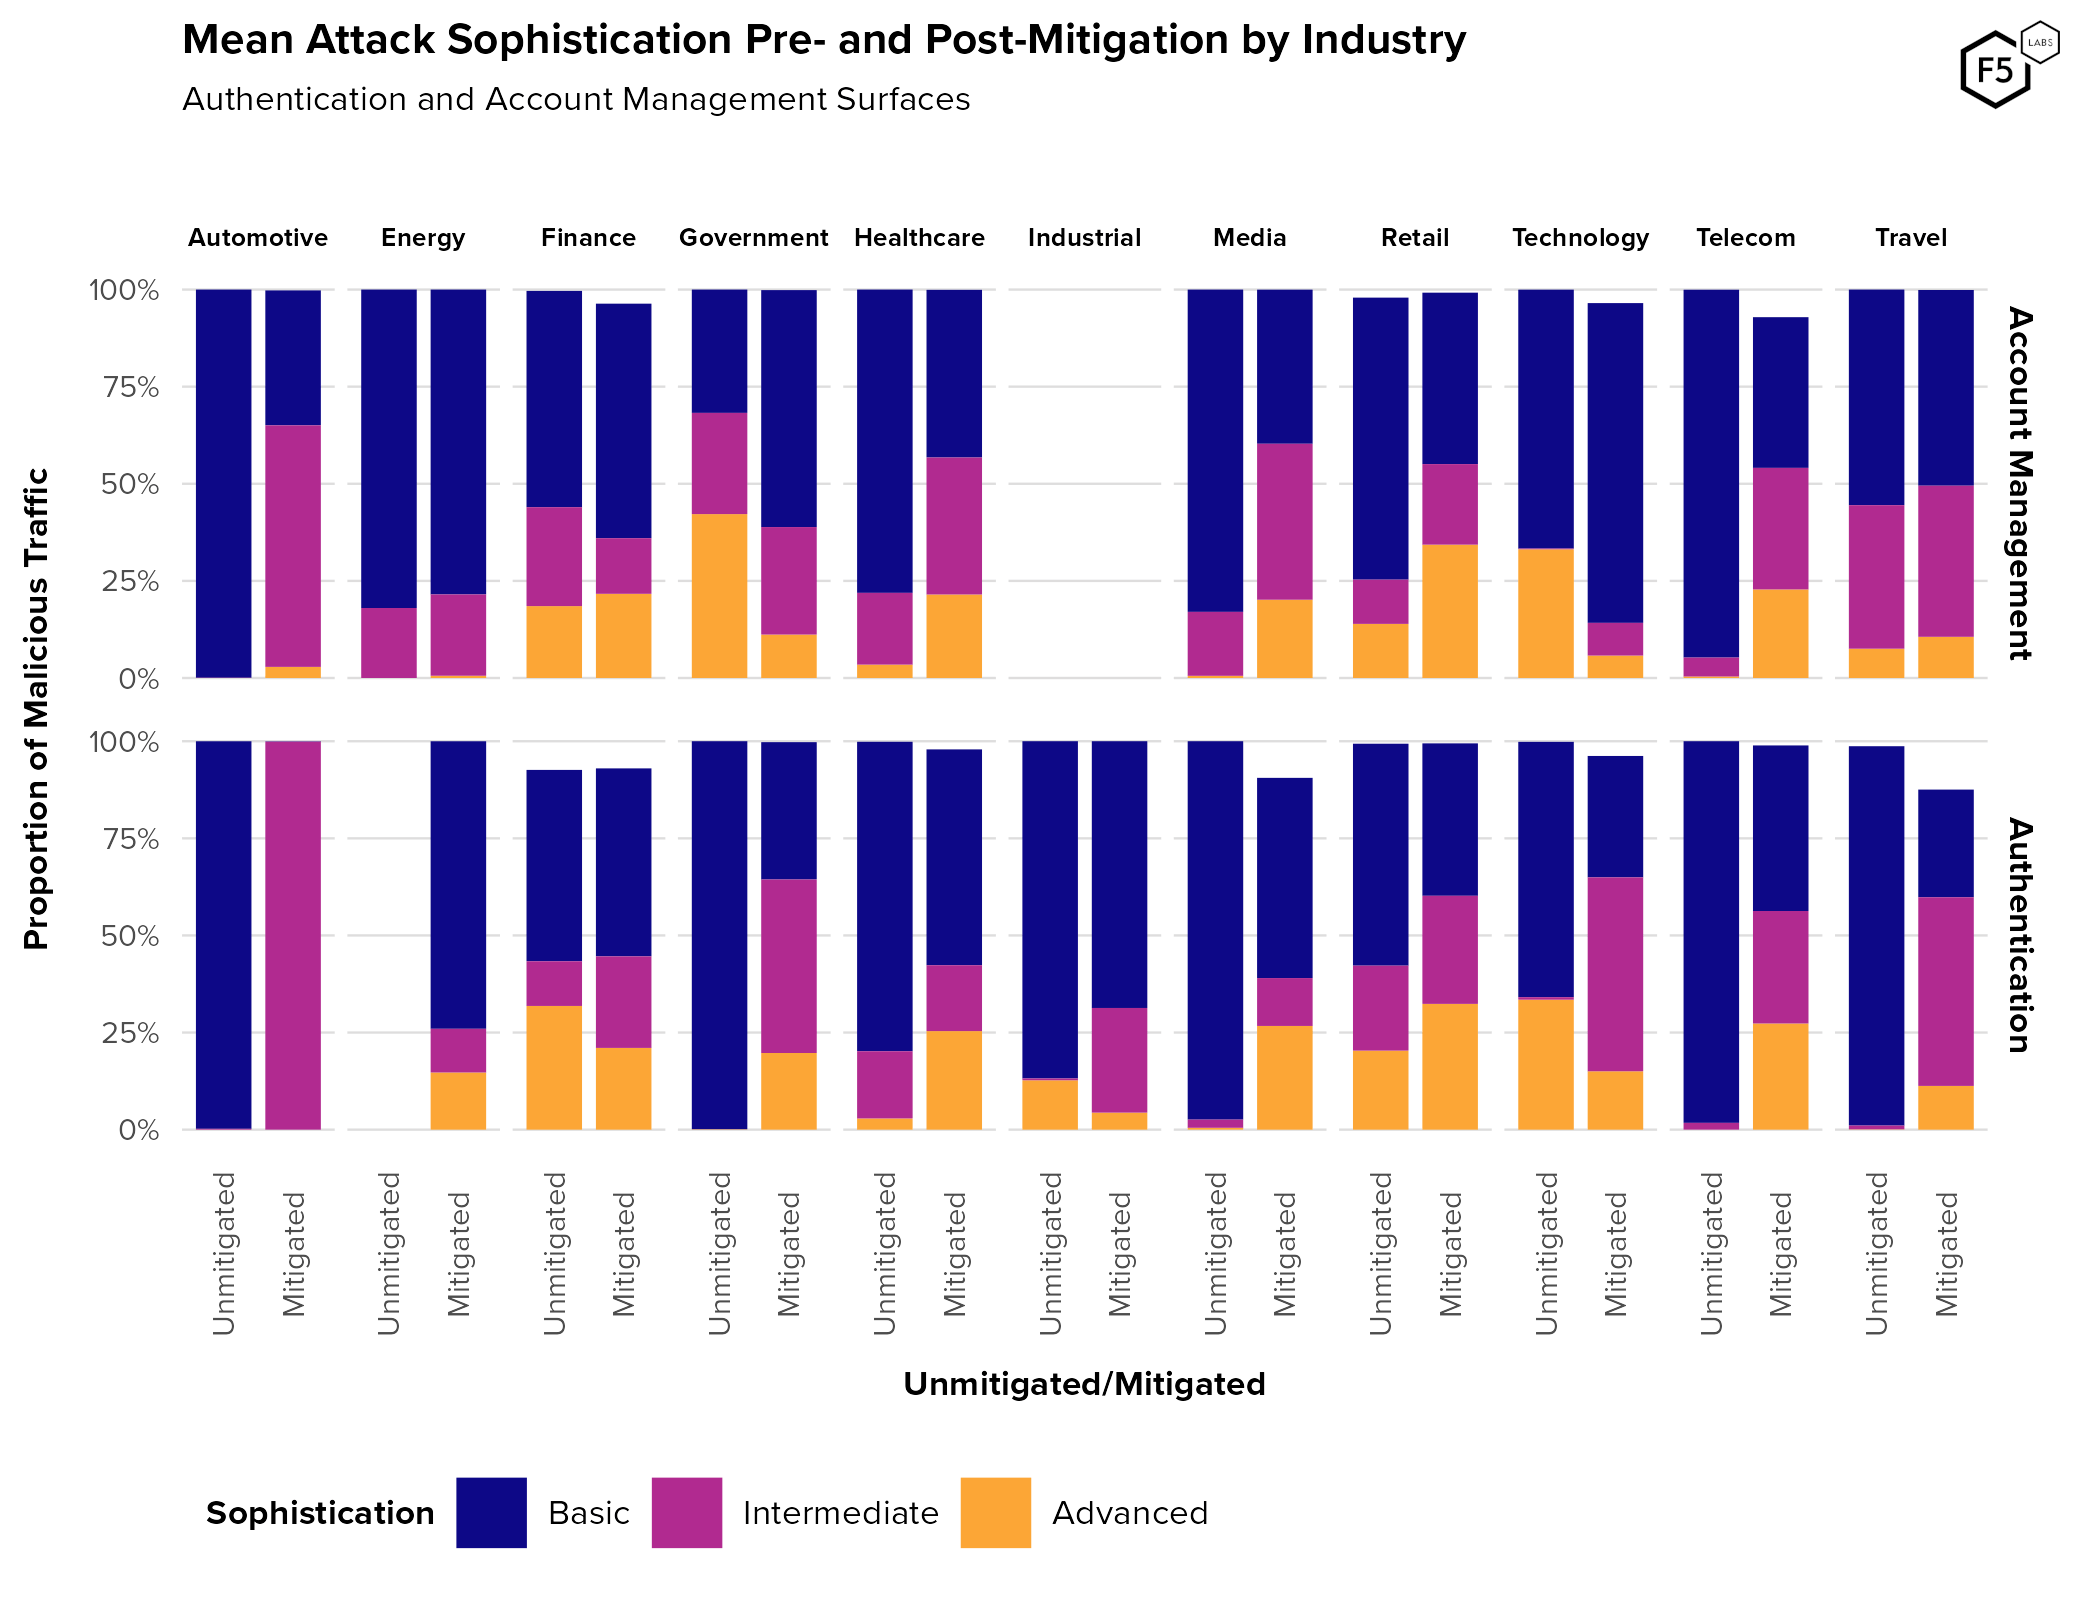
Figure 14. Proportion of attack sophistication by industry, pre- and post-mitigation. Finance and technology saw a proportional decrease in advanced attackers following mitigation, while healthcare, retail, and travel experienced slight increases in sophistication post-mitigation.
It is important to note that each sector showed significant internal variation. The largest technology customer in terms of volume of traffic experienced an attack campaign of strictly advanced attacks numbering in the billions, which means that looking at attack volumes instead of proportions tends to skew that sector toward a higher level of sophistication, even when normalized for the number of organizations in that sector. In summary, while industries/sectors can be a useful way to informally sort organizations, this data does not reveal strong relationships between a target’s industry and how attackers go after it. Our guess is that attackers chose targets based on more organization-centric criteria such as their individual security posture and the exact type of data available for extraction.
Attack Velocity
The question of attack velocity, or intensity over time, is also important for detecting and mitigating attacks. Occasionally credential stuffing or brute force attacks can be so intense that they unintentionally create a denial-of-service attack on an authentication function. Conversely, it is a widely held belief in the cybersecurity community that more advanced attacks tend to happen at a lower volume—in other words, script kiddies go big and loud, whereas skilled attackers like to go low and slow. We examined this hypothesis in Figure 15, which plots a distribution of hourly attack velocity, broken out by sophistication. Please note the log10 y-axis.
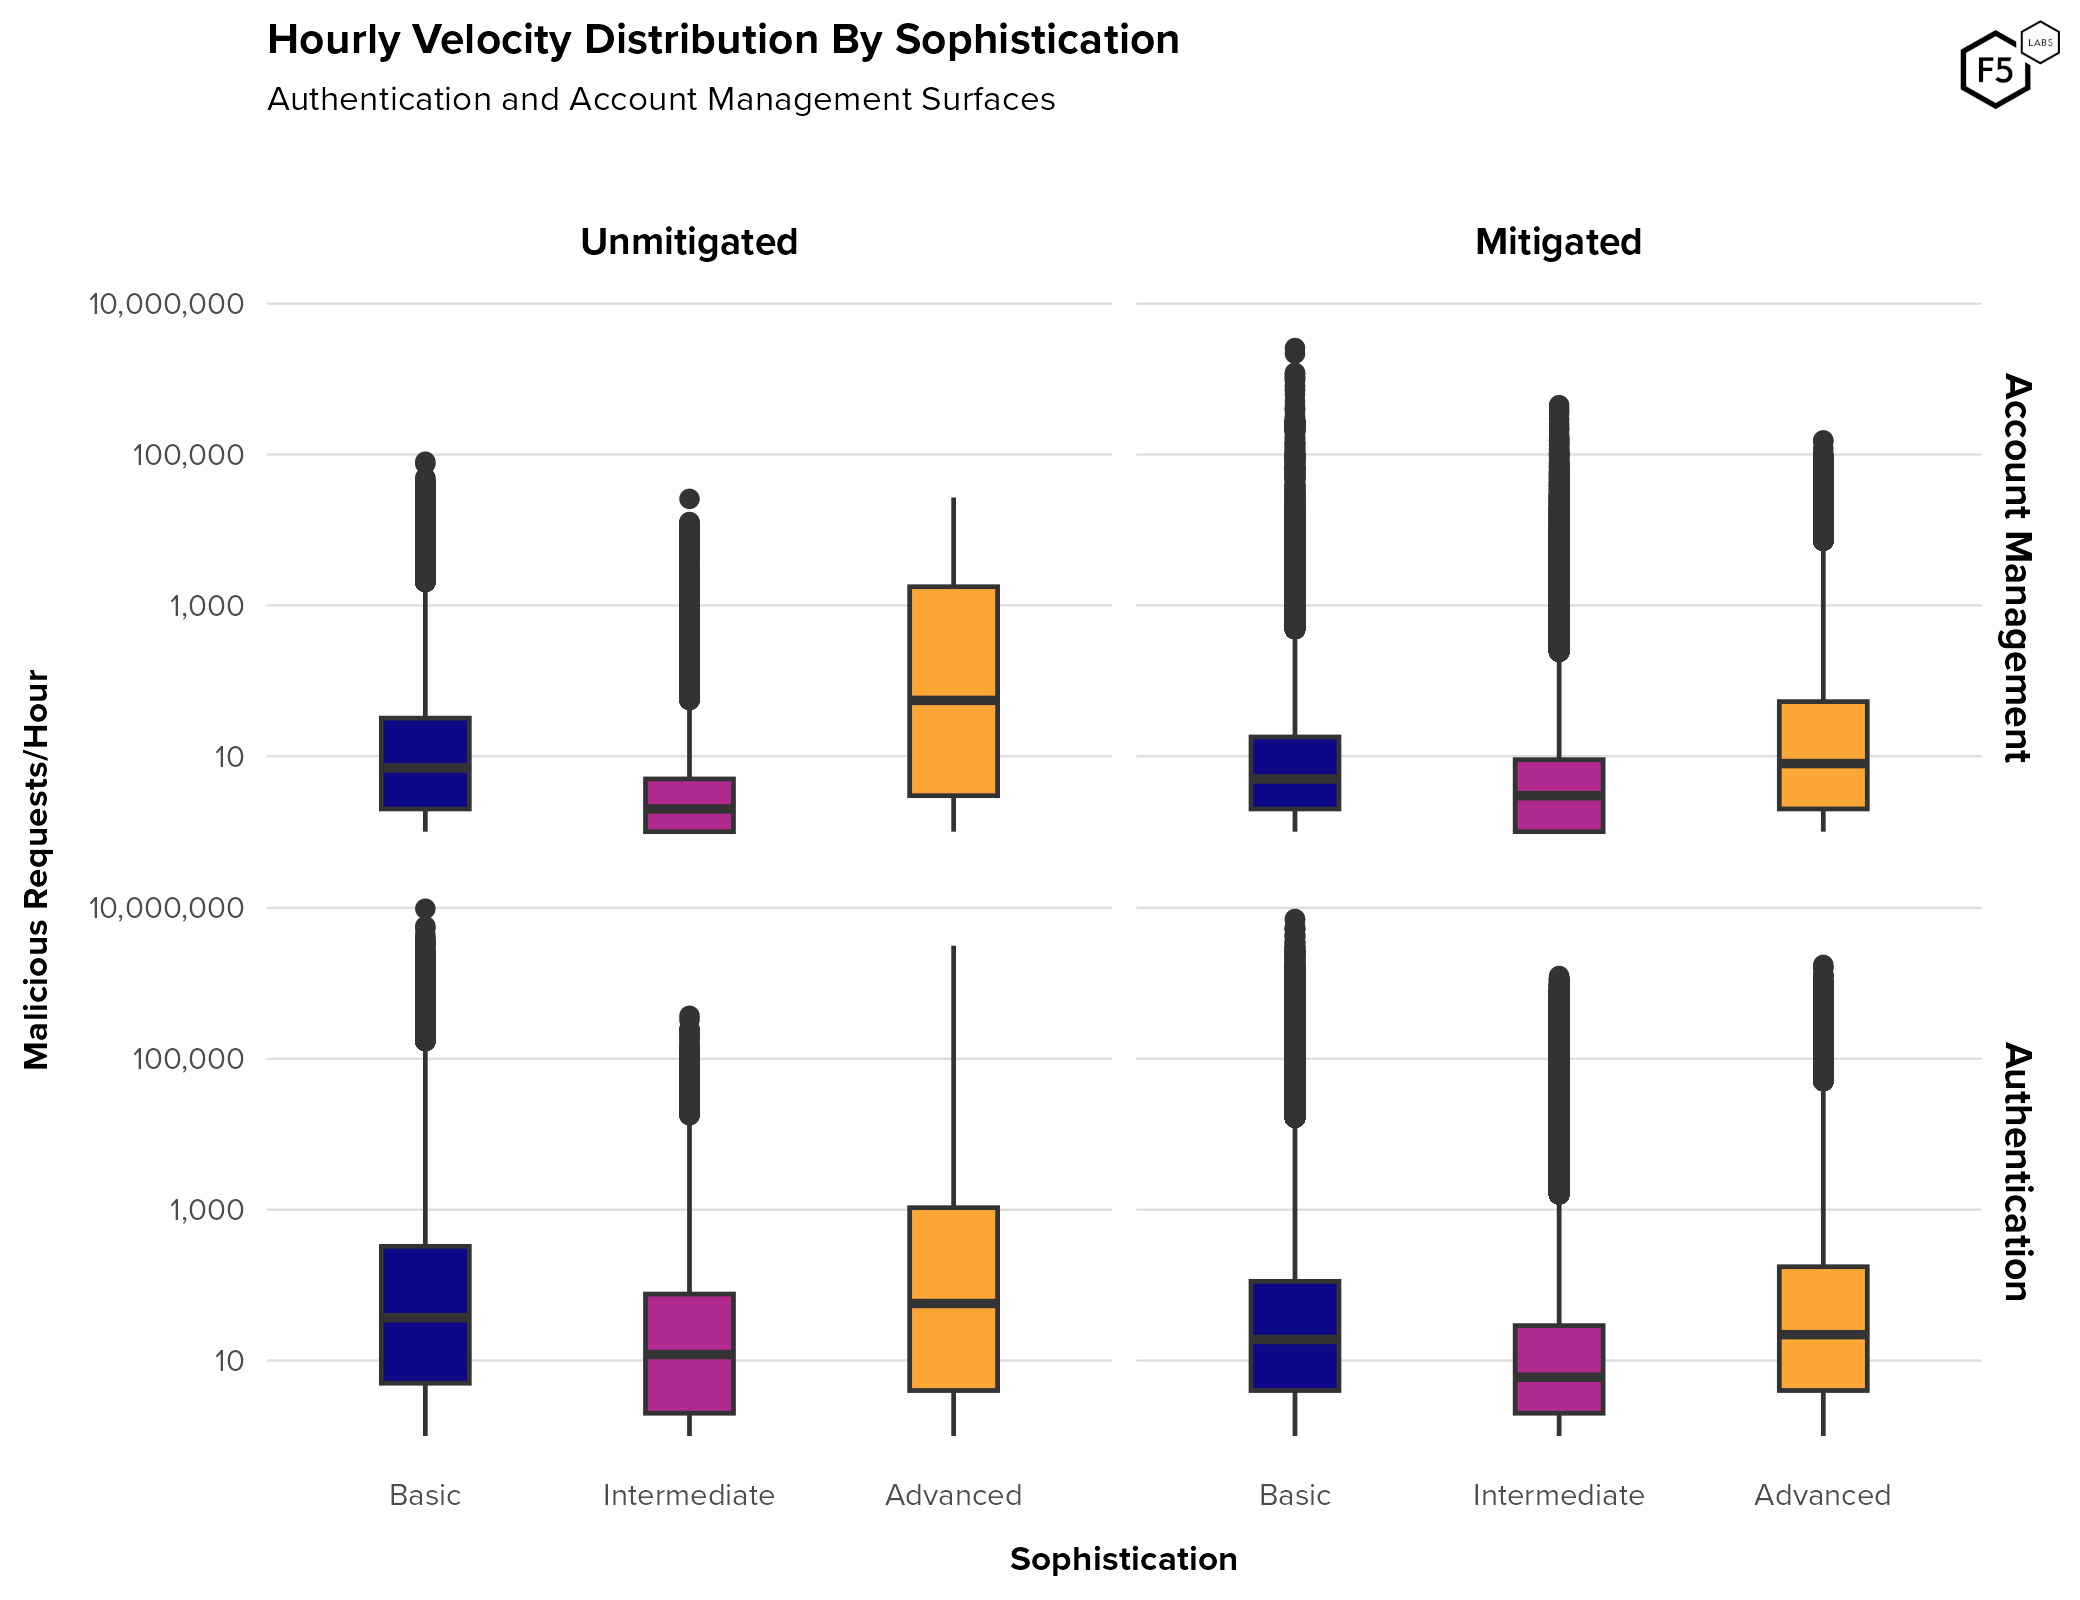
Figure 15. Hourly velocity by sophistication. Note log10 y-axis. For unmitigated authentication attacks, the basic sophistication category contained the attacks with the highest maximum velocity, but advanced attacks had the highest median velocity. Post-mitigation, most groups tended to decline in median velocity.
In all combinations of sophistication and mitigation, authentication surfaces saw higher median and maximum velocities than account management surfaces. This is unsurprising given the higher absolute volume of attacks against authentication. We were surprised to see that velocity did not diminish significantly upon mitigation for most combinations of sophistication and flow. This data seems to repudiate the low-and-slow hypothesis, in that advanced attackers hit their targets at similar rates of intensity to more basic attacks, and sometimes even with greater intensity. However, note that maximum values and outliers for basic attacks remain the highest for all four categories (the log10 y-axis actually downplays this phenomenon). This might be the source of the popular wisdom about sophisticated actors going low and slow.
Since we know that automation rates (that is, malicious traffic as a proportion of all traffic) go down post-mitigation but hourly velocity appears to stay roughly the same, we can reasonably conclude that attack traffic post-mitigation will become spikier and less consistent post-mitigation as well. This is difficult to assess when comparing across customers, but is easily observable in a single customer’s traffic (Figure 16), and is consistent with observations from the analytics team that specializes in this telemetry.
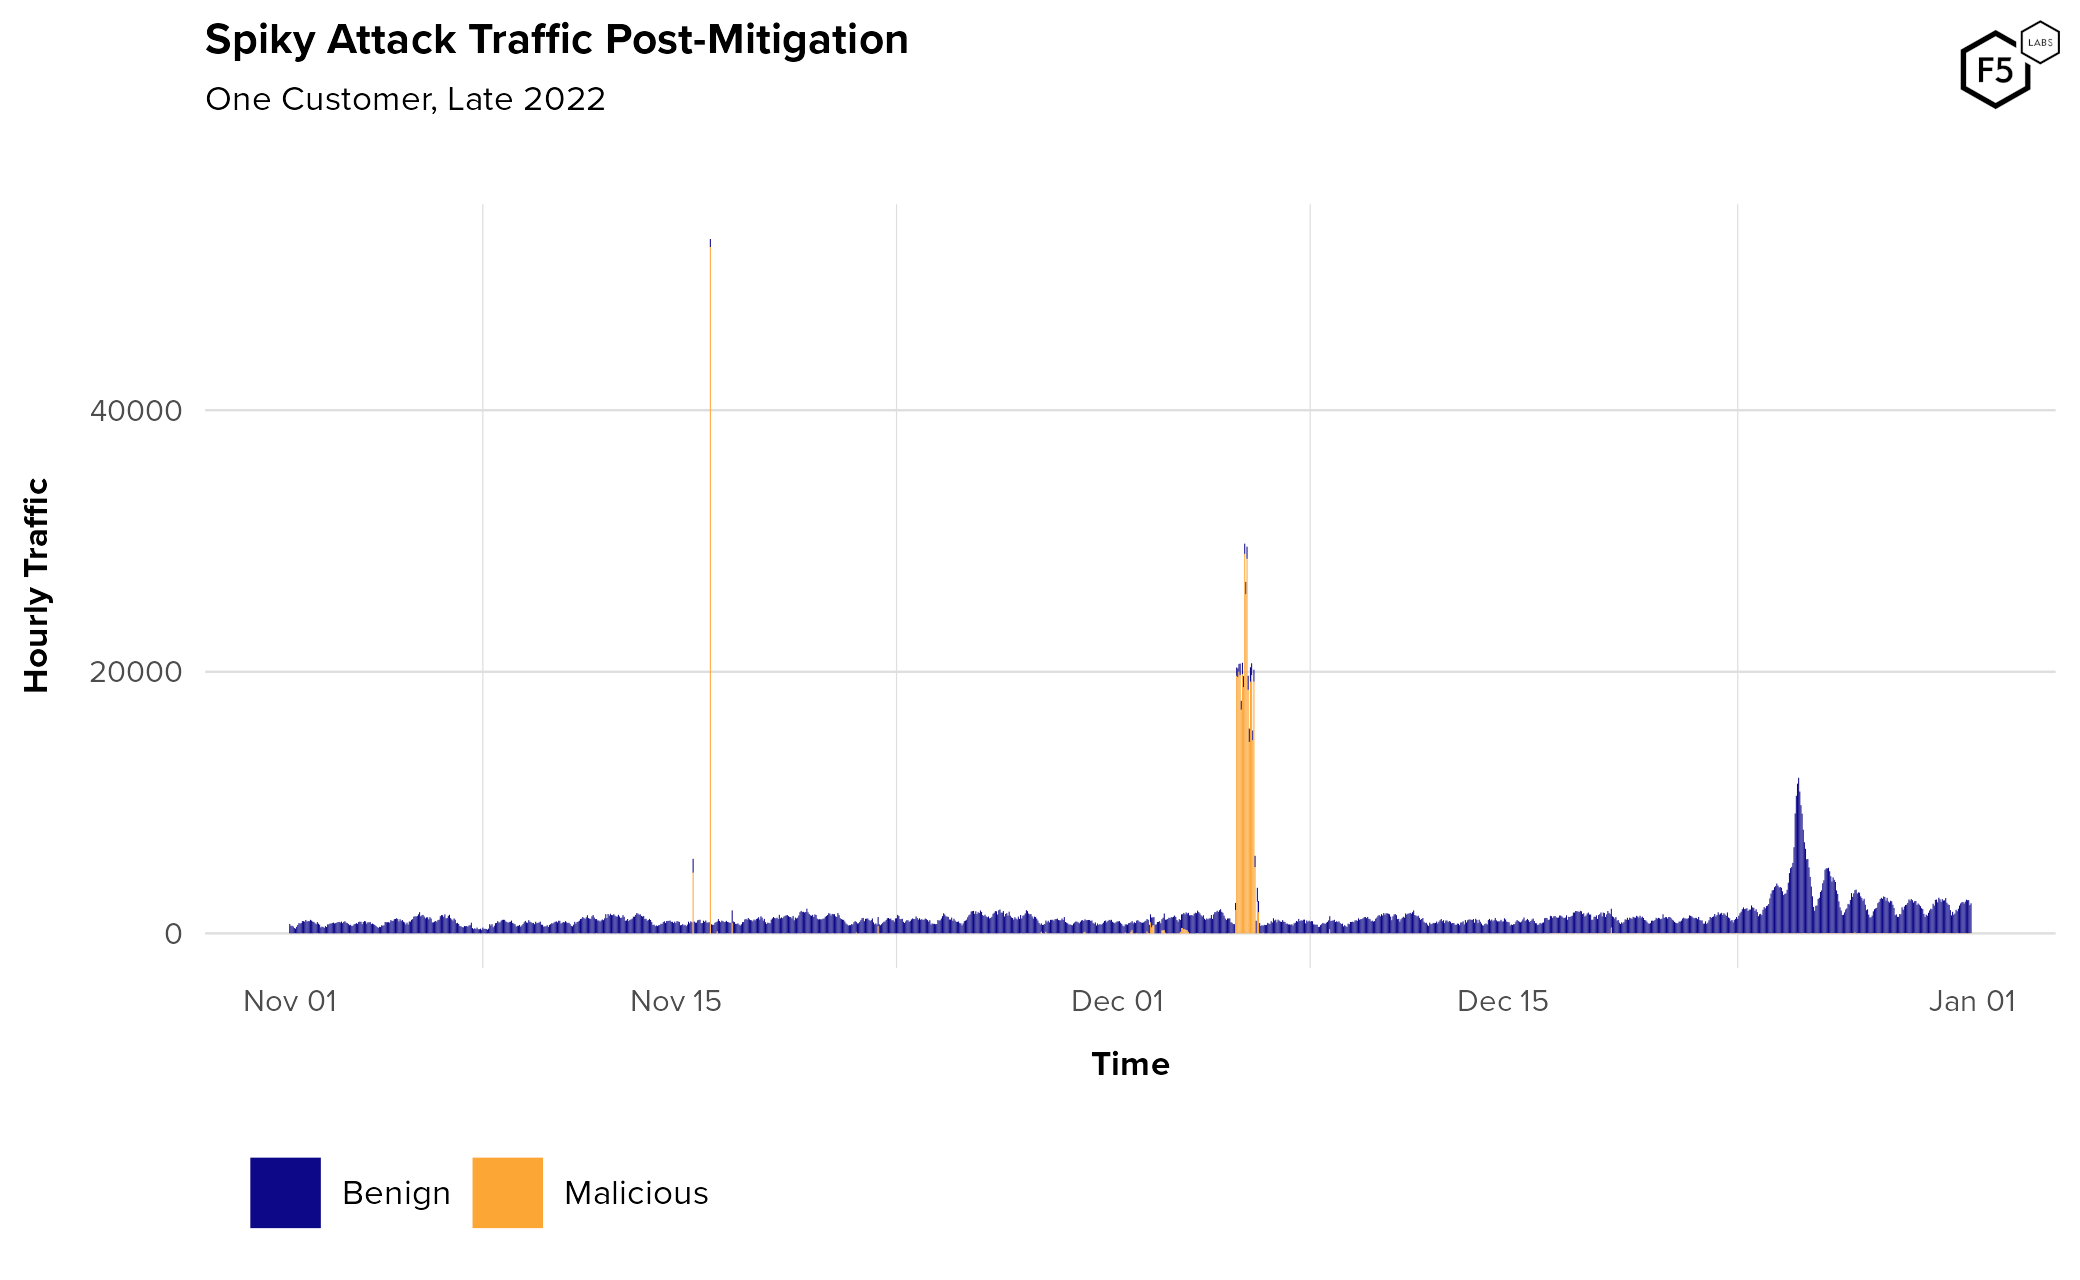
Figure 16. Spiky attack traffic post-mitigation. Note the subtle daily pattern in the non-malicious traffic, and how much the attack campaign dwarfs normal baselines.
Success Rates, Canary Accounts, and Aggregators
The question of sophistication leads naturally into the question of success rates—that is, how many of these credential stuffing attacks successfully submit the right combination of credentials? Many organizations use low authentication success rates as an indicator of credential stuffing attacks, and this is borne out by our experience: generally speaking, most confirmed credential stuffing attacks have the right credentials in about 1-2% of submissions. However, success rates are also surprisingly variable and require more complex analysis to understand, both because of malicious adaptations and because of confounding variables.
Canary accounts represent a way for attackers to gain information and manipulate authentication telemetry using accounts under their control. Canary accounts can be fake accounts created expressly for this purpose, or can be accounts that have previously been compromised (either by the same threat actor or by another one). Because attackers know that the credentials they hold for the canary account are valid they serve two primary purposes: attackers can repeatedly authenticate to these accounts, which can mask other unsuccessful attempts by artificially inflating authentication success rates. For instance, if an attacker authenticates to a canary account once for each credential stuffing attempt, then the success rate for the entire set of traffic will never go below 50% because there is one valid attempt for every failed one.
They can also use canary accounts to detect anti-bot countermeasures. If an attacker logs into a canary account for which they know they have the correct credentials, they know their other automated attacks are failing because they are being mitigated, and not necessarily because the credentials are invalid. This is the source for the name canary account, since it serves as a canary in the proverbial coal mine.
Figure 17 and Figure 18 show an attack campaign against a customer in which an attacker logged into a single canary account 37,000,000 times over about a week, allowing them to maintain a success rate for the entire attack of 13%, and pulling their instantaneous success rate over 40%.
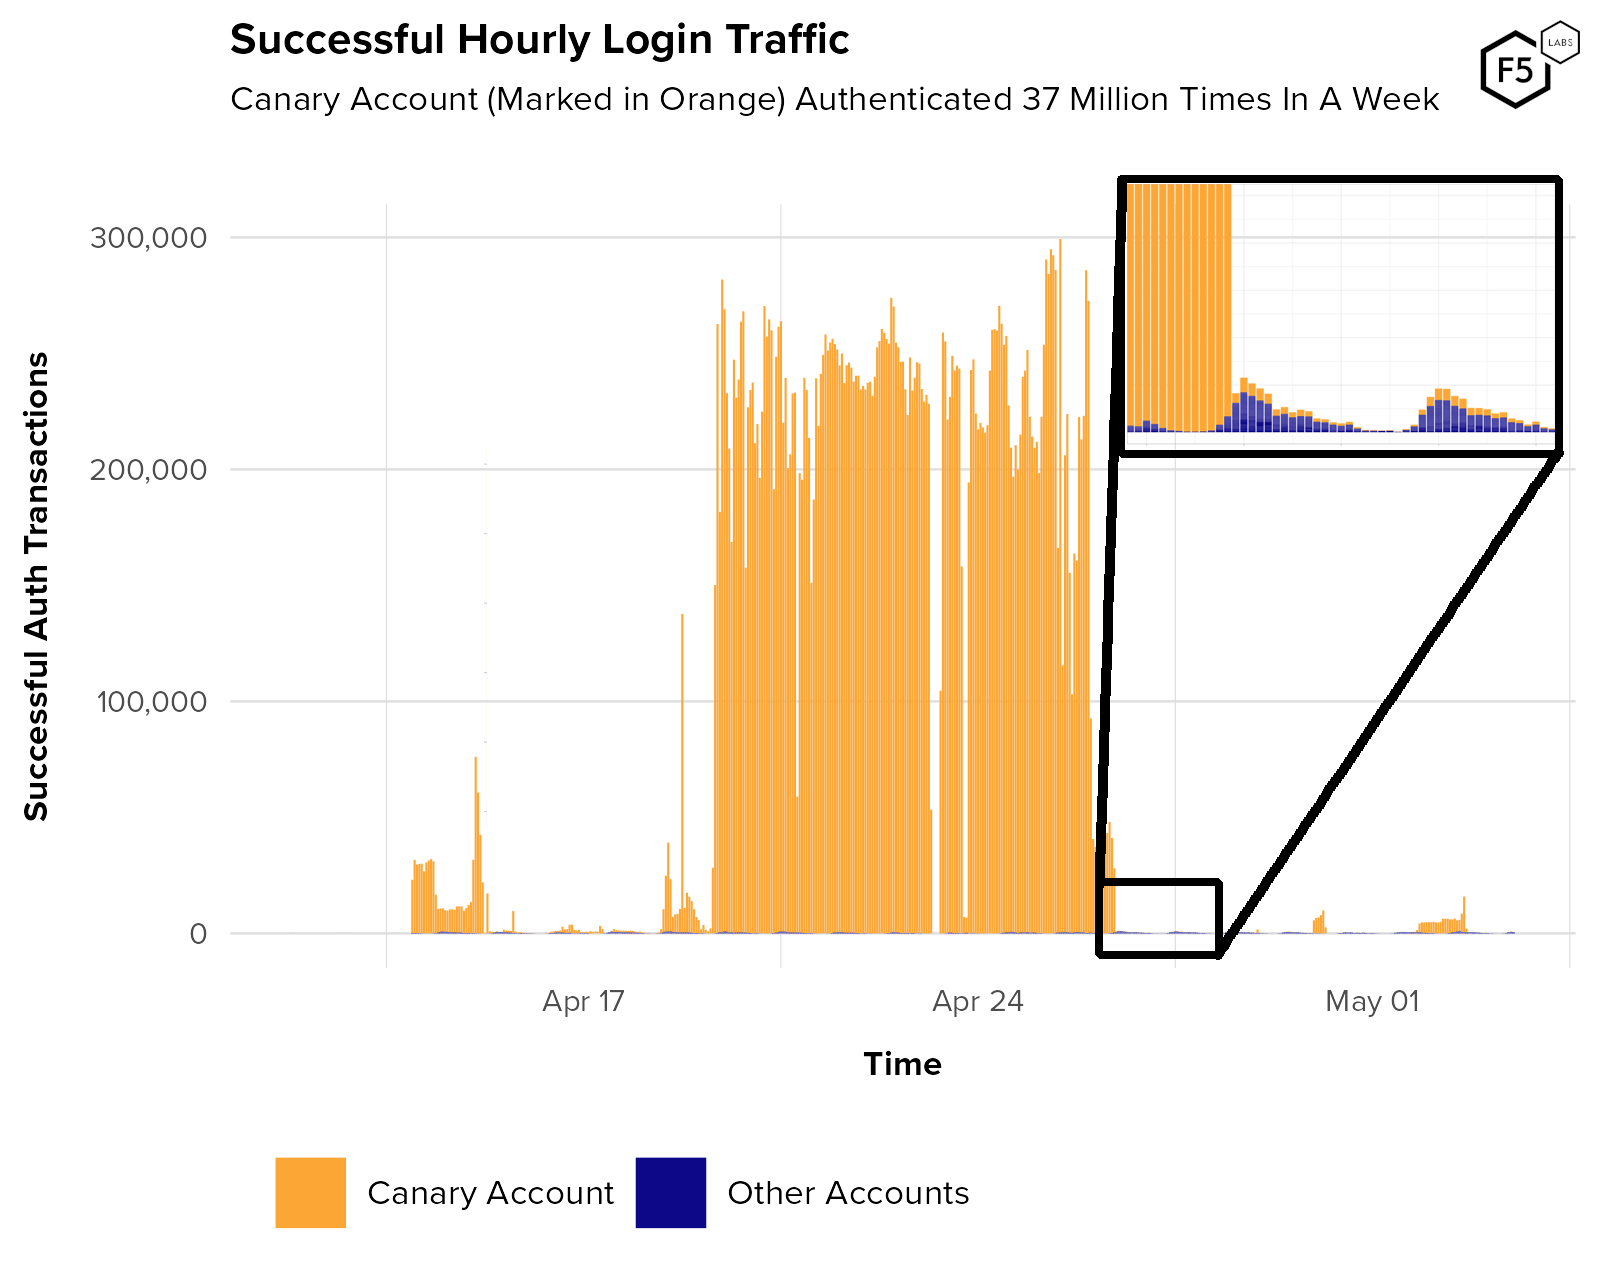
Figure 17. Plot showing successful authentications against a single customer. Authentication traffic from a single canary account is marked in orange. All legitimate authentication traffic, marked in blue, is just visible as a tiny proportion at the bottom. This attacker was using the canary account to inflate their success rate, visible in the plot below.
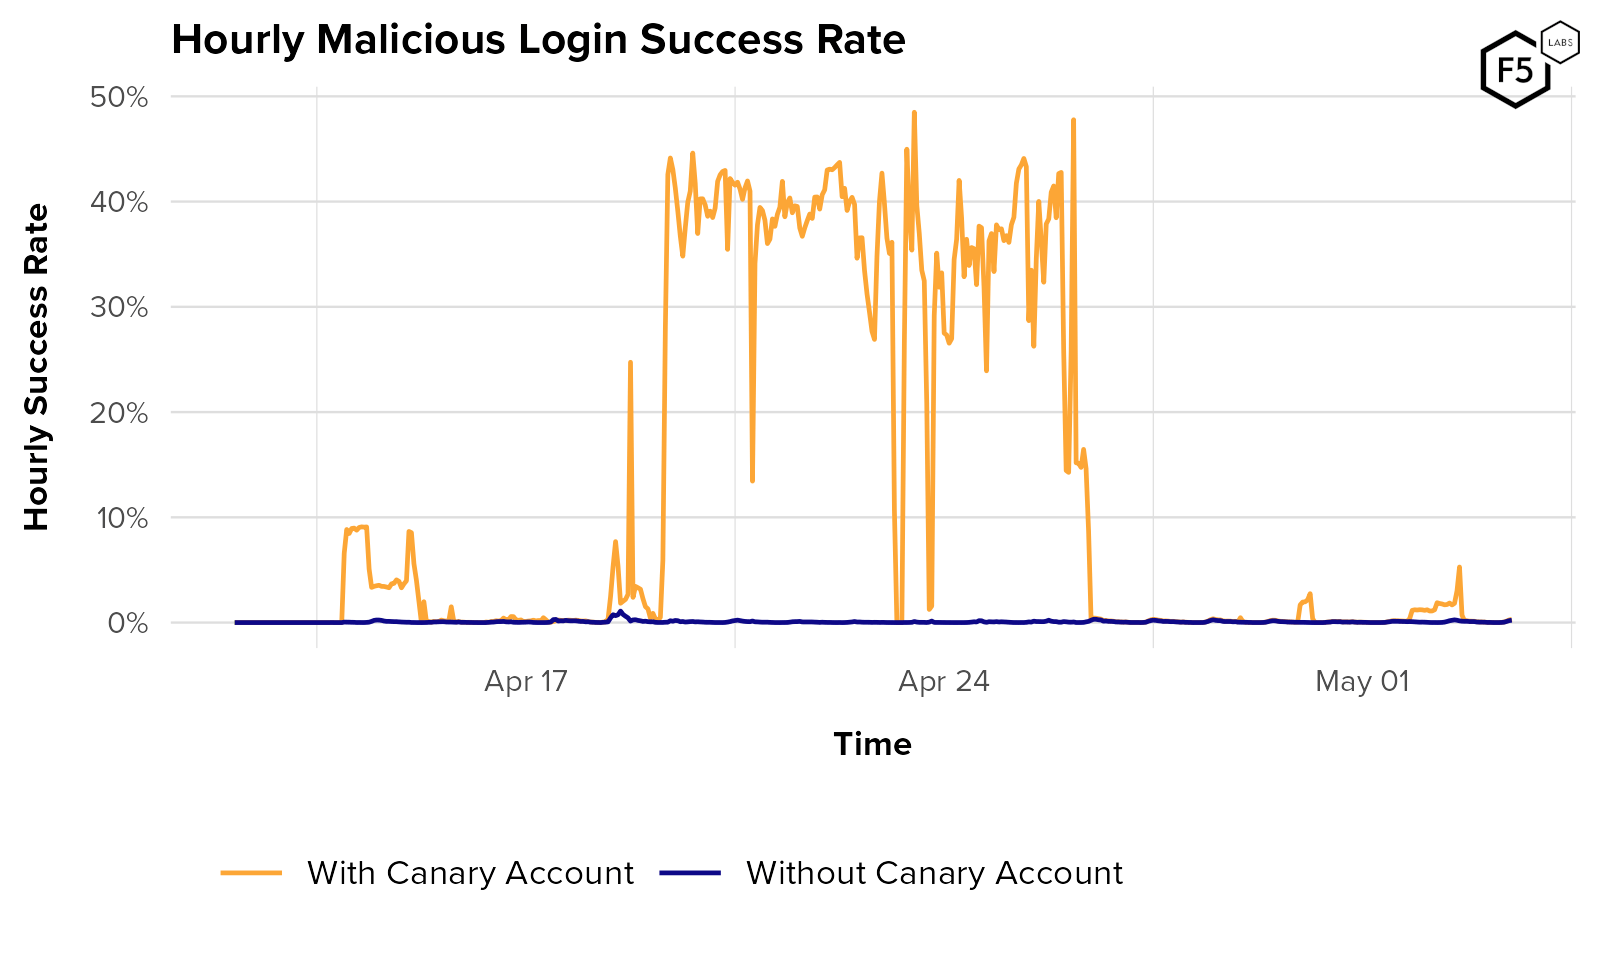
Figure 18. Hourly login success rate for the same customer in the plot above. The orange curve shows the success rate including the canary account. Blue shows the success rate calculated without that account’s traffic. Note how the overall success rate rises and falls with login traffic to the one canary account.
Aggregators also play a role in the complexity of measuring success rates. In fact, aggregators are potentially problematic from the standpoint of identity risk for several reasons:
- Aggregator traffic is by definition automated. Most anti-bot systems will flag their traffic as malicious, leading to a high false positive rate. For this reason, their IP addresses are often placed on an allow list.
- Users often have to submit their credentials for the end service (the identity provider) to the aggregator so that it can log in on their behalf. This means that the digital identity is now shared among three parties, and those credentials are stored outside of the control of either the end user or the IdP.
- Because aggregators intercede in the relationship between a provider and a consumer, they also reduce the provider’s control over their offering to the consumer. Often aggregator traffic is not cleared with providers before the aggregator begins operation. Their traffic is therefore not malicious, but not completely benign either.
- Attackers can compromise aggregators and hide malicious requests among all of the semi-legitimate aggregator traffic. For example, several dark web forum discussions in late 2022 and early 2023 focused on identifying banks that do not require multi-factor authentication to log in via a specific aggregator. This made the aggregator a reliable way to log into those bank accounts and transfer funds out, so compromised credentials for banks on that list became a primary target for attackers.
Figure 19 shows the composite success rate of aggregators against all customers in pre-mitigation mode. Overall, the average success rate for this traffic is 75%. This illustrates how traffic from aggregators can pose a challenge to organizations when automation is such a pillar for credential stuffing. Aggregators aren’t the enemy, but they aren’t exactly friends either, and their behavior has characteristics of both.
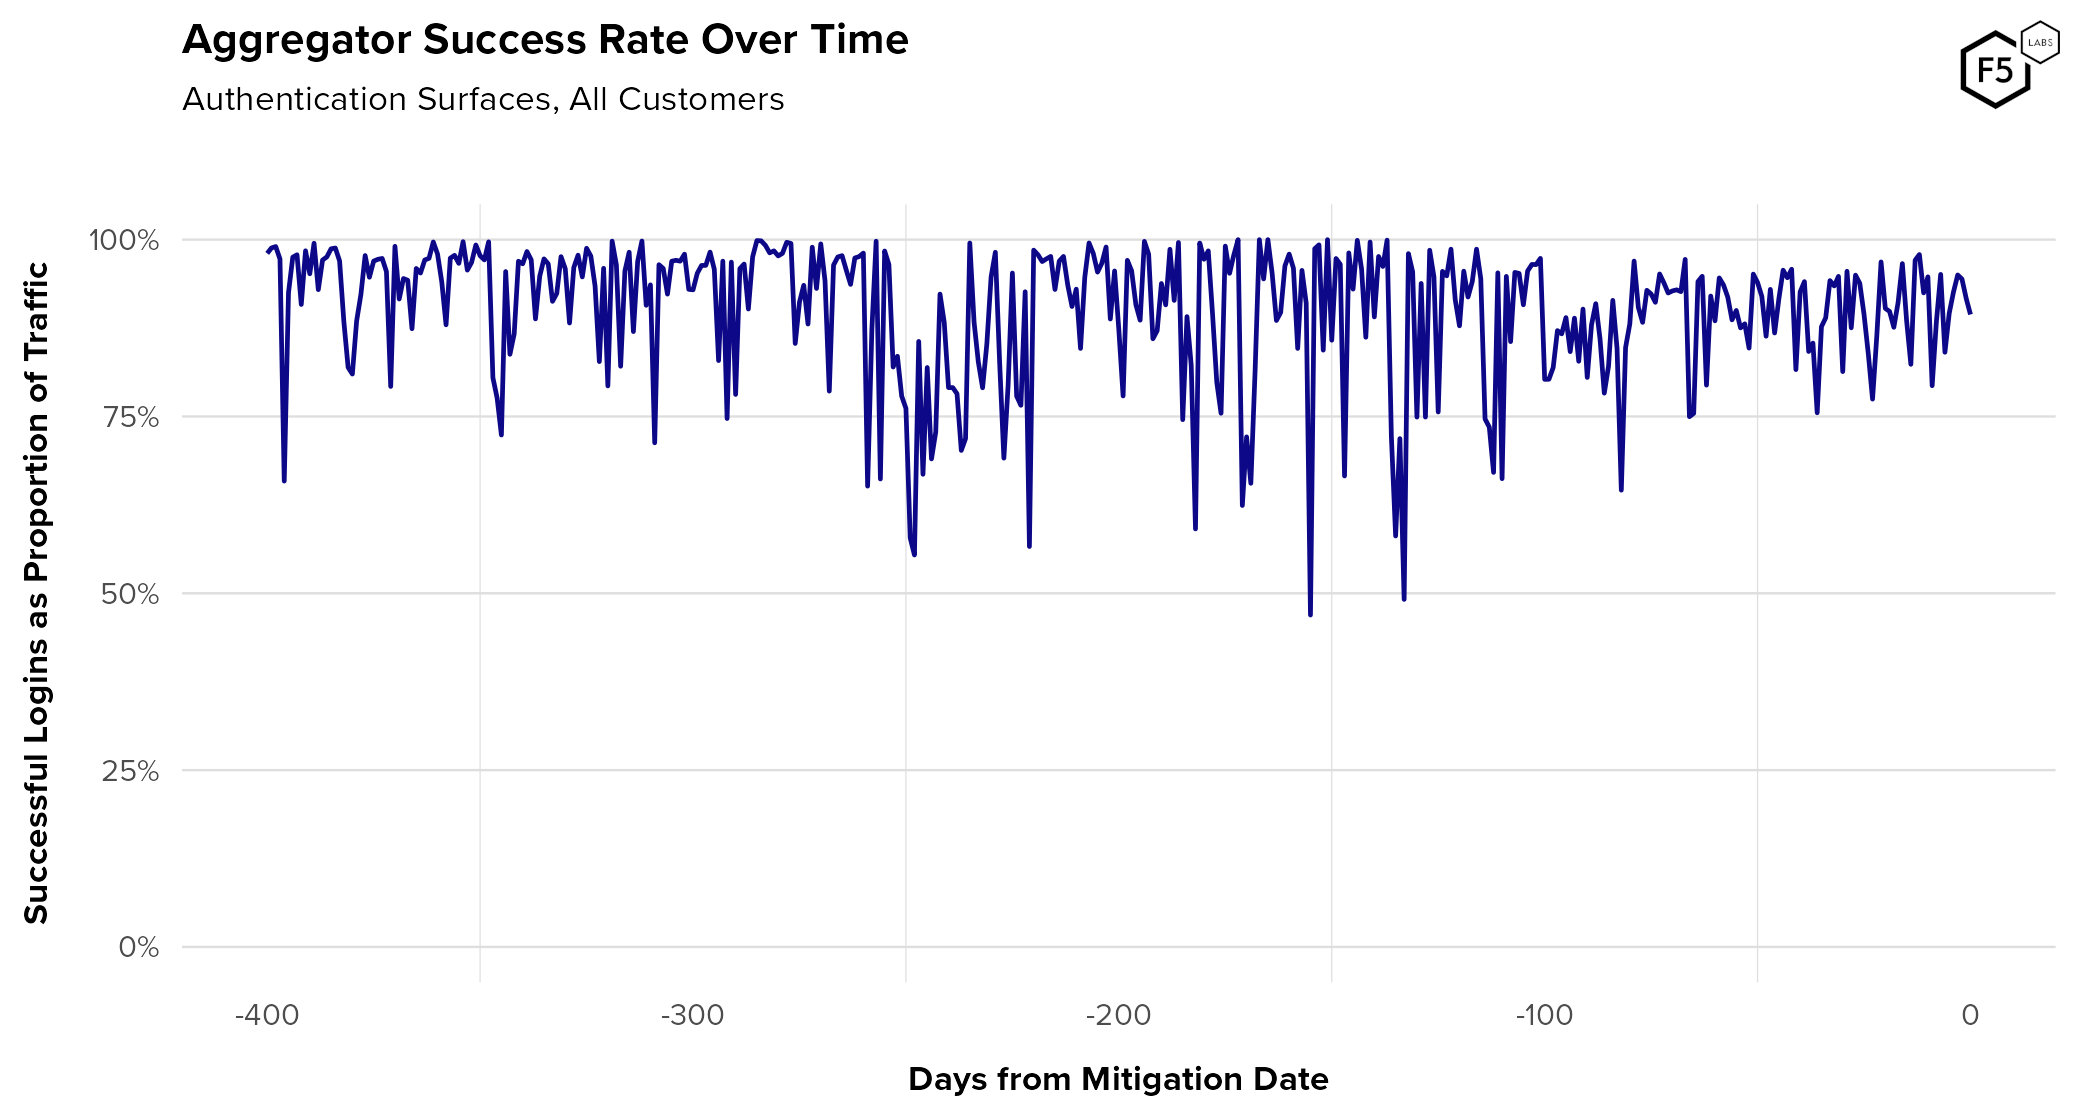
Figure 19. Authentication success rate for known aggregators over time. Because aggregators are automated but have access to legitimate user credentials, they can skew both success rates and automation rates.
Case Studies
So far we have focused primarily on cross-customer analyses to look for big trends, but when it comes to understanding specific attacker TTPs, individual case studies are more useful. Here we will delve into the specific differences in the approaches attackers take, starting with a good old basic credential stuffing attack.
Basic Credential Stuffing
As we’ve established, credential stuffing is all about scale, which also means that detection is partly about identifying anomalously large clusters in data. Many of the more advanced approaches not only emulate human behavior but rotate through many distinct emulation patterns or fingerprints to avoid detection. In contrast, the simplest attacks not only fail to emulate browser or human behavior, but also use the exact same infrastructure for every request. This is very easy to detect.
One of the more basic attacks observed in 2023 made 184,000 login attempts against 169,000 distinct accounts, from the exact same IP address and ASN, with the same user agent string and the exact same combination of HTTP headers. Figure 20 shows the volume of hourly traffic against the customer’s authentication surfaces, with traffic originating from this one IP address marked in orange. It should be pretty easy to spot.
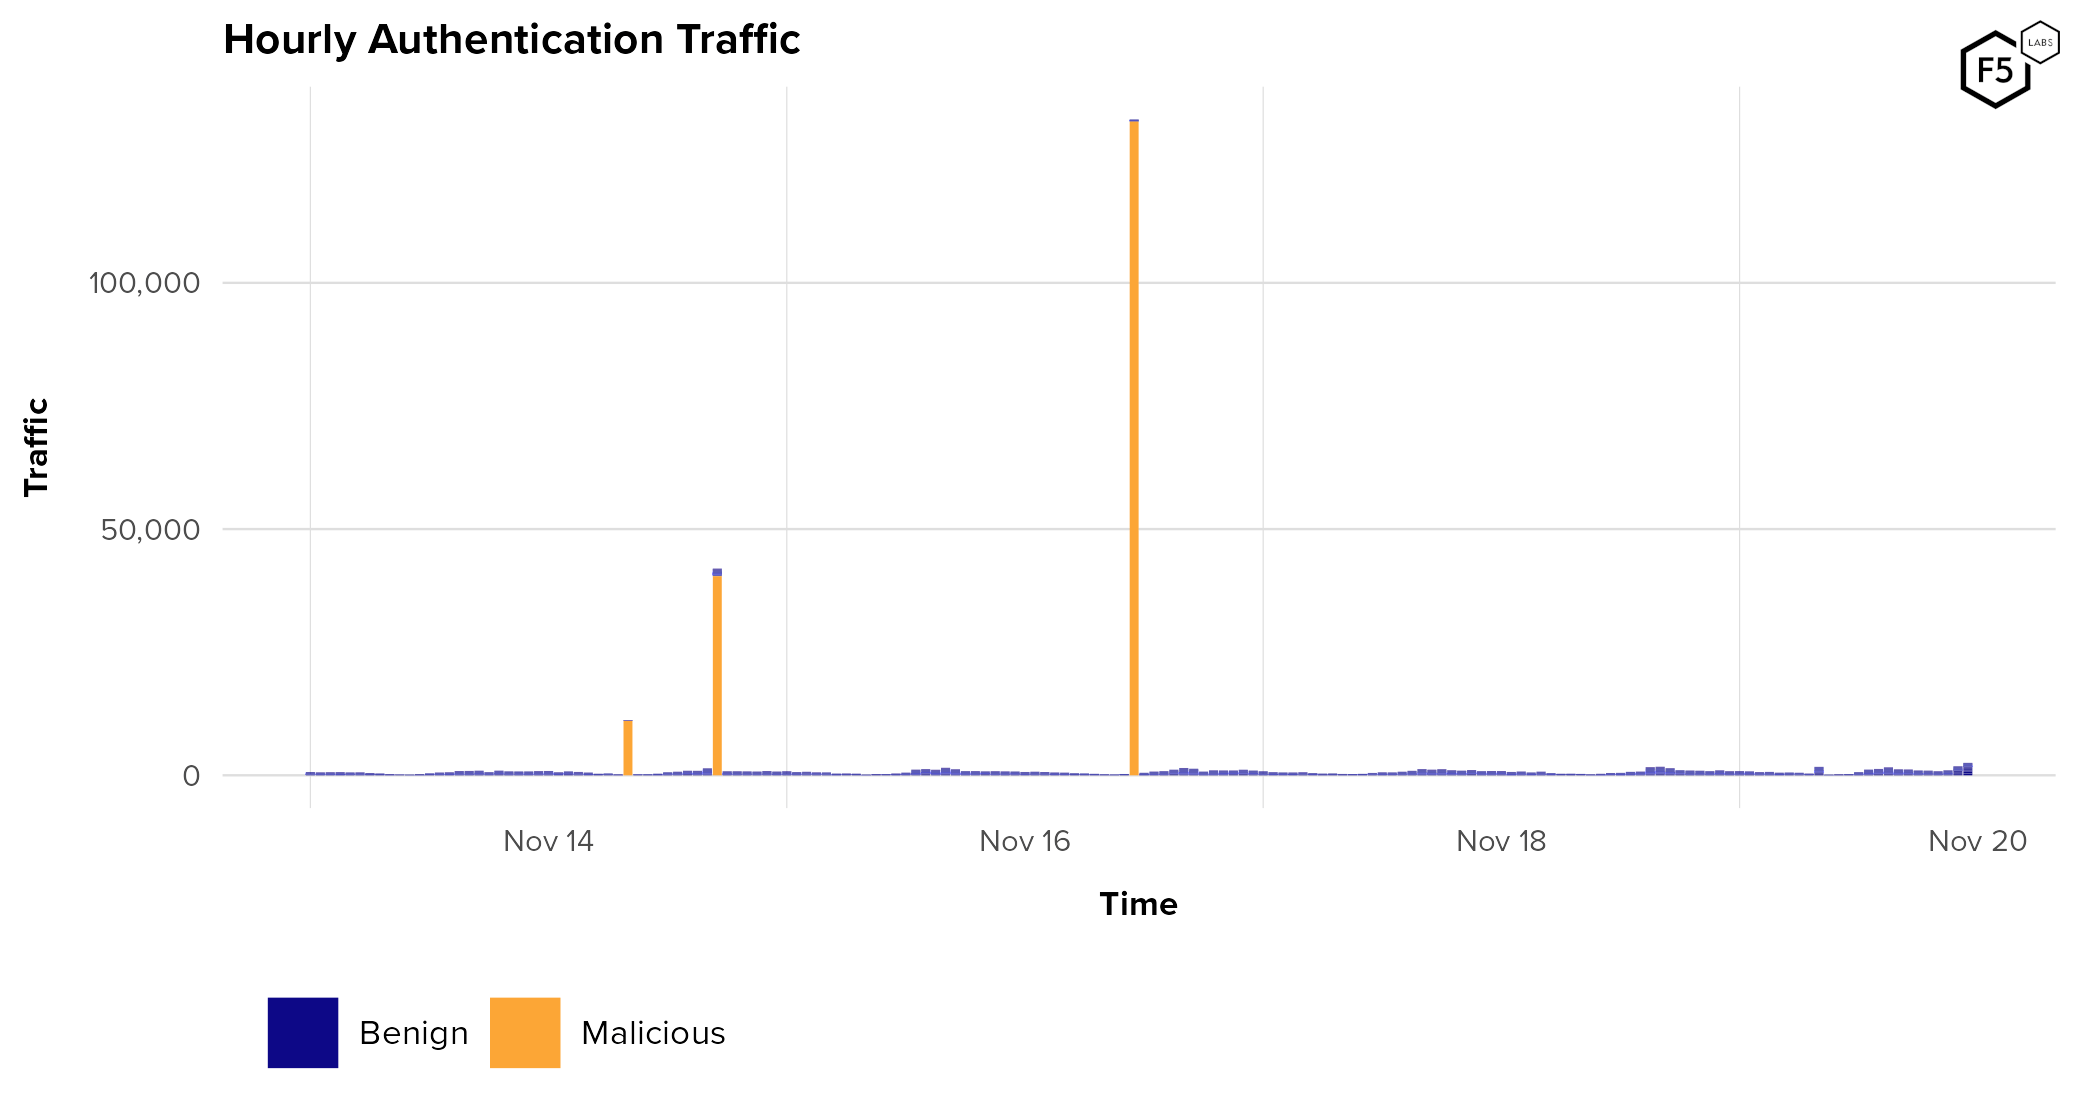
Figure 20. Hourly login traffic during a particularly unsophisticated attack. The orange bars represent simple credential stuffing traffic coming from a single IP address.
This campaign was flagged because these requests failed to pass even the most basic of challenges, but even without an anti-bot tool, this could have been detected in logs. Figure 21 is a scatter plot of traffic volume against the number of unique identities submitted for authentication. The IP address in question is also flagged in red here, which makes it easy to spot what an outlier it is in terms of both traffic volume and the number of identities it’s trying to access.
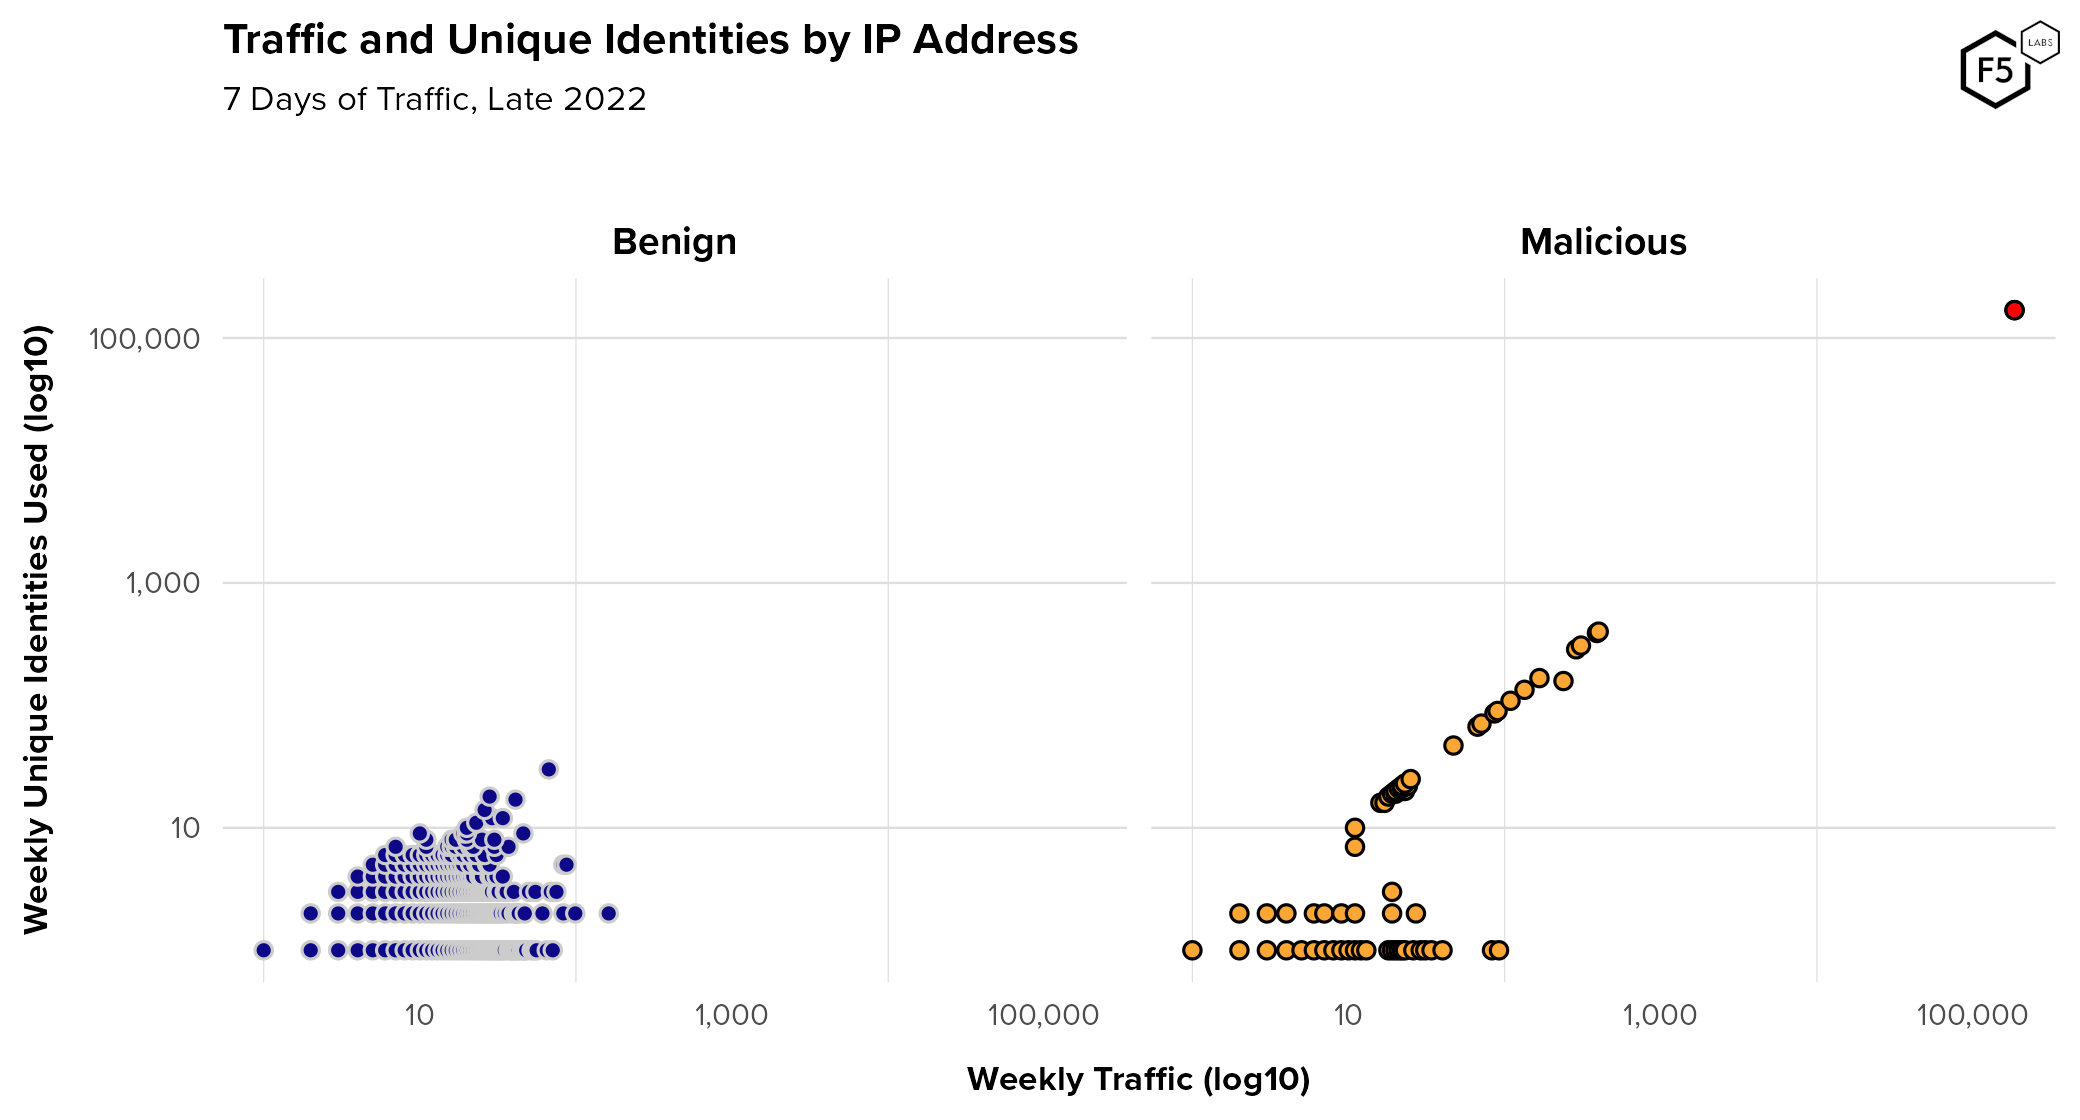
Figure 21. Plot of traffic against the number of unique user accounts submitted to customer's authentication surfaces (log10 on both axes). Each dot represents all IP addresses that generated each unique combination of accounts and requests. The single IP address responsible for the attack is marked in red on the upper right of the Malicious plot.
Also note several dozen IP addresses flagged as malicious automation and with a 1:1 ratio of visits to unique identities despite submitting hundreds of identities. These were either low-level credential stuffing attacks using different infrastructure and tactics, or unidentified aggregators whose IPs are not yet known. The plot of benign traffic also shows several IP addresses with many unique identities. These could be coming from infrastructure that consolidates traffic through a single IP for various reasons: this could be mobile traffic coming through a mobile browser instead of an app (in which case it will land on a web endpoint and not a mobile one), or traffic from a network using Network Address Translation (NAT), for instance. This also illustrates why merely using network-level signals like this can catch unsophisticated attackers, but why other signals are necessary to catch more skilled threats.
Some months later the same customer experienced a similar low-sophistication attack with no browser emulation but slightly better infrastructure rotation: 233,000 login attempts against 231,000 unique accounts, but this time spread across 1,400 IPs, 659 ASNs, and 5 unique combinations of HTTP headers. This is an example of attacker retooling, when attackers try different, usually more sophisticated approaches in response to being mitigated.
Intermediate Credential Stuffing
As we noted earlier in our analysis of sophistication distributions, many of the intermediate-level attacks are caught as a result of attempts to defeat or circumvent anti-bot systems, rather than by the fidelity of their emulation. For instance, one approach that is slightly more advanced than the basic HTTP traffic above involves using a legitimate browser once to successfully pass anti-bot challenges and receive a token, but then reusing that token over and over across a variety of infrastructure and accounts. One campaign against a bank in 2022 made 52,000,000 login attempts across 36,000,000 accounts using hundreds of thousands of IP addresses and more than a thousand unique user agent strings, but used the same browser properties and replayed the same token for each authentication transaction.
In addition to replaying tokens, there are many other ways attackers try to reverse engineer anti-bot controls in order to strip out flags or spoof values from legitimate transactions. All of these tactics are classified as intermediate sophistication.
Advanced Credential Stuffing
The most advanced techniques not only rotate through infrastructure, but also rotate through a library of simulated human behaviors and browser/device characteristics to avoid detection through repetition. An account validation campaign was observed in late 2022 using 513,000 unique emulated user interactions across 516,000 requests, meaning that less than 1% of the requests replayed an interaction. This campaign was ultimately caught by subtle inconsistencies in the browser and user emulation.
Another recent advanced attack was able to reverse engineer an anti-bot solution enough to determine the replay limits for tokens issued to legitimate transactions. This knowledge allowed them to conduct periodic legitimate transactions at a rate just sufficient to generate a fresh supply of tokens to reuse for malicious transactions. This attacker also rotated heavily through distinct user and browser emulations, but was eventually caught due to emulation inconsistencies.
A good example of rotating emulation characteristics to avoid detection is in Figure 22, which shows the most frequently observed browser characteristics from a recent sophisticated attack. The columns represent different browser properties such as installed plugins, fonts, etc., and the values are hashes of a large number of signals per category. Matching colors represent matched browser characteristics. This attacker set up programmatic switching of browser properties in order to generate greater diversity in observed browsers. In all, 30 unique combinations were observed across roughly 10,000 IPs and 35,000 sets of credentials. Fingerprint switching and CAPTCHA solving capabilities are now available standard in some of the more sophisticated automation tools used by attackers.
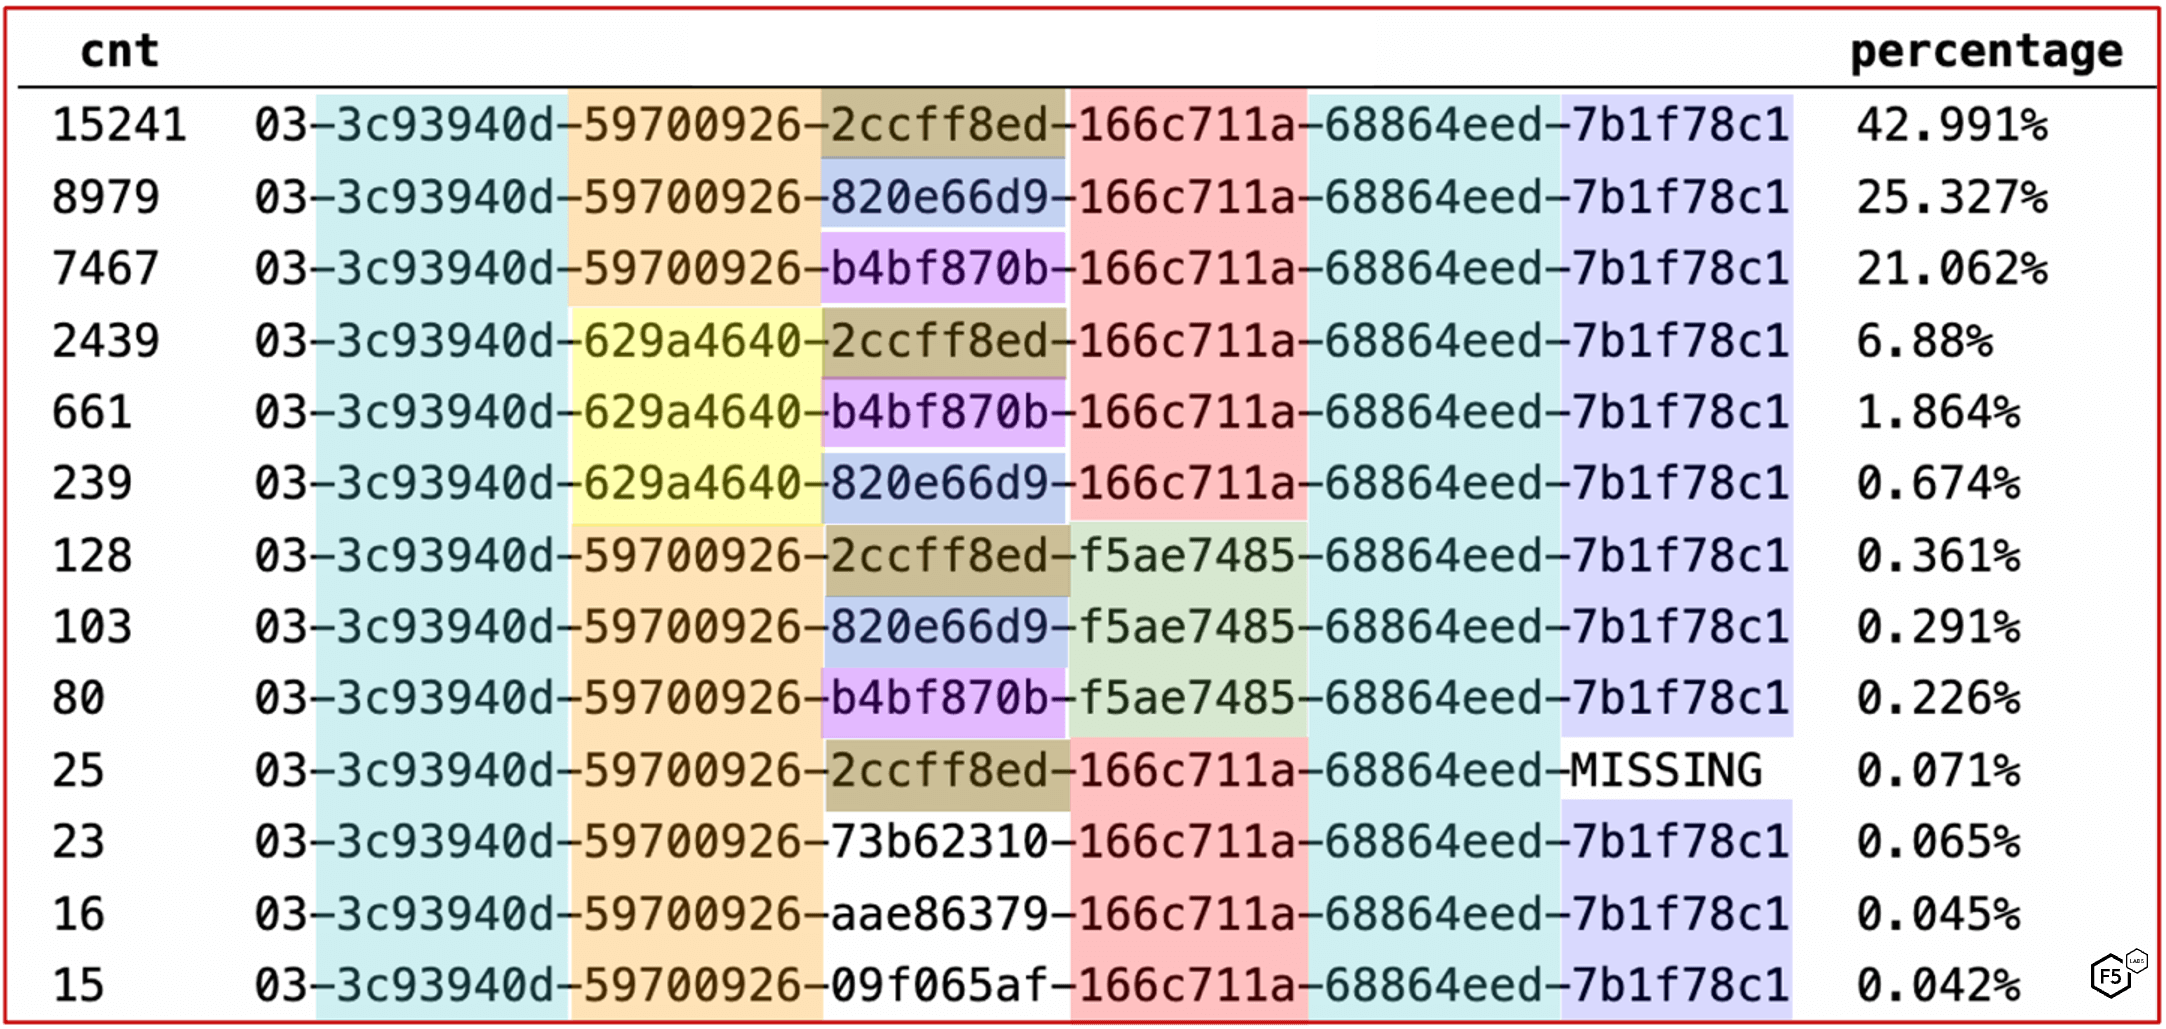
Figure 22. Browser subcomponent rotation in malicious automated traffic. Matching colors indicate identical browser properties. This attacker rotated through different subcomponents, such as plugins or font support browsers, to evade fingerprint-based defenses.
The Credential Supply Chain
All discussion about credentials has so far ignored the question of how attackers obtain compromised credentials in the first place. F5 Labs explored the lifecycle of stolen credentials in the 2021 Credential Stuffing Report, so we won’t reprise that information here. The overall arc of stealing passwords, cracking them if they are hashed, and using them is well known. However, the 2021 report also detailed how attack rates with known compromised credentials tended to spike shortly after the victim organization announced a data breach. Our hypothesis was that this is the point at which more skilled attackers realize that the game is up and publish or resell the stolen credentials widely, upon which lower-skilled attackers try to squeeze any remaining value out of them.
To assess the influx of new credentials into the economy of stolen credentials, we examined usernames submitted to Distributed Cloud Bot Defense customer sites between March 2022 and April 2023 and compared those to a list of known-compromised credentials that the F5 Leaked Credential Check service uses. The goal was to assess the degree of overlap per organization between recently submitted credentials and known compromised ones. The distributions of these overlaps for three sources of traffic—human, malicious bots, and aggregators—is visible in Figure 23. While the median overlap for all three populations was similar, around 7%, the third quartile (75th percentile) value for bots was slightly higher than the other two, at 35% overlap. Since the first quartile (25th percentile) is 0% for all three sources, this means that a quarter of organizations saw no known compromised credentials submitted in this time period.
Note outliers in aggregator traffic with 75-100% overlap—these are anomalies arising from customers with very low numbers of accounts submitted through aggregators. High overlap values in the other populations come from more typical numbers of accounts and appear representative.
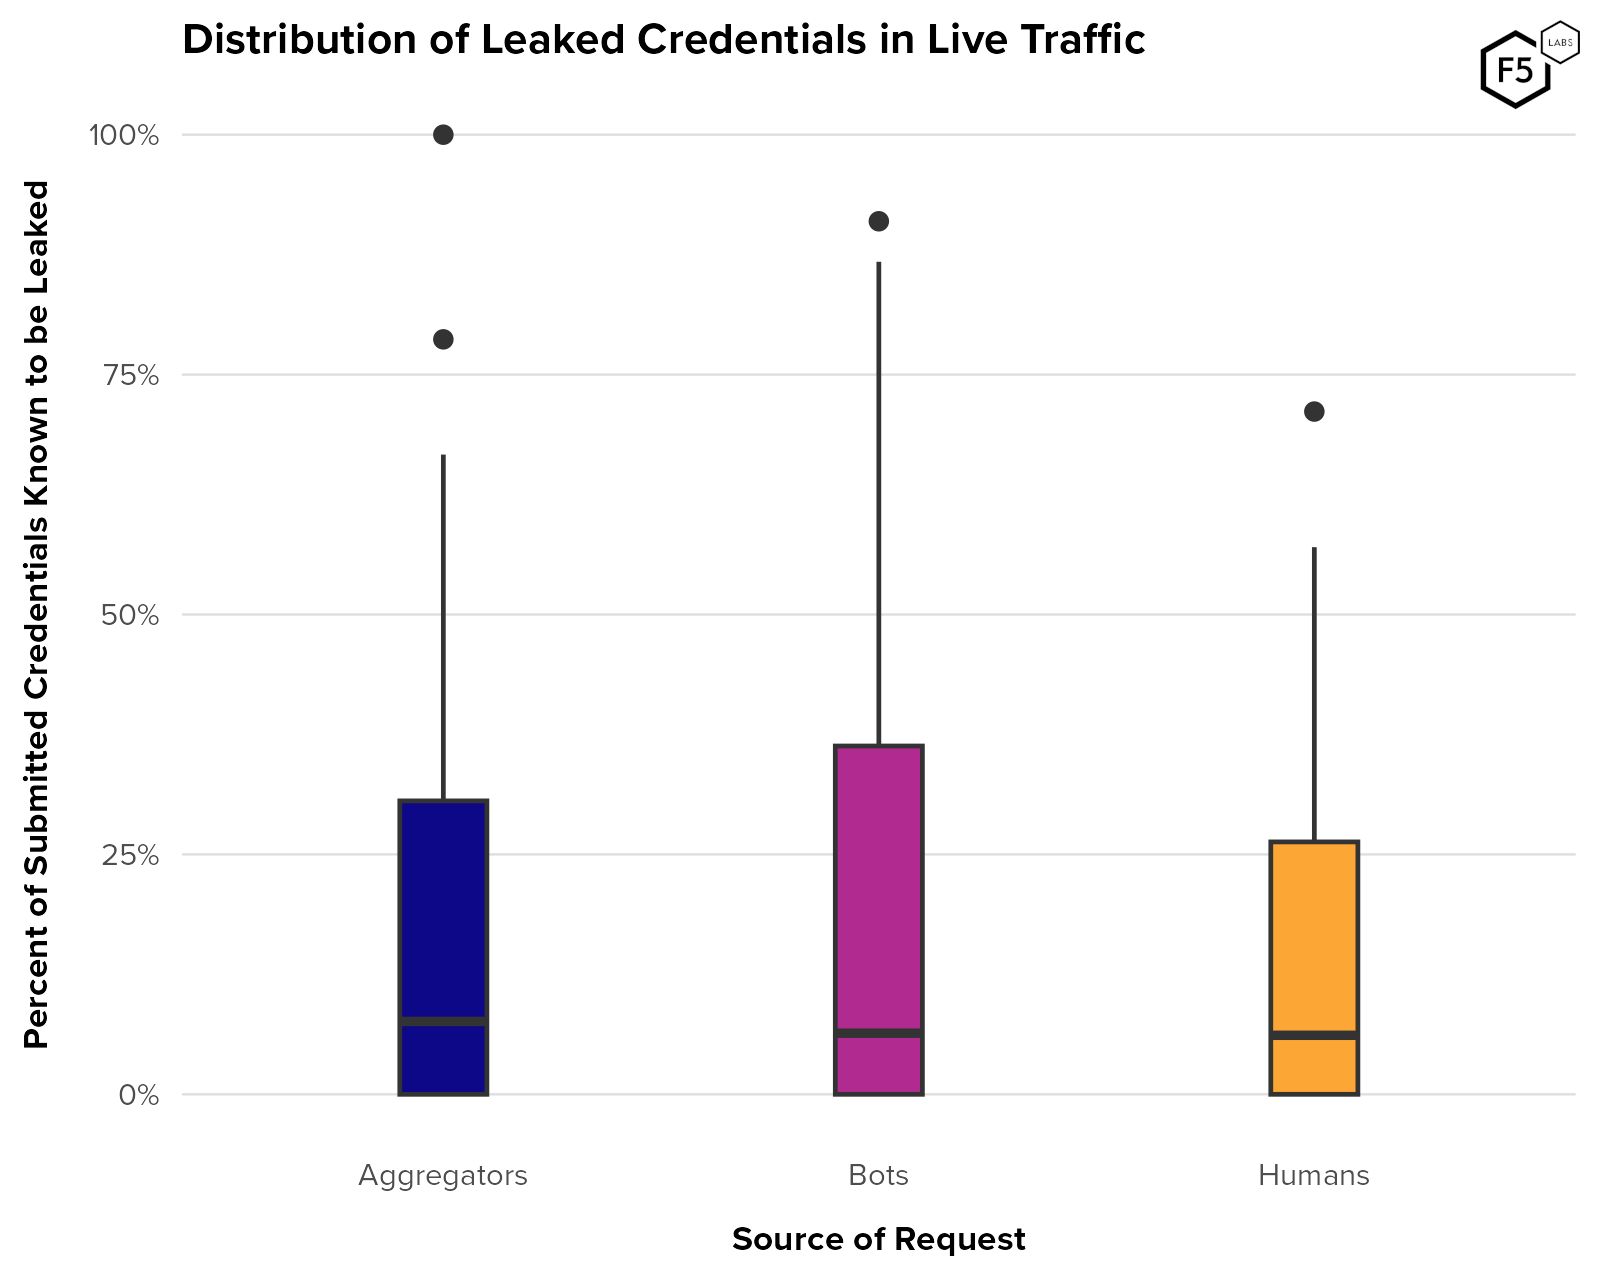
Figure 23. Distribution of the proportion of submitted credentials that are known to be compromised for aggregator, bot, and human traffic. n = 127 organizations. All three populations had a median overlap around 6-8%.
Without knowing when credentials were identified as compromised, we don’t know whether any individual identity was still compromised at the time it was submitted. We also don’t know whether the password associated with each username had been changed at any point. How, then, to interpret this finding?
Well, the implications differ depending on the source of the traffic. High overlap between known compromised credentials and credentials submitted by bots is a good sign for defenders. It implies that we have good visibility into the pipeline for compromised credentials and that attackers’ supply from unknown sources is limited. Over the entire group of customers, it looks like more than three quarters of the stolen credential supply chain is unaccounted for during this time period.
In contrast, the overlap between known compromised credentials and credentials submitted by humans is best interpreted as an indicator of the freshness of the supply chain. Because stolen credentials lose value when a breach is announced, a high incidence of compromised credentials among recent legitimate traffic probably indicates that the stolen credentials are comparatively fresh and more likely to be valid, which is a bad sign for defenders.
In short, in this analysis we want high values for bots and low values for humans. Aggregator traffic is more difficult to assess. Since aggregators are used by both legitimate and malicious actors, this view doesn’t tell us who submitted leaked credentials via aggregators. The fact that the median value is on par with the other two, and the third quartile sits in between the other two, indicates what we already knew, which is that both bots and humans submit credentials to sites via aggregators, and both of those populations are submitting a mix of compromised and uncompromised credentials.
To get a sense of variation by industry, Figure 24 shows these distributions broken out by industries (a few industries with very low numbers of submitted accounts were removed to minimize skew). Here there is significantly more variation. Identity providers in finance, telecommunications, and government tended to see a median overlap close to zero for all populations, meaning that on the one hand, malicious attempts used credentials that were not previously known to be stolen, but on the other hand, so did the humans.
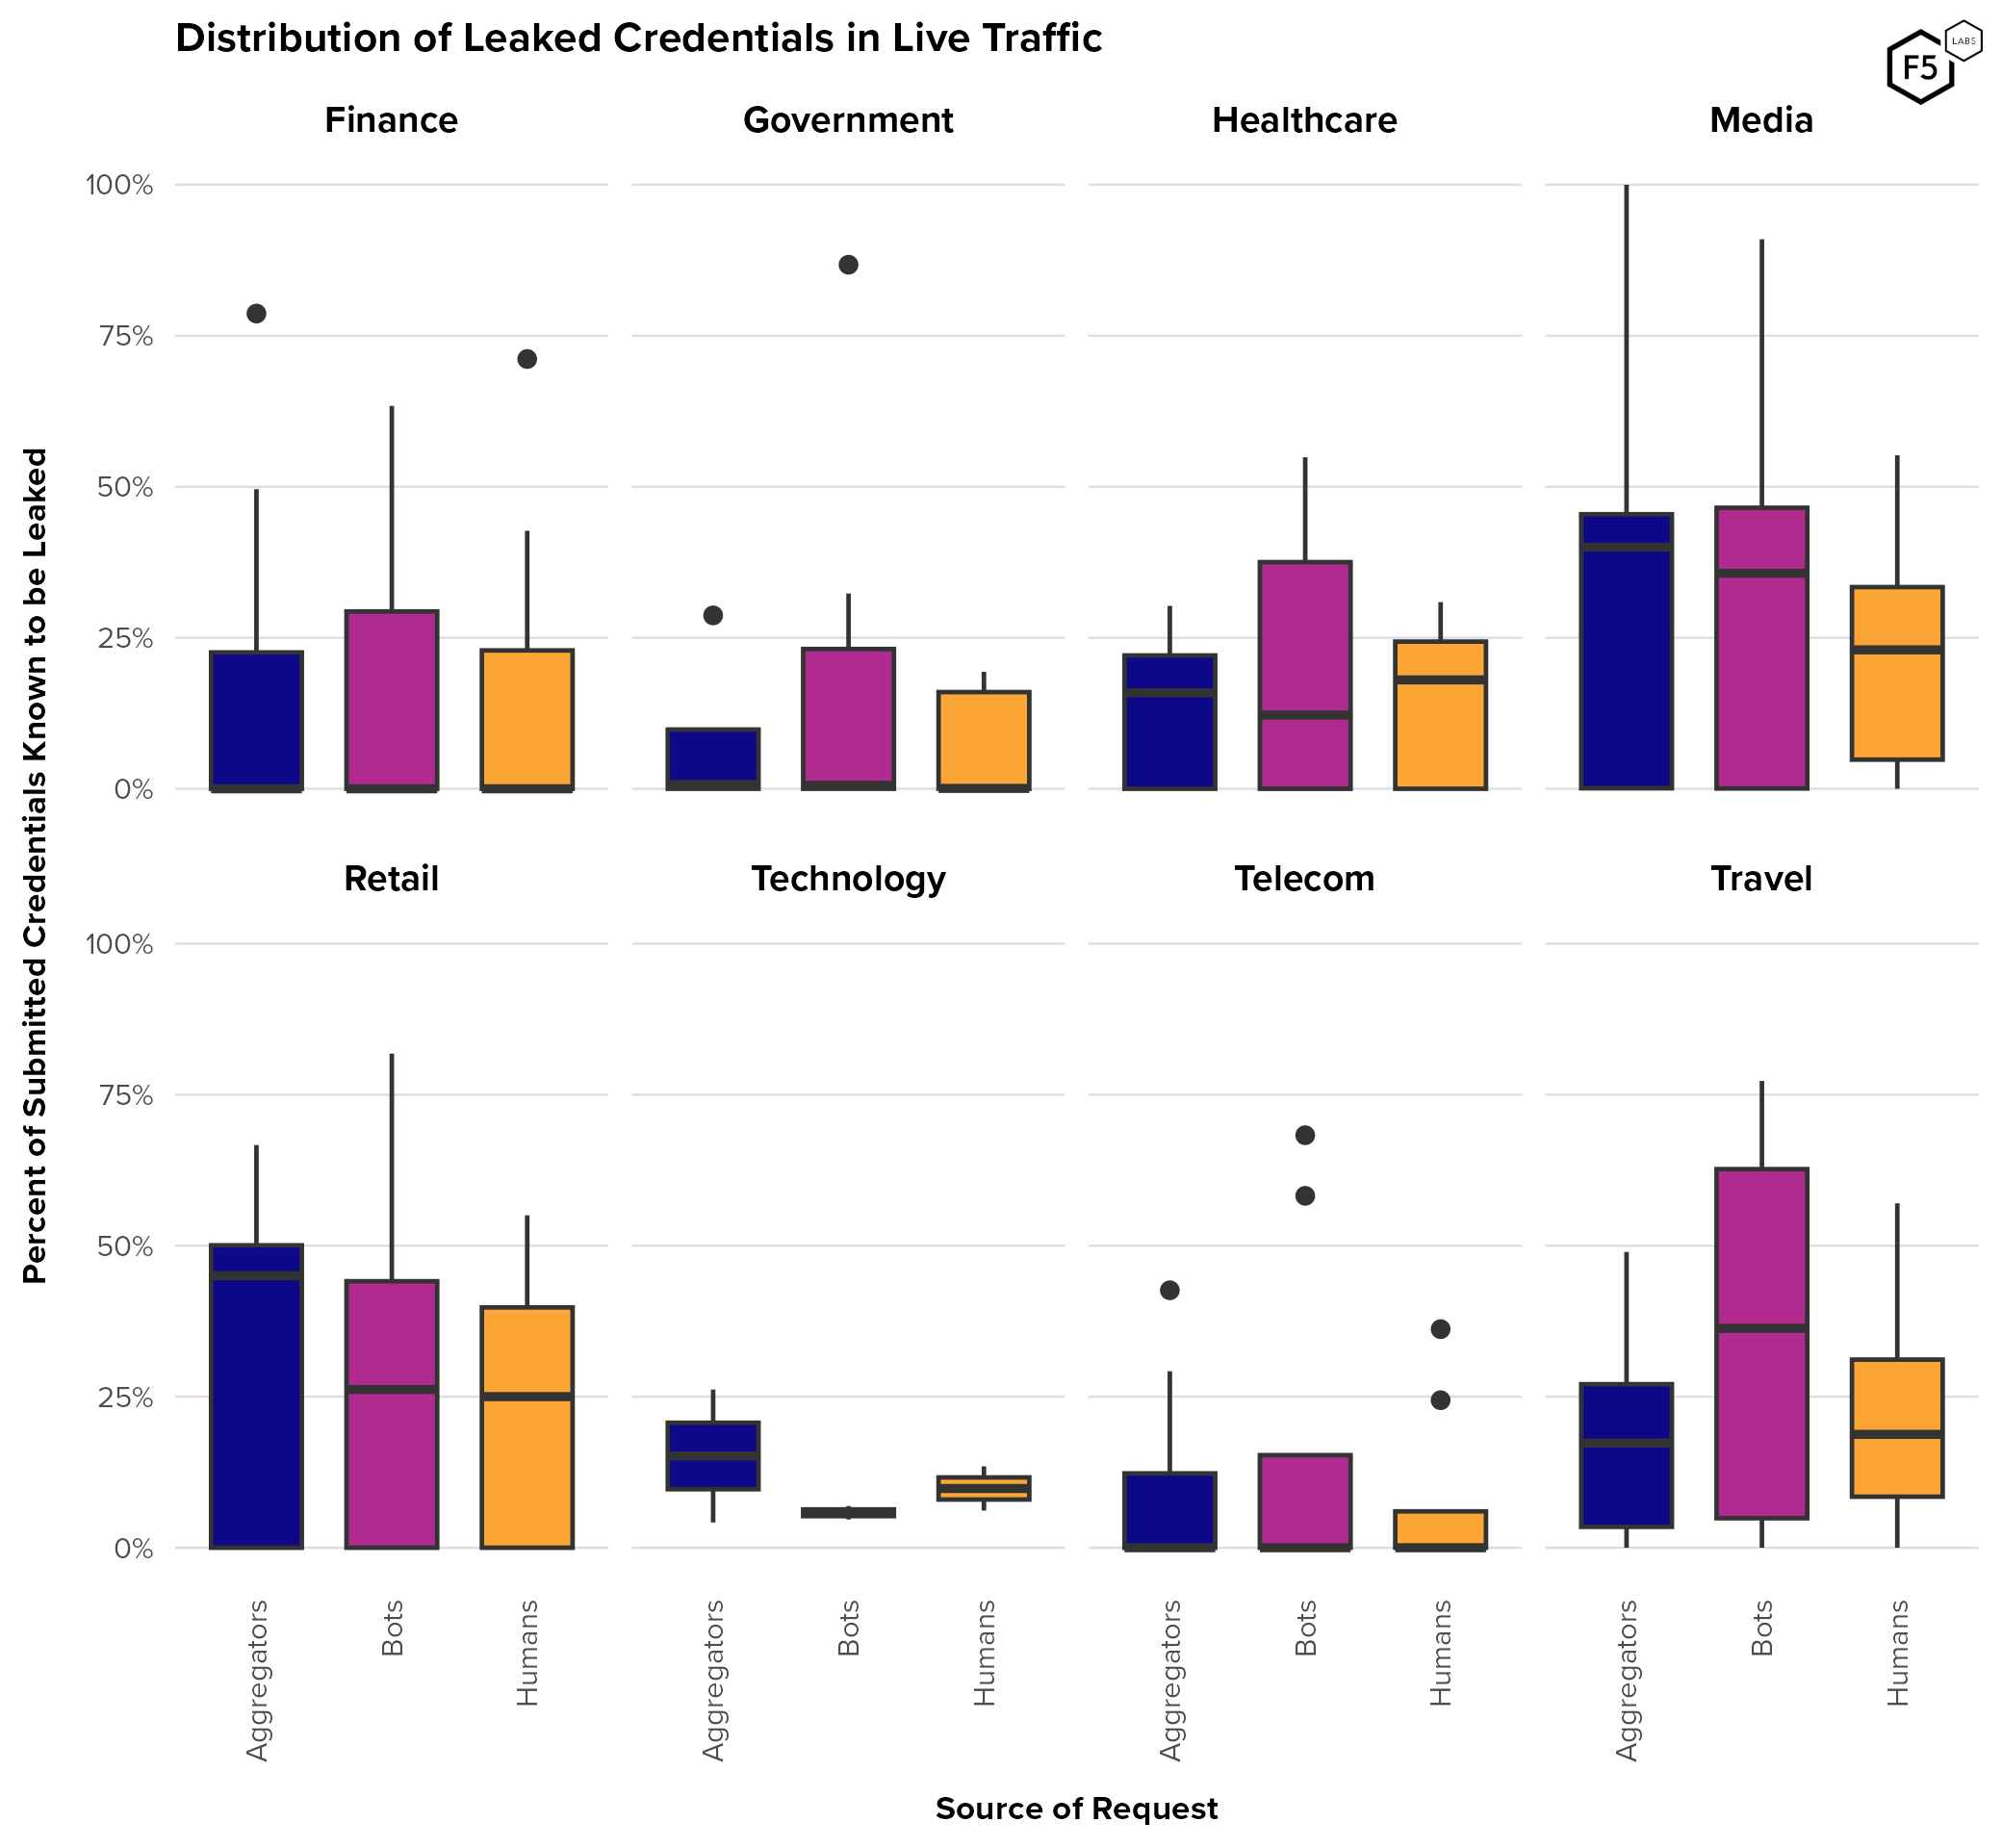
Figure 24. Distribution of known leaked credentials in traffic by source and industry. In most industries leaked credentials showed up more often in bot traffic than they did in human traffic.
In contrast, identity providers in media, retail, and travel tended to see higher overlap, particularly among bot traffic in the travel industry. (High overlaps for aggregators in media and retail are skewed by a comparatively miniscule number of accounts submitted.) The technology industry showed narrow distributions for all three categories, which partly reflects the fact that only two technology customers qualified for this analysis (though they both saw large numbers of accounts).
This disjunction between government, telecoms, and finance on the one hand and travel, retail, and media on the other probably reflects the comparative value of these accounts. The implications of compromising an identity at a financial provider is obvious, and government identities are often a steppingstone to identity theft or other forms of fraud. Compromising telecommunications accounts can also lead to SIM swaps (more on this below), information gathering for other identity attacks, or claiming earned device upgrades.
To summarize this analysis: higher incidence of compromised credentials in bot traffic than in human traffic is a good sign, indicating that we have some visibility into the stolen credential supply chain and that human users are able to move away from compromised credentials. At the same time, the fact that none of these industries had a median overlap with bot traffic over 50% means that a significant proportion of the stolen credential supply chain is not visible to us. Many organizations monitor the dark web for the dissemination of compromised credentials (either directly or via a vendor), and while this is inefficient, it is still better than no visibility at all. The data above indicates that either greater effort or a new approach is warranted in detecting stolen credentials before they are weaponized and used.
Special Mention: Admin Credentials, Escalation of Privilege, and Lateral Movement
So far all of our discussion about using stolen credentials to gain access has been focused on end user or customer credentials. However, it is widely held in the security community that administrator credentials represent the ultimate goal for many attackers, since they are the “keys to the kingdom” and a route to quickly achieving persistence in a victim environment. This is a far cry from the sort of front-end access that most end user credentials offer.
We do not have any recent quantitative data about administrator credentials, so we asked a lead Detection Engineer from the Distributed Cloud App Infrastructure Protection (AIP) Security Operations Center (SOC) at F5. AIP analysts specialize in observing host-level attacker behavior and so are in a position to observe attacker techniques for tactics such as lateral movement and privilege escalation.
The Distributed Cloud AIP SOC has generally observed less emphasis on privilege escalation and root permissions and specifically less emphasis on administrator credentials over the last few years. In fact, while penetration testers and red teamers continue to emphasize compromising as much of the environment as possible, attackers (at least those of a cybercrime bent) have instead pivoted to focus more on service accounts and cloud APIs as a way to quickly identify and exfiltrate assets. A recent penetration tester writeup of using programmatic cloud credentials to gain console access is a good example.7
If we had to guess, attackers’ shift toward using service accounts instead of administrator credentials reflects the proliferation of APIs as a way to move data within and between environments. It also reflects the difference in process for provisioning these two different kinds of accounts. Administrator access is tightly controlled through policy and technical controls, whereas creating service accounts is a comparatively routine process that many individuals can perform.
This attacker shift from administrator identities to service accounts is something we hope to study in greater depth soon. In the meantime, suffice it to say that administrator credentials are still enormously sensitive, so they are still important to protect—it’s just that now we also have service accounts to manage. As a form of digital identity, they require many of the same access control principles as any other identity, just implemented in a way that suits their risk profile.
[back to top]
Credential Stuffing Summary
To summarize our analysis of credential stuffing in 2022 and 2023, malicious automated traffic hitting authentication endpoints is ubiquitous. On average across a wide range of organizations and industries, just under 20% of authentication traffic represents credential stuffing attacks, while Travel, Technology, and Telecommunications firms averaged 45-65% automation in the period we analyzed.
While attacker sophistication varies widely by target, overall roughly two-thirds of unmitigated credential stuffing is unsophisticated, being composed of basic HTTP requests with no user emulation or attempt to defeat anti-bot tools. Authentication surfaces saw advanced techniques in about 20% of attacks, with the remaining 10-15% (depending on the type of endpoint) being composed of intermediate level attacks, identifiable by attempts to spoof or bypass anti-bot solutions.
We also observed quantitative and qualitative shifts in attacker behavior post-mitigation. Automation rates generally plunged and attacker sophistication increased on average, indicating that many unsophisticated actors simply moved on once their simple attempts failed. Some specific account management endpoints actually saw automation rates increase post-mitigation, which is probably indicative of a few specific fraud strategies such as the use of canary accounts or fake accounts.
Finally, even though defenders often use low authentication success rates to detect attack campaigns, success rates are not always reliable, since aggregators and canary accounts can distort them. A simultaneous trend of declining attacker traffic and increased short-term velocity post-mitigation indicates that attack campaigns become spikier and more sudden once an anti-bot solution is put into place.
[back to top]
Phishing
Phishing is perhaps rivaled only by denial of service (DoS) attacks in being fundamentally different from other kinds of attacks. It is an attack on digital identity, to be sure, but since it usually relies on a social engineering foothold, it is even more difficult to detect or prevent than credential stuffing. (Since this is an identity report, we are going to focus on phishing attacks that harvest credentials, and skip over phishing attacks that drop malware or run exploits from malicious domains.)
Unfortunately, we don’t have much quantitative data about phishing, partly because detecting it has always been difficult and probably has become more so with the rise of open-source large language models.8 We will do what we can to establish its relative prevalence, but mostly focus on targeting trends and TTPs.
[back to top]
Prevalence
It goes without saying that detecting phishing is difficult, because most of the point of phishing is to be difficult to detect. However, the subtle (and increasingly imperceptible) differences between malicious emails and benign ones not only lead to false negatives, in which phishing emails go undetected, but also result in a high rate of false positives. We recently spoke to a security operations employee responsible for managing a commercial, off-the-shelf email phishing filter who said that their tool has a 95% false positive rate for phishing mails. This means that phishing costs everybody whether they fall for one or not. It also makes it very hard to determine just how many phishing emails are out there at any given time. Incident counts, breach counts, etc., are useful, but probably not exhaustive.
We can, however, gather a few observations that give us an impression that phishing is both extraordinarily common and poses an extraordinary risk to organizations. In our 2020 Phishing and Fraud report, we noted a 15% annual increase in phishing during the pandemic, and a short-lived spike of 220% above average during times of intensive phishing campaigns. In late 2021 we further noted phishing’s continued growth. Many other organizations have covered its popularity as a ransomware vector as well, particularly during the pandemic.9 Outside of ransomware, phishing has been categorized by the Verizon 2023 Data Breach Investigation Report as one of the top three breach vectors, along with the use of stolen credentials and ransomware.10
Furthermore, when F5’s Global Cyber Threat Intelligence and Investigation team briefs the executives and board of directors on threats, phishing is the primary vector-level threat that they routinely report on (the other top threats are geopolitical in nature). In other words, as far as F5’s own security is concerned, other vectors wax and wane, but phishing is the perennial threat that demands active management.
The above observations should go some way towards establishing that phishing appears to be ubiquitous, versatile, and devastating in impact.
[back to top]
Targeted Organizations
Phishing attacks have two targets: there is the end user who is in possession of a digital identity, and there is the IdP, which the attacker will access once they’ve gotten credentials. Depending on the motives of the attacker and the nature of the system and the data it stores, the impact of a successful phishing trip can land primarily on the user (as in the case of bank fraud), solely on the organization (as in the case of compromised employee credentials), or somewhere in the middle.
Figure 25 shows the top targeted organizations in phishing attacks collected by the Anti-Phishing Working Group (APWG) from January 2022 to August 1, 2023. Financial organizations predominate, with 4 out of the top 10 and 10 out of the top 20. Several of the rest of the top targets here are well known IdPs with a global footprint, such as Facebook, Apple, Microsoft, Instagram, and WhatsApp. Google is notably absent, and was ranked 50th, just behind the United States Post Office. This could be because Google is a notably difficult target to phish, and attackers are devoted to finding ways to circumvent Google anti-phishing countermeasures (more on this in the TTP section immediately below).
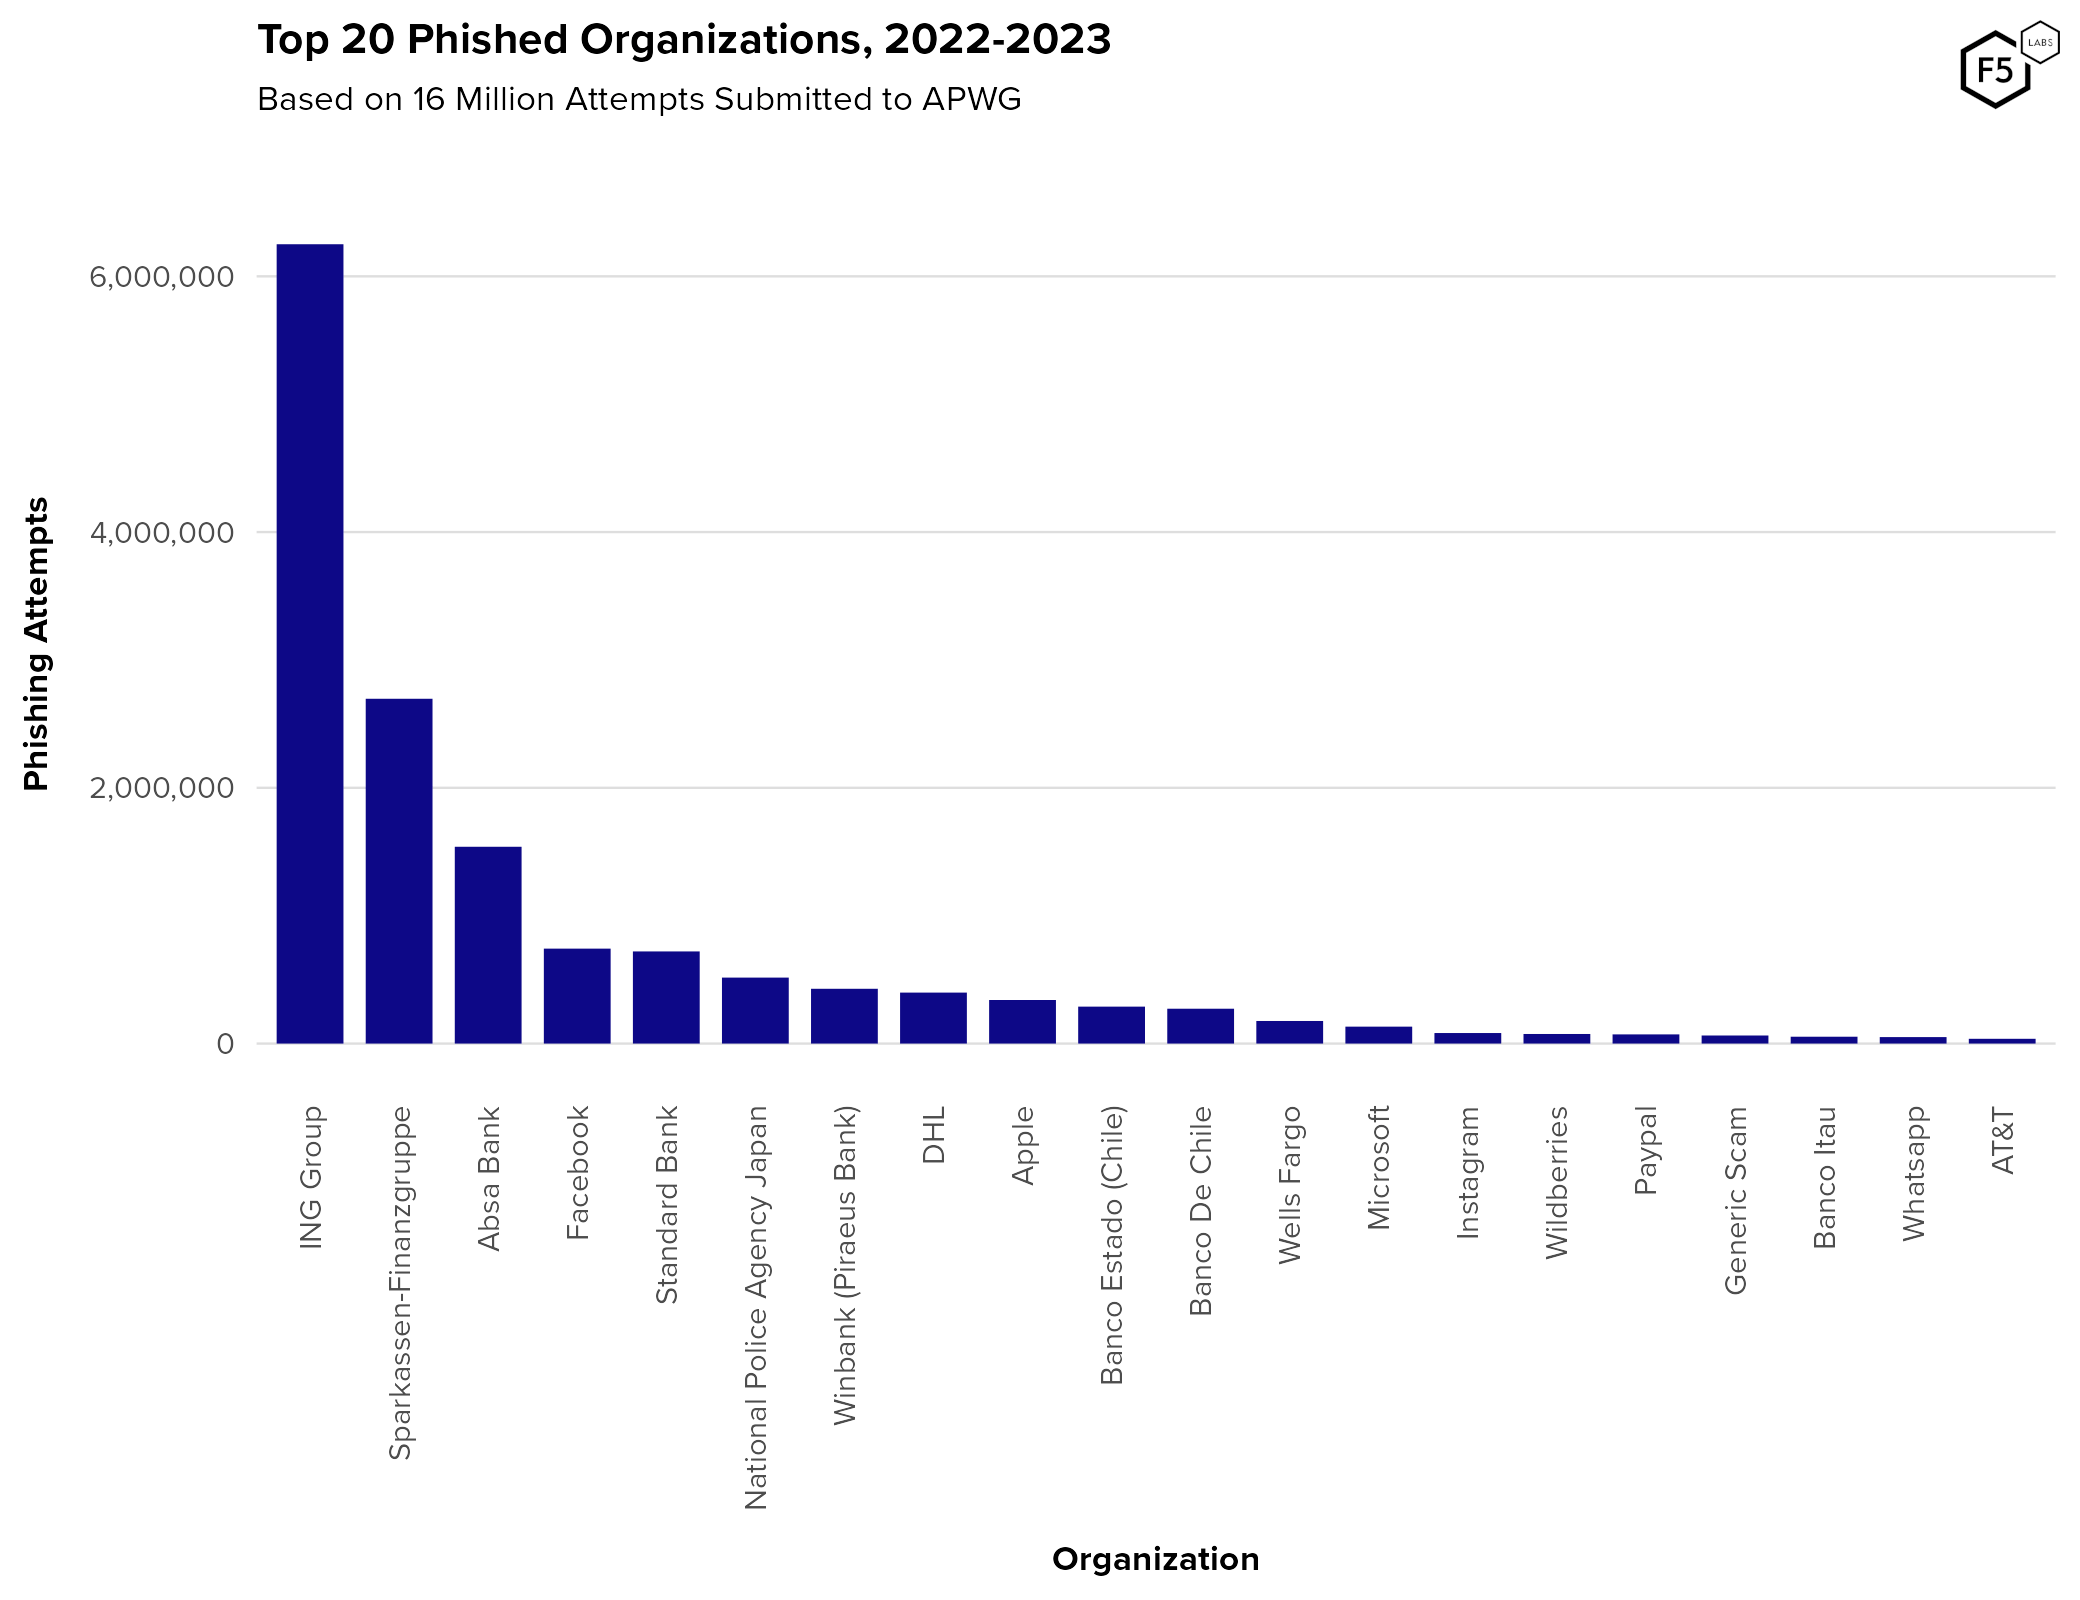
Figure 25. Top 20 phishing targets 2022-2023, per the Anti-Phishing Working Group. Financial organizations made up four of the top ten and ten of the top 20 (counting PayPal). Google is notably absent, although this could be due to selection bias.
We should be cognizant of selection bias in this analysis, however. APWG’s data is made up of data submitted by security professionals at member organizations, so the fact that ING Group made up the targets in 39% of these reports probably indicates that ING Group are a big target for phishing, but also that they are very diligent about submitting to the APWG. The comparative lack of U.S.-based banks (Dutch, German, South African, Greek, Chilean, and Italian banks are represented here) is also probably more to do with contribution rates than targeting trends.
We were also able to make a list of top phishing targets based on dark web discussions, in a rough descending order of observed frequency:
|
|
|
Here we see a little more emphasis on large IdPs, as well as some financial organizations and retail such as Steam and Amazon.
In summary, it is almost as difficult to tell which organizations are being phished as it is to quantify phishing. Probably the safest bet is to assume attractiveness as a phishing target is based on two things: quick access to money, or quick access to other credentials/accounts. Organizations that serve as IdPs for other resources (such as Microsoft, Apple, Facebook, and Google) offer attackers a much wider range of options (such as using email to reset passwords on other accounts like banks) than, say, compromising someone’s account at a single retailer.
[back to top]
Phishing Tactics, Techniques, and Procedures
On the attacker side, phishing can range from simple, hands-off solutions for unskilled actors to hand-built custom frameworks including infrastructure, hosting, and code. The most hands-off setup is the Phishing-as-a-service (PhaaS) approach in which the threat actor pays to gain access to a management panel containing the stolen credentials they want, and the rest is taken care of by the “vendor.”
Next in level of complexity are phishing kits, which run on established infrastructure under the vendor’s control, and have often already been used by other clients. The line between PhaaS and phishing kits can be fuzzy, depending on the level of interaction the threat actor has with the system.
Dark web research indicates that the most popular subtype of phishing service is best described as phishing infrastructure development, in which aspiring attackers buy phishing platforms, infrastructure, detection evasion tools, and viable target lists, but run them on their own. This approach requires more hands-on work by the phisher than the comparatively turnkey approaches listed above, but are generally cheaper and more adaptable to a specific purpose and target.
Brokering phishing traffic, or pharming, is the practice of developing infrastructure and lures for the purposes of driving phishing traffic, then selling that traffic to other threat actors who can capitalize on the ruse and collect credentials for other purposes. Figure 26 shows an ad for pharming services based on Bing Ads.

Figure 26. A threat actor advertising pharming services based on traffic from Bing Ads. This actor proposes a 50-50 split of profits with the eventual consumer of the stolen credentials.
Finally, the attacker community has a niche for those who exclusively rent out hosting services for phishing. Figure 27 shows a dark web ad by a well-known phishing expert, advertising hosting services that also offer detection evasion capabilities. This threat actor also advertises phishing tools at other levels of involvement, including a turnkey PhaaS and a front-end (or “live panel”) for a phishing kit. In short, this actor is providing all levels of phishing service to different customers. This illustrates how the distinctions we’ve just unfolded are useful, but blurry in the wild.
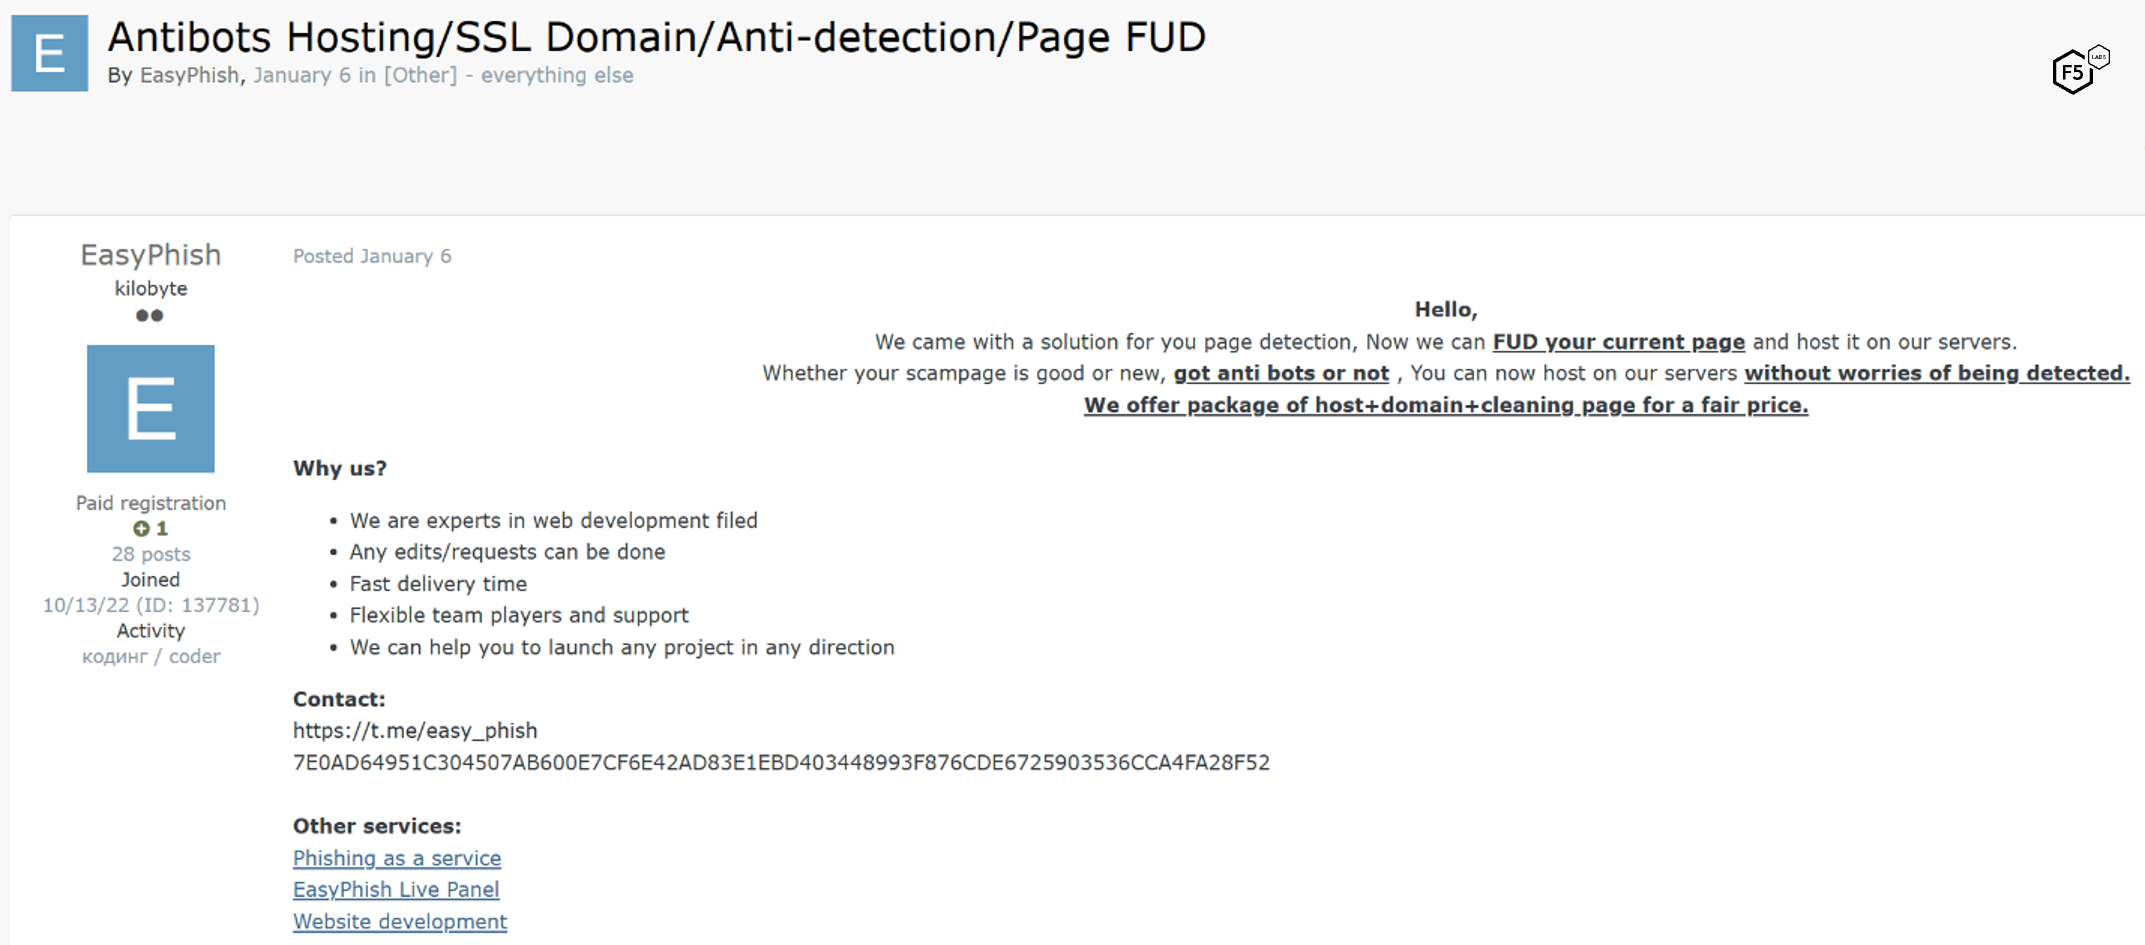
Figure 27. Well-known forum member EasyPhish advertising hosting services with additional detection evasion capabilities.
Reverse Proxy/MitM Phishing Kits
The most important tactical development in phishing is undoubtedly the rise of reverse proxy/man-in-the-middle phishing tools (sometimes known as real-time phishing proxies or RTPPs), of which the best known are Evilginx and Modlishka. While they are not new (Evilginx was first released in 2017 and Modlishka was introduced in early 2019), the reverse proxy approach to phishing is so effective that this approach has become the new standard for phishing technology. This is largely because it grants attackers the ability to capture most multi-factor authentication codes and replay them immediately to the target site (Figure 28), facilitating MFA bypass but also making it less likely that the user victim will detect anything is amiss.
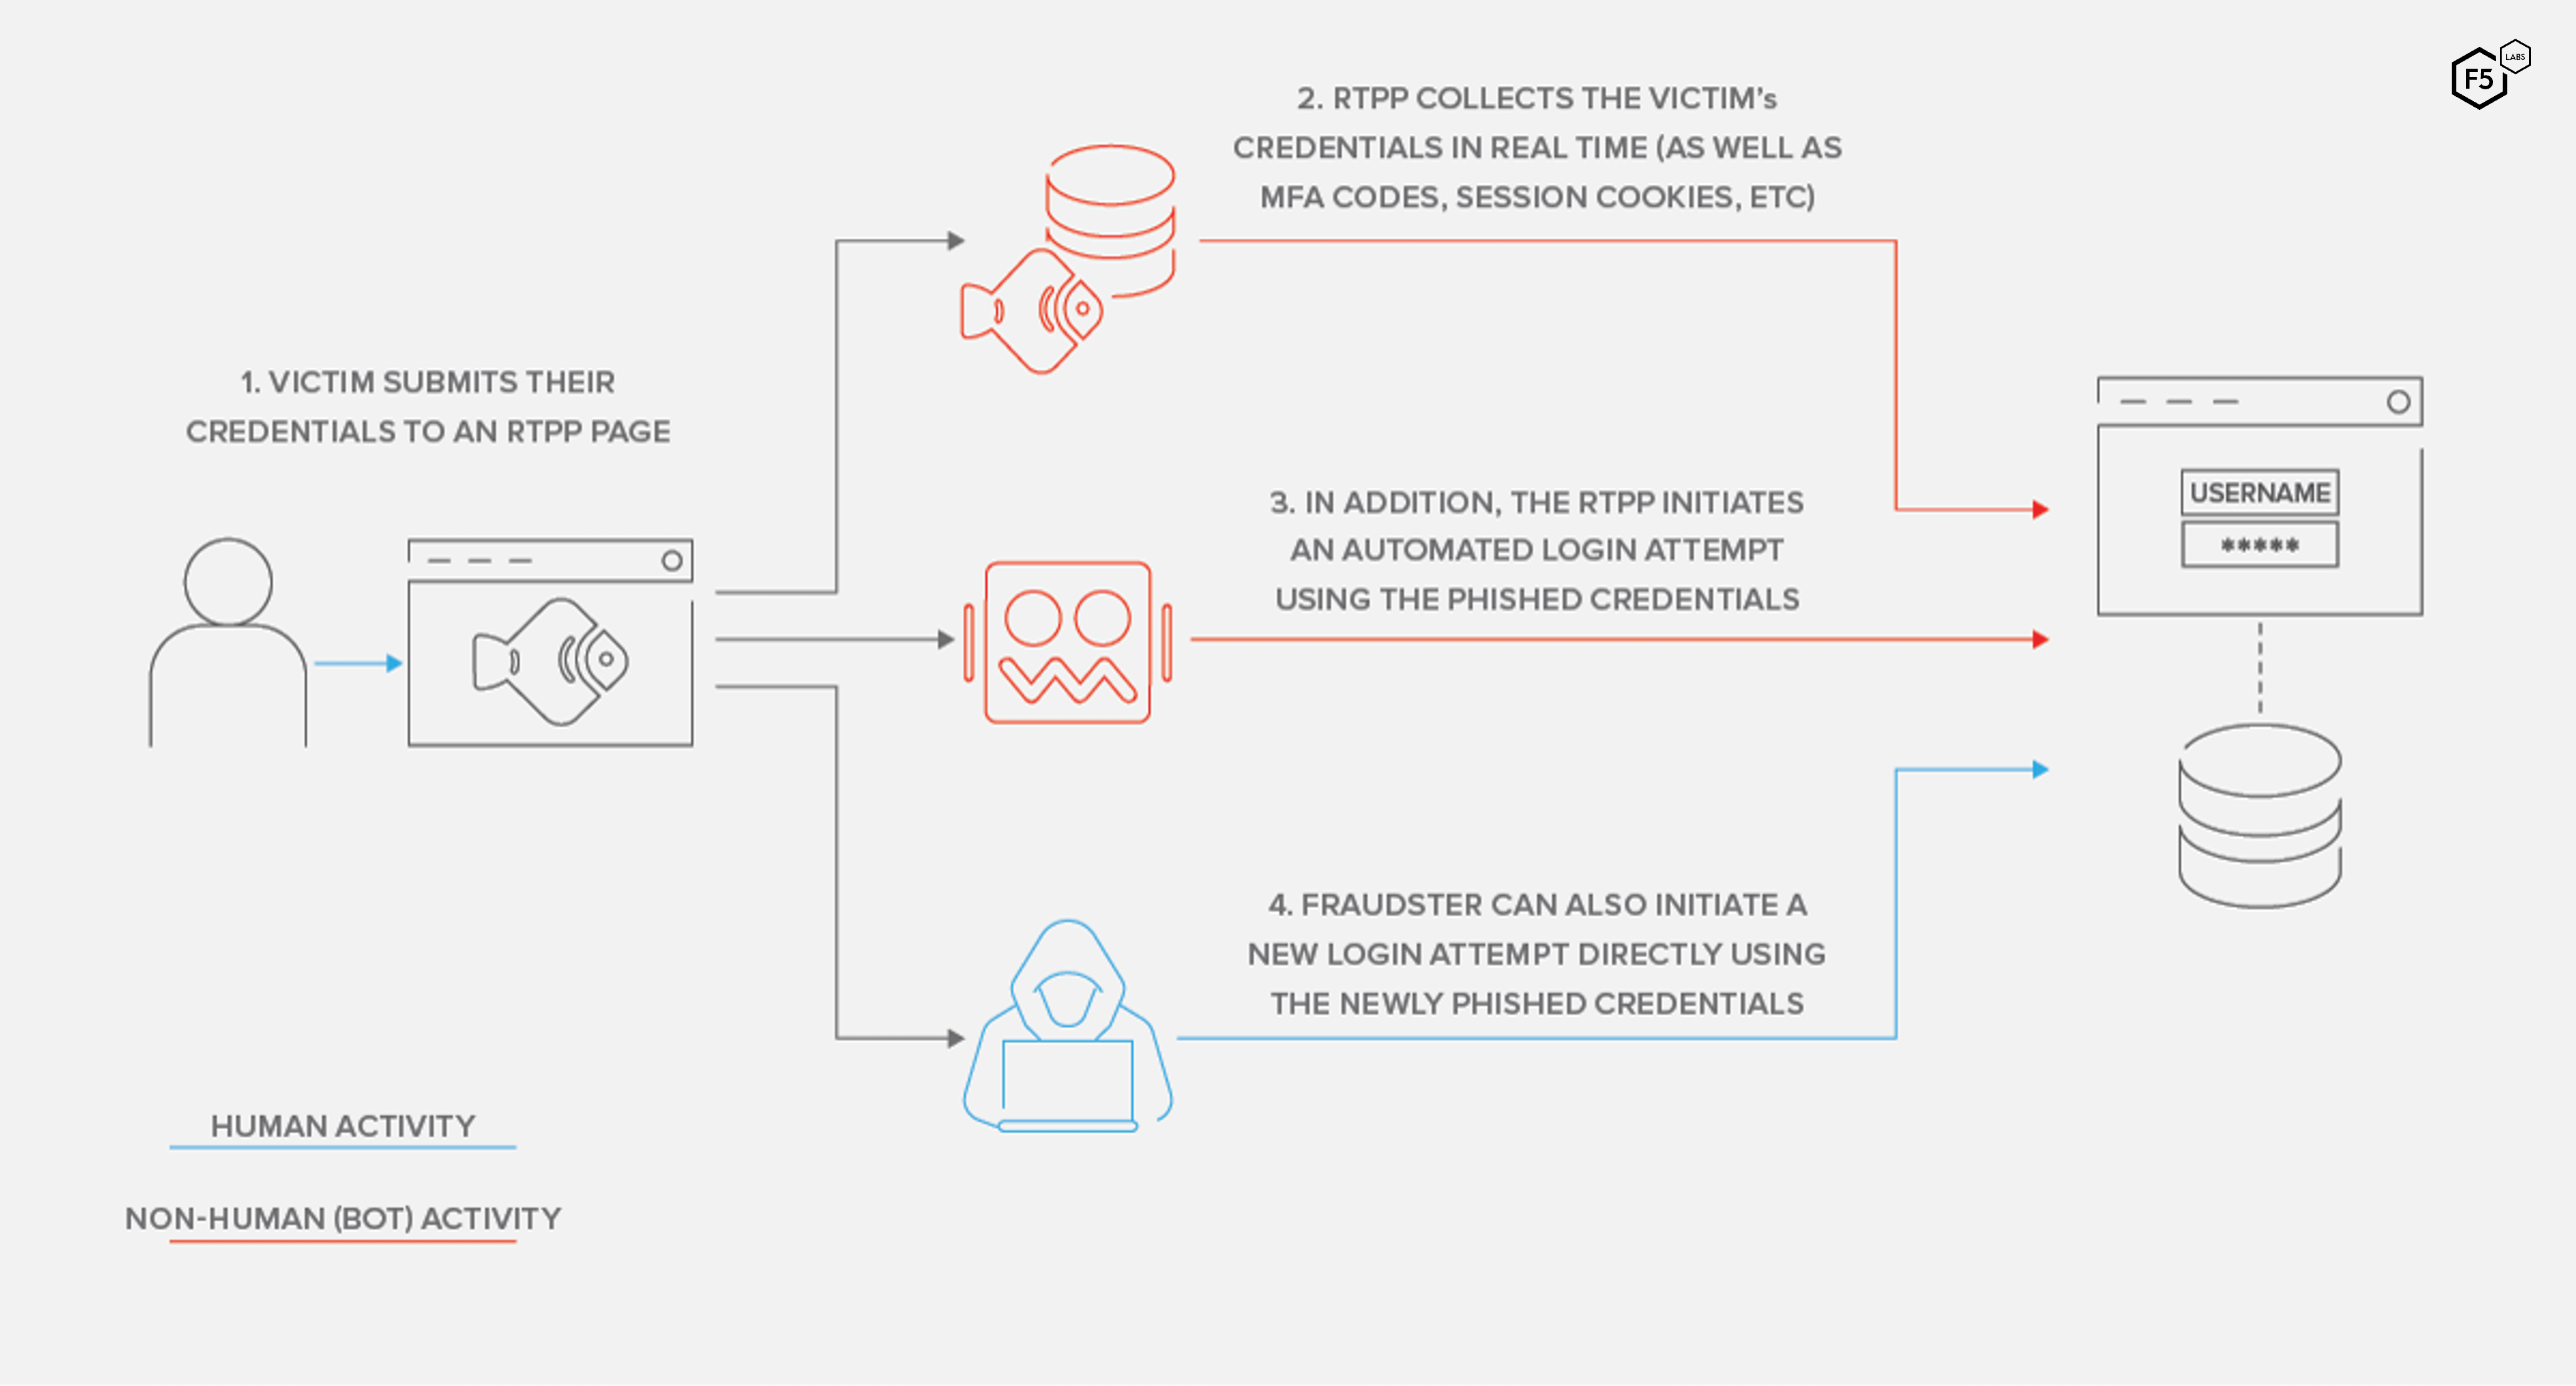
Figure 28. Reverse proxy phishing process. Victims submit their credentials to the proxy site, which allows threat actors to use those credentials—including MFA codes—to login and change passwords, exfiltrate information, or commit fraud.
Figure 29 shows an ad on the dark web for a reverse proxy-style phishing solution. There is much to note here. First, the ad states that the “V3 update of Google sign in” means that “most of the reverse proxy got patched,” and that this tool was based on Evilginx but the author, BabadookServices, “removed all headers from Evilginx which cause detection.” BabadookServices is, in all likelihood, referring to Google’s reCAPTCHA v3, which evaluates requests for automation without any user input such as solving a puzzle.11 This ad was posted on September 24, 2022, and in May 2023 the author of Evilginx released a version 3.0 of his own tool, which probably reflects a need to update it to deal with recent countermeasures such as the ones BabadookServices mentions.
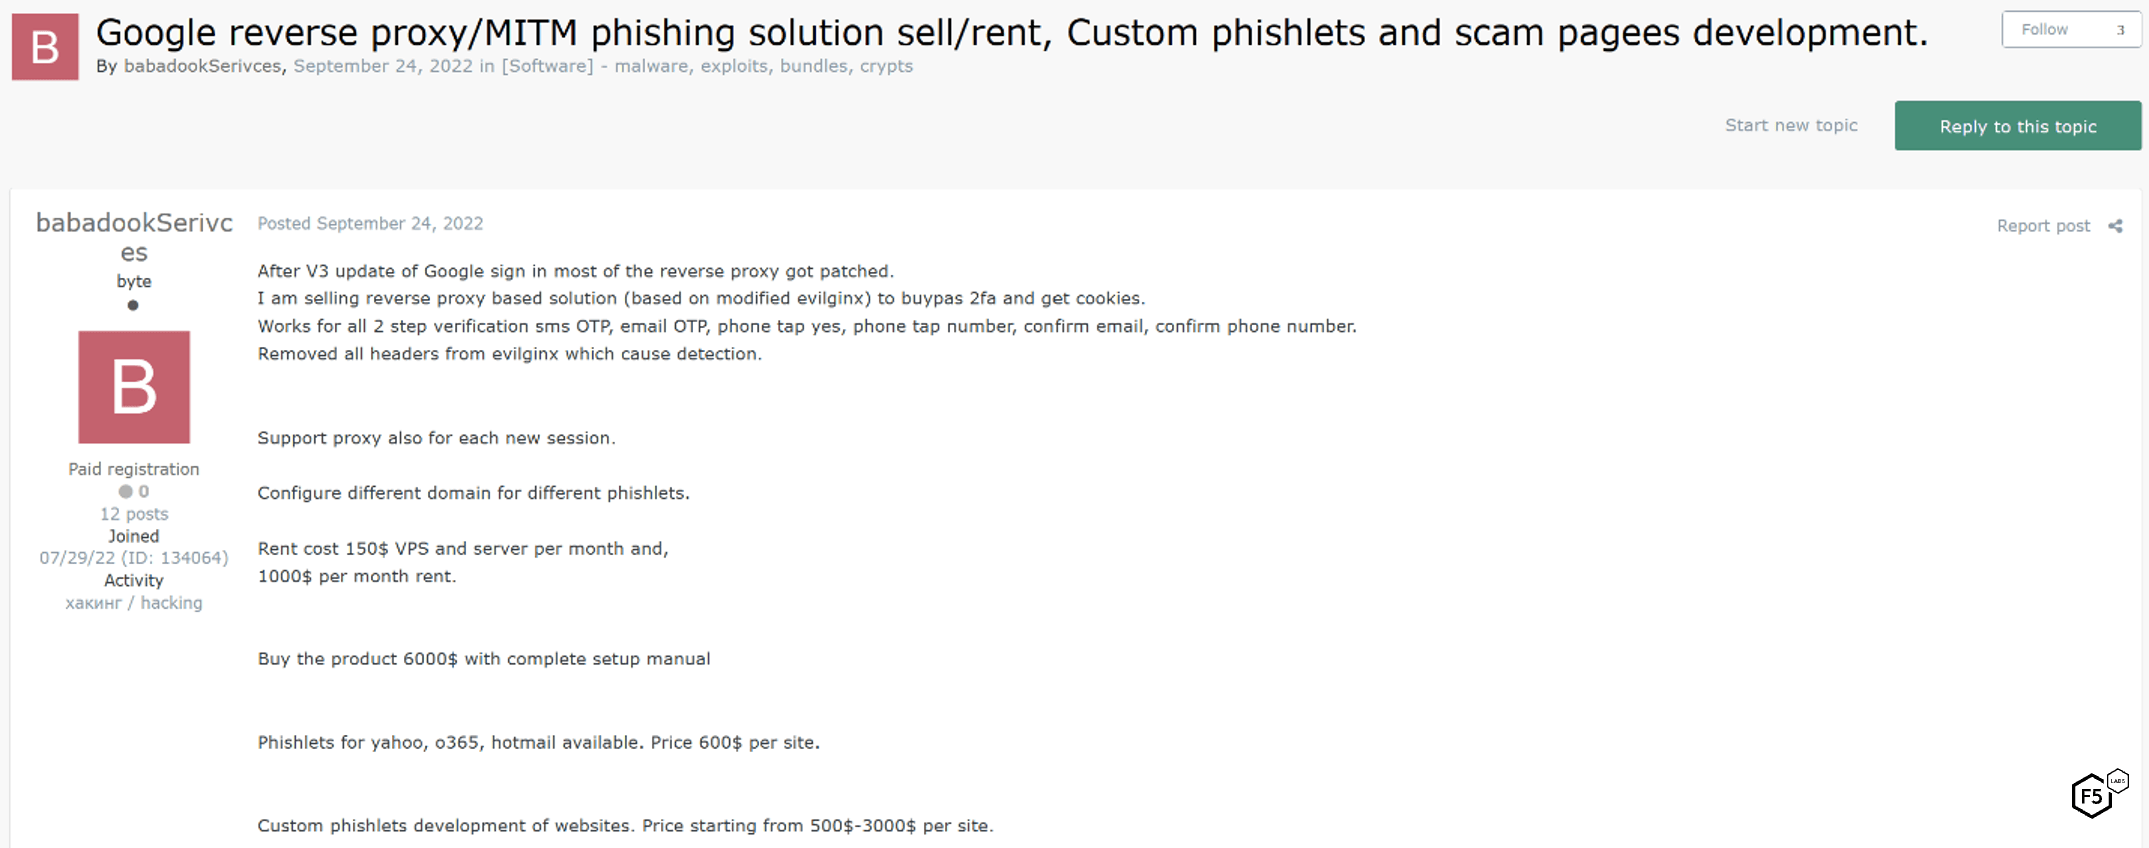
Figure 29. Dark web ad for a reverse proxy phishing solution which boasts the ability to defeat "Google v3," which we interpret to mean reCAPTCHA v3, which uses behavioral telemetry instead of puzzles.
Note also the range of multi-factor authentication approaches this claims to be able to defeat—this is perhaps the most powerful aspect of reverse proxy phishing tools and is why they have essentially become mandatory for cost-efficient phishing campaigns today. Another example of the same approach is visible in Figure 30, which shows another phishing kit built from scratch that offers high capabilities for comparatively high costs: MFA bypass, full cookie dump, and user fingerprints are all within this kit’s capabilities.
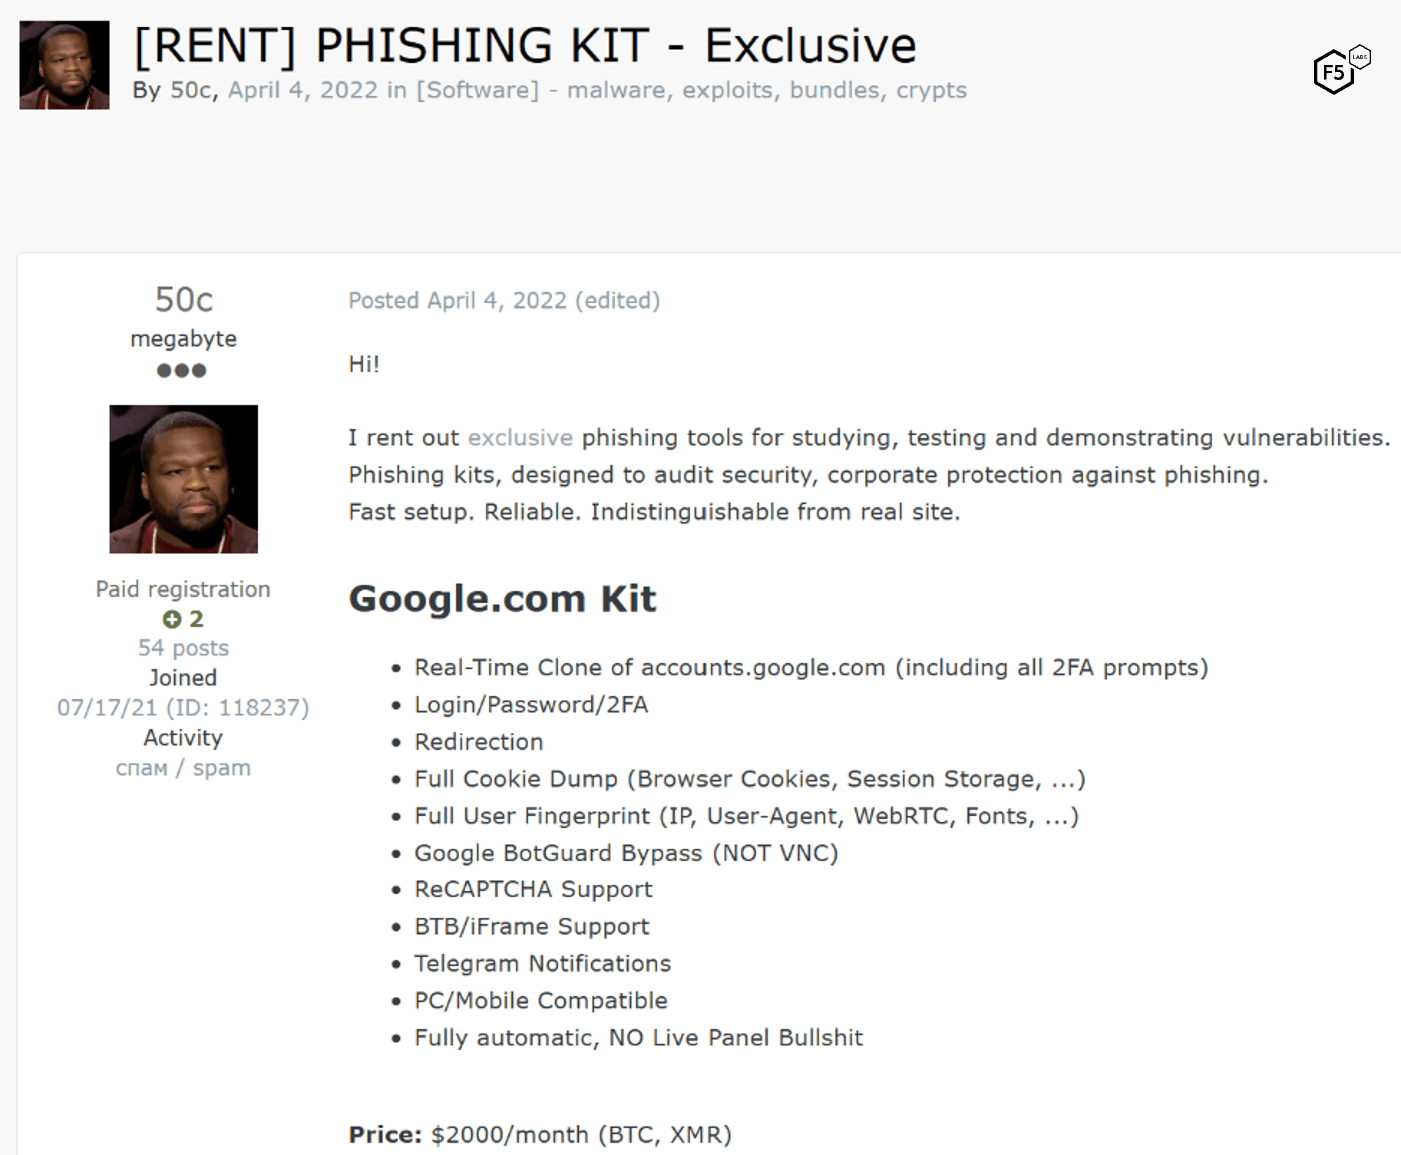
Figure 30. Phishing kit for sale advertising rich capabilities, including multi-factor authentication bypass, cookie harvesting, and user fingerprinting. This kit is designed to specifically target Google identities.
This kit is designed to only target Google identities by replicating the entire Google authentication flow. Dark web chatter generally paints Google as the ultimate target for phishing, partly because of the deep countermeasures which Google has implemented, which leads us to another common phishing TTP: detection evasion or “facilitation of survivability” capabilities.
Phishing Detection Evasion
The dark web also contains significant discussion of tools to evade detection by Google Safe Browsing.12 Figure 31 shows an ad for a JavaScript-based tool named “AntiRed” that provides a “cloak” against Google Safe Browsing detection for phishing landing pages.
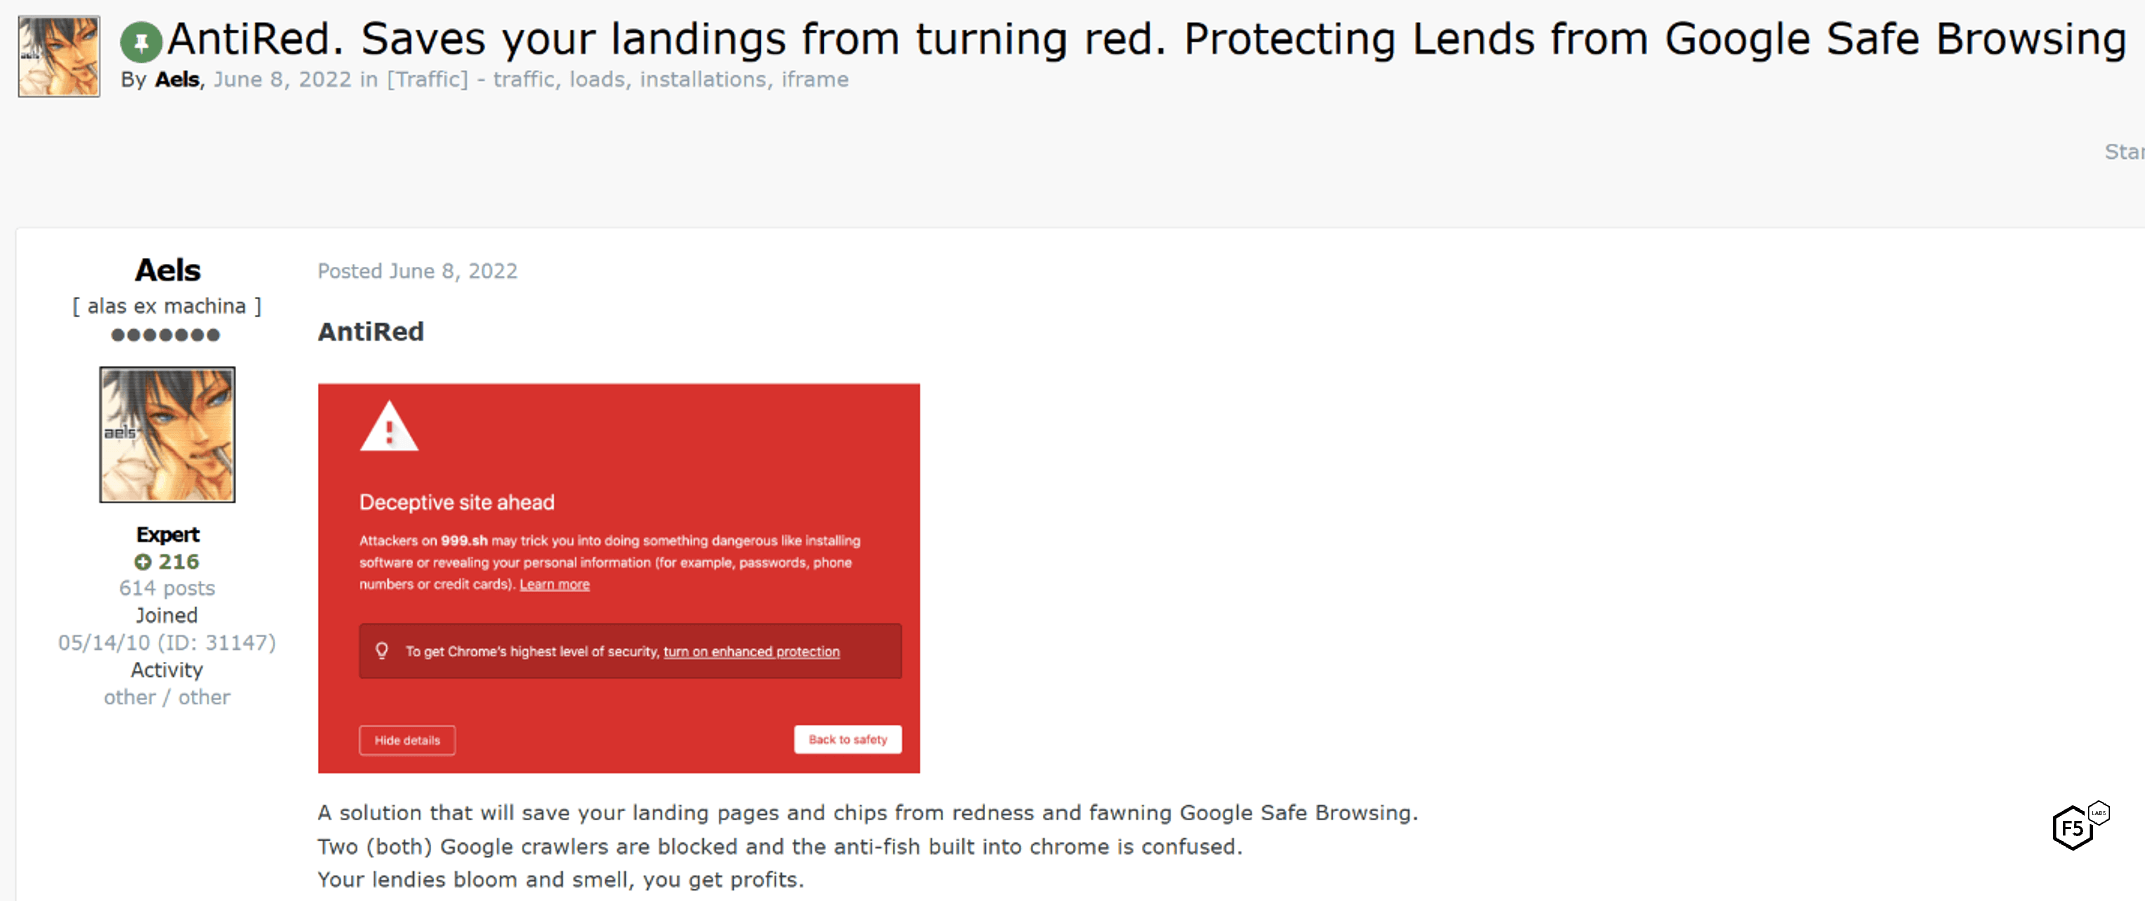
Figure 31. Advertisement for detection evasion capabilities that are effective against Google Safe Browsing.
To implement AntiRed, customers insert the JavaScript code into the <head> element of their landing pages. AntiRed states that it is effective for mobile as well as web traffic, and that it also mitigates several anti-phishing crawlers such as that from Kaspersky in addition to defeating Google Safe Browsing. The author of this tool also offers advice for avoiding detection by managing phishing infrastructure and domains, as can be seen in Figure 32.
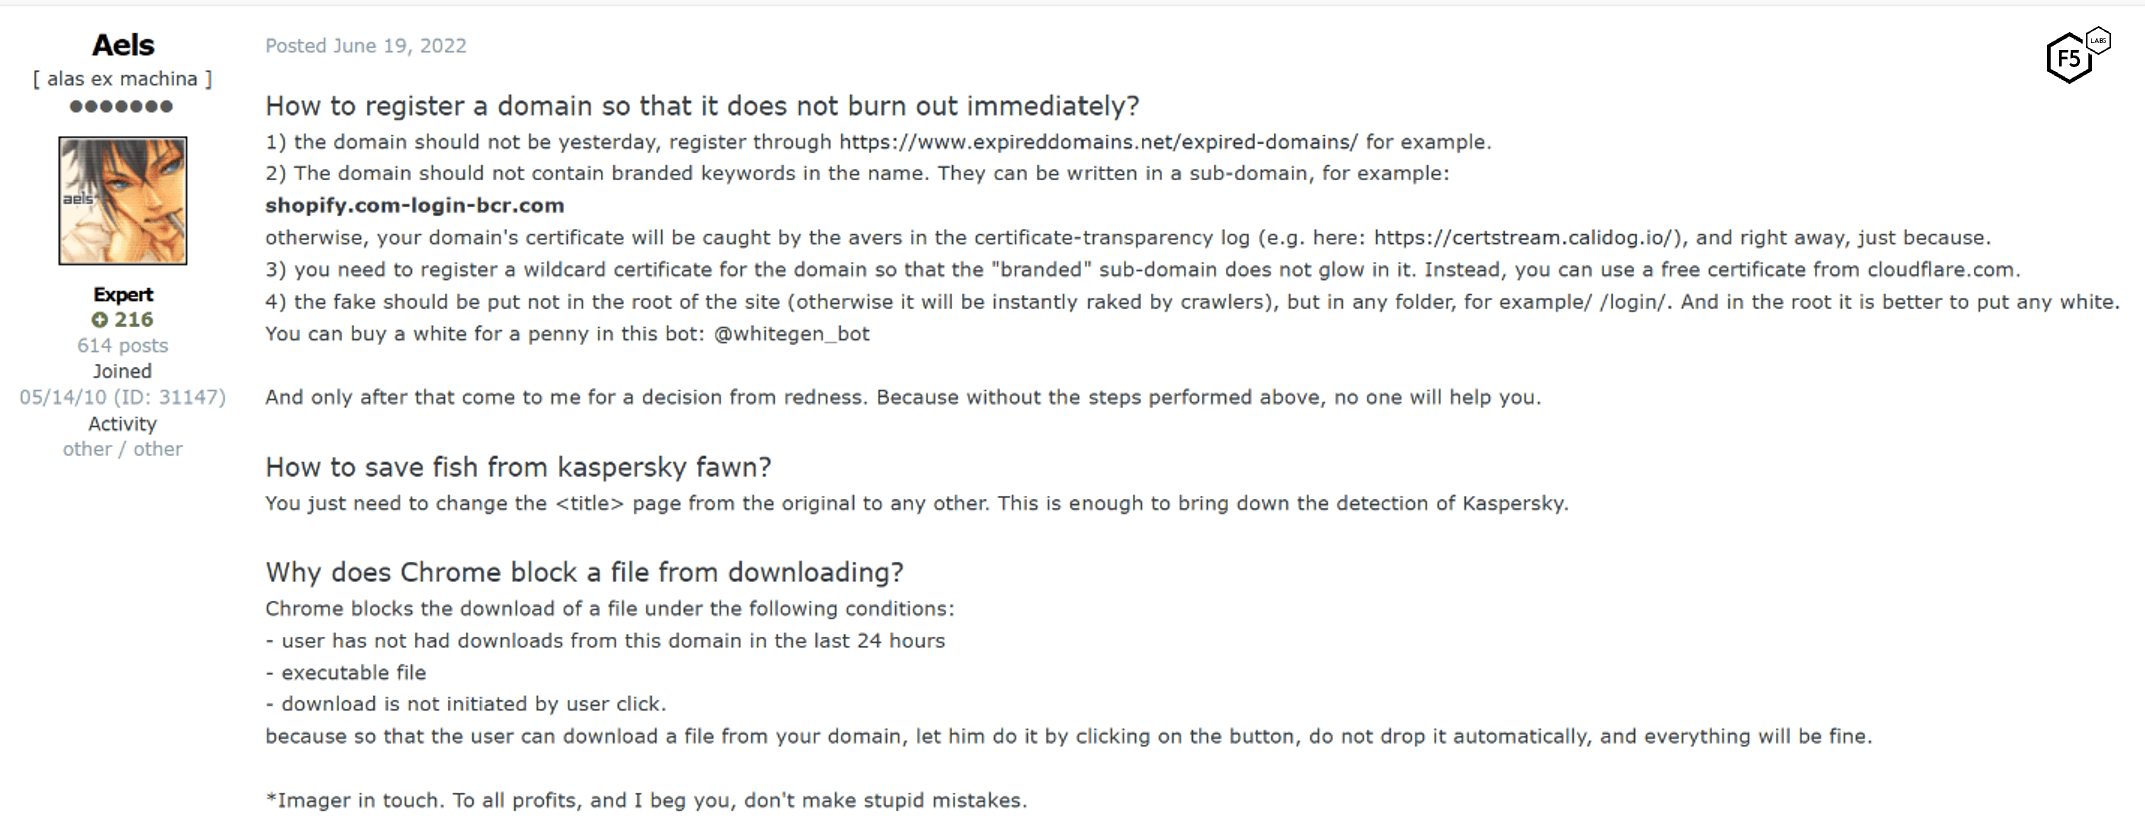
Figure 32. Advice on domain-level detection evasion from the author of the AntiRed JavaScript "cloak.”
Miscellaneous Phishing TTPs
Below are a handful of other trends or observations from dark web phishing chatter that we have included for the sake of completeness.
SMS Phishing (Smishing)
Dark web intelligence indicates that many threat actors find smishing a less attractive prospect than email phishing because smishing has higher and more complex prerequisites. At the same time, F5’s Global Cyber Threat Intelligence and Investigation team has observed significant smishing campaigns against F5 stakeholders for several years. Our guess as to this disparity is that F5 has already observed state-sponsored actors targeting F5 for multiple reasons, and that this apparent overrepresentation of smishing is an indicator of a higher level of motivation than the run-of-the-mill cybercrime motivation behind most phishing.
Voice Phishing (Vishing)
In August 2022, a dark web ad for a voice phishing system that boasted artificial intelligence capabilities was observed (Figure 33). The subsequent leap forward in artificial intelligence in the following year makes the cost of entry for this vector significantly lower. Despite the comparative rarity of this approach based on past observations, we predict an uptick in this approach in the near future.
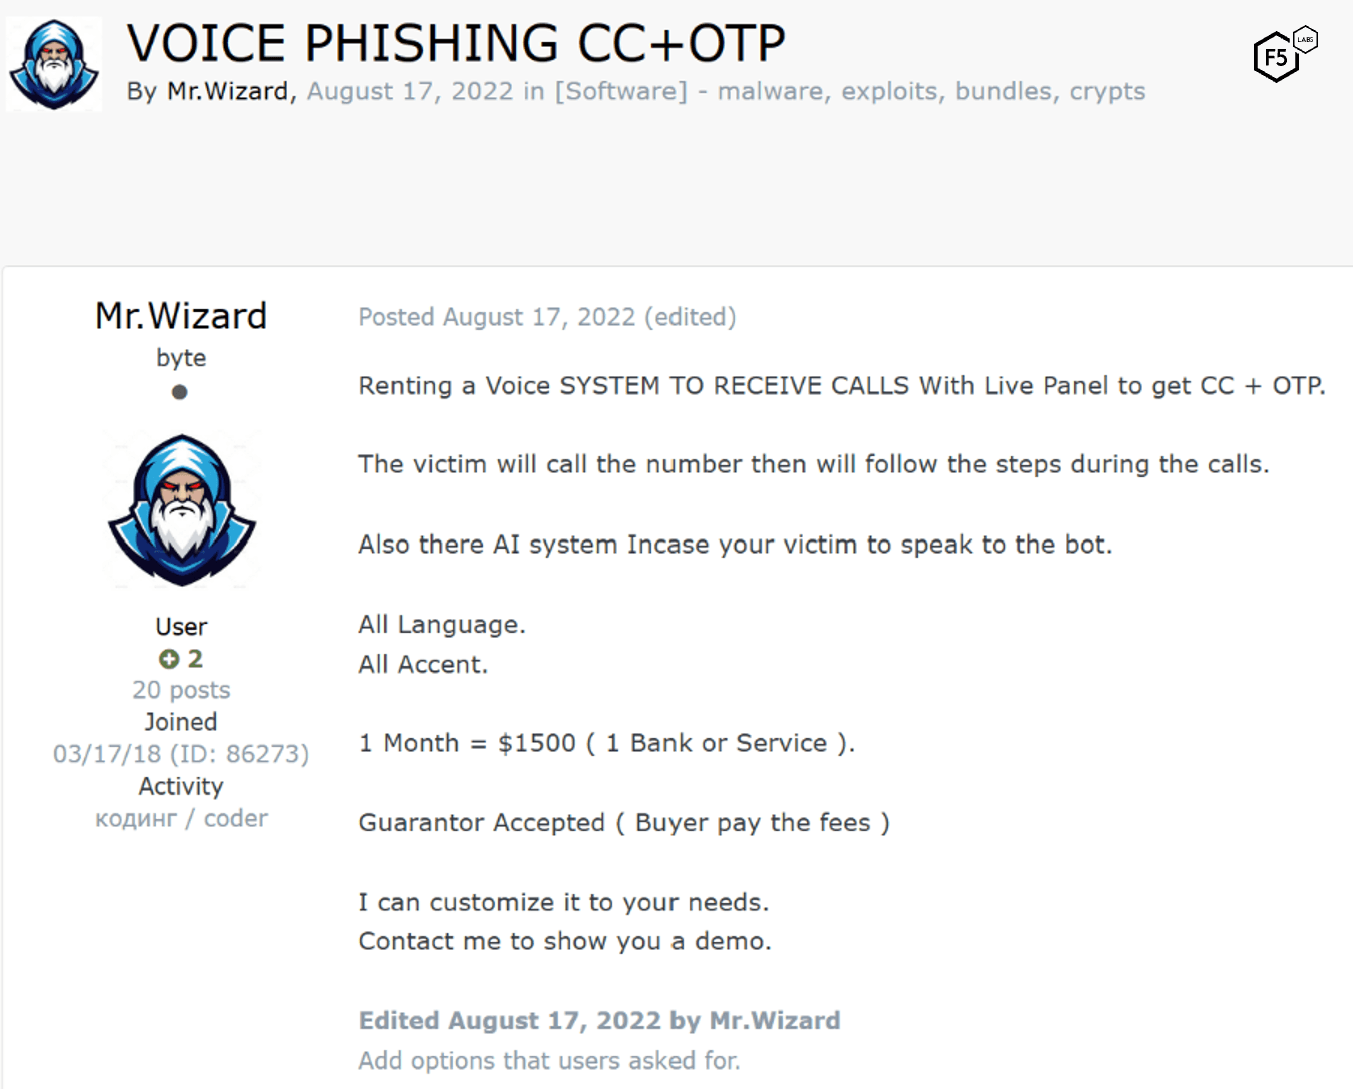
Figure 33. Ad for voice phishing system from August 2022.
[back to top]
Phishing Summary
To recap our examination of phishing in 2023:
- Phishing is so widespread and common as to be considered ubiquitous.
- The most frequently targeted organizations appear to be financial organizations and large identity providers such as Microsoft, Apple, Facebook, and Google.
- Increased commoditization and shifts towards a service model mean that attackers have their choice of involvement. The cost for low-skill attackers to execute high-capability phishing campaigns is declining.
- Reverse proxy phishing tools (sometimes called real-time phishing proxies or man-in-the-middle (MITM) phishing kits) that can bypass multi-factor authentication and collect cookies have become standard. Several open-source platforms exist, as well as custom frameworks developed by skilled actors.
- Detection evasion capabilities are also increasingly common, such as the AntiRed service that defeats browser based phishing analysis.
[back to top]
Multi-factor Authentication Bypass
For more than a decade, the information security community has touted multi-factor authentication as a way to control identity risk. It was probably inevitable, then, that this pillar of contemporary security would become an object of focus for attackers. The last few years have seen attackers adopt a handful of different approaches to bypassing multi-factor authentication. The differences in these approaches are largely driven by the details of what attackers are trying to accomplish and whom they are attacking, but they have also clarified significant differences between multi-factor authentication approaches, as we’ll see below.
[back to top]
MFA Bypass via Phishing Reverse Proxies
The reverse proxy approach delineated earlier in the Phishing section has become the new standard for phishing technology, largely because of its ability to defeat most types of MFA. Figure 30 (above) showed a custom-made phishing system aimed at Google identities, and notably included all of the MFA challenges from the normal Google authentication flow in the phishing site.
To our knowledge there is one approach to multi-factor authentication that is resistant to the reverse proxy approach, which is to use MFA based on public key infrastructure (PKI) such as the FIDO2 or PIV (smart card) protocols.13 In such an authentication flow, the identity provider uses the user’s public key (which it has from a prior registration process) to generate a randomized challenge, which the user’s system then cryptographically signs with their private key. The randomness prevents a replay attack, the private key is not transferred through the proxy for the attacker to harvest, and the same-origin policy prevents a signed challenge generated for one site—such as the reverse proxy posing as a real site—from being passed directly through to the real site.14
This also means that while many of these reverse proxy phishing approaches also harvest cookies and other tokens residing in browser sessionStorage and localStorage (Figure 29 and Figure 30 in the previous section), the proxy will not receive any authentication tokens because the MFA challenge will fail.
Starting in 2021, many developers in the identity and access control space (such as Auth0 and Okta) began supporting platform biometrics (such as Apple FaceID, TouchID, or Windows Hello) with the WebAuthn protocol (which is one half of the FIDO2 protocol mentioned earlier).15 This means that most common biometrics are also implementing PKI-based credentials, and so are resistant to reverse proxy phishing.16 Note that other approaches that are able to harvest post-authentication session cookies, such as the malware approach just below, can potentially defeat FIDO2-based MFA.
[back to top]
MFA Bypass via Malware
In mid-2022, F5 malware researchers published an analysis of a new strain of Android malware named MaliBot. While it primarily targeted online banking customers in Spain and Italy when it was first discovered, it had a wide range of capabilities, including the ability to create overlays on web pages to harvest credentials, collect codes from Google’s Authenticator app, capture other MFA codes including SMS single-use codes, and steal cookies.
For all other MFA approaches, such as an authenticator app or SMS, the same rules apply as above, and MaliBot doesn’t offer any capabilities in this respect that a reverse proxy phishing tool lacks. It also has some disadvantages, in that it requires social engineering to trick the user into downloading and installing it. However, the persistence that installed malware offers over a phishing attack means that MaliBot has the ability to steal cookies or other session tokens post-authentication, which can potentially defeat PKI-based MFA capabilities. As a result, malware-based MFA bypass techniques have some advantages over reverse proxy phishing for attackers targeting users with PKI-based MFA (which is admittedly a small population).
This approach is obviously not limited to MaliBot. Figure 34 shows a screenshot from an ad for malware named Rhadamanthys. The ad explicitly lists the MFA tools (as well as the password manager KeePass) that it can compromise.
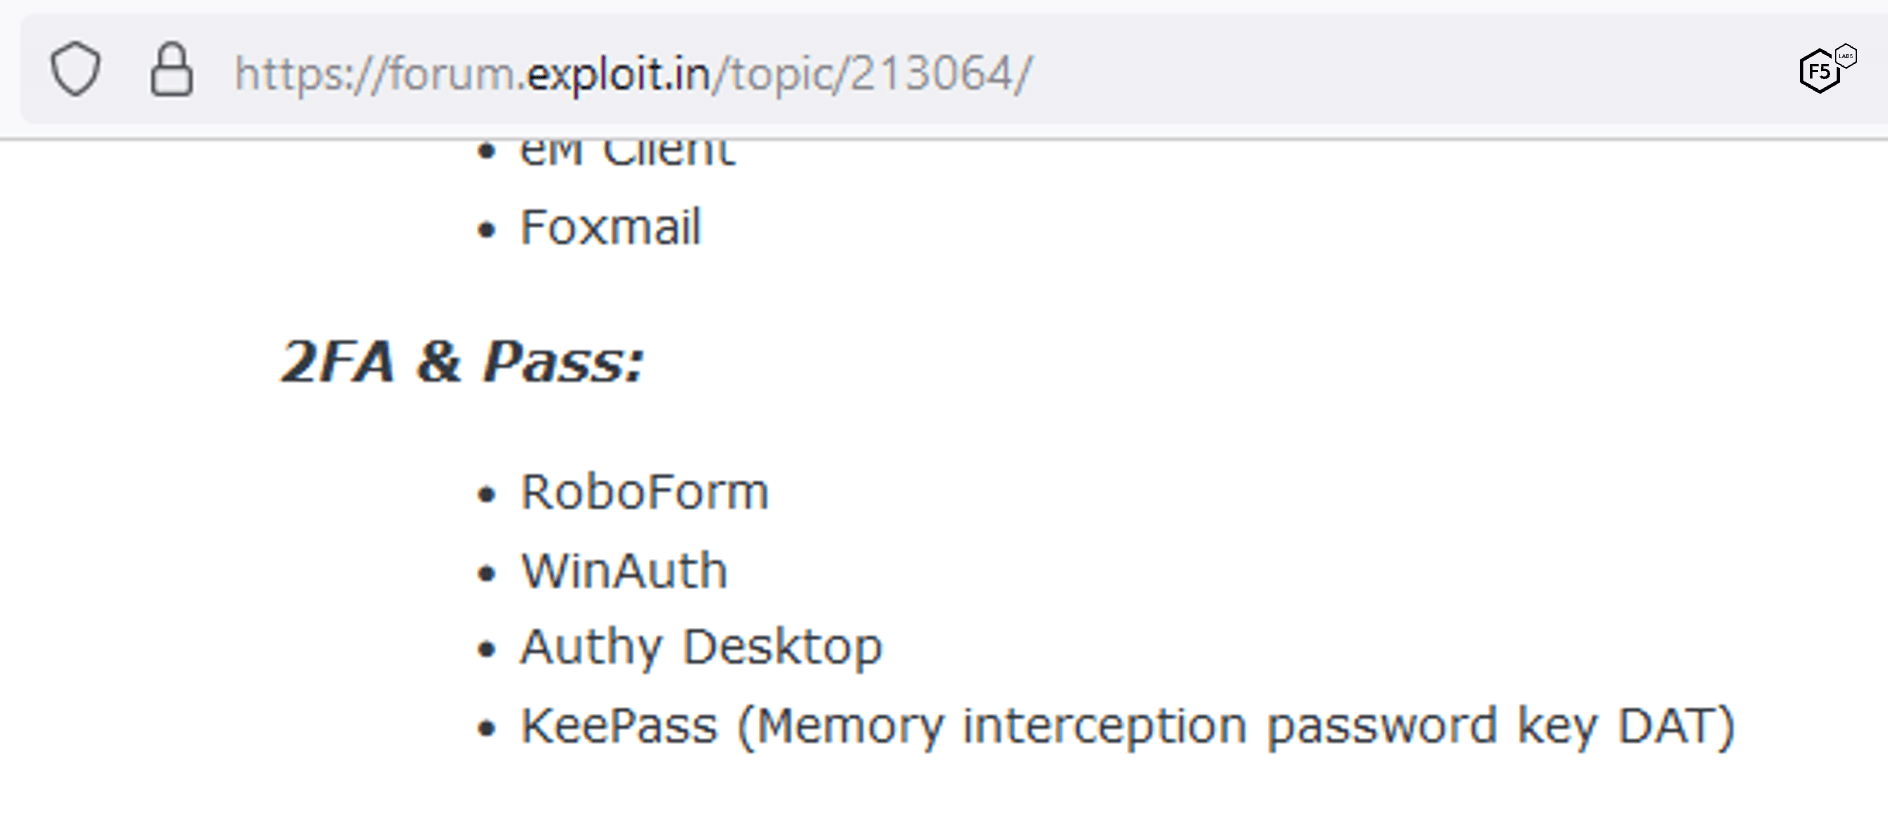
Figure 34. Screenshot of MFA bypass capabilities of malware named Rhadamanthys.
[back to top]
MFA Bypass via Social Engineering
There are several variations on social engineering to bypass MFA. Some target the owner of the identity, and some target telecommunications companies to take control of phone accounts.
Social Engineering for MFA Code—Automated
These are attacks in which attackers provision an automated phone system to spoof an identity provider and ask for an MFA code or one-time password (OTP). Figure 35 shows an example service.
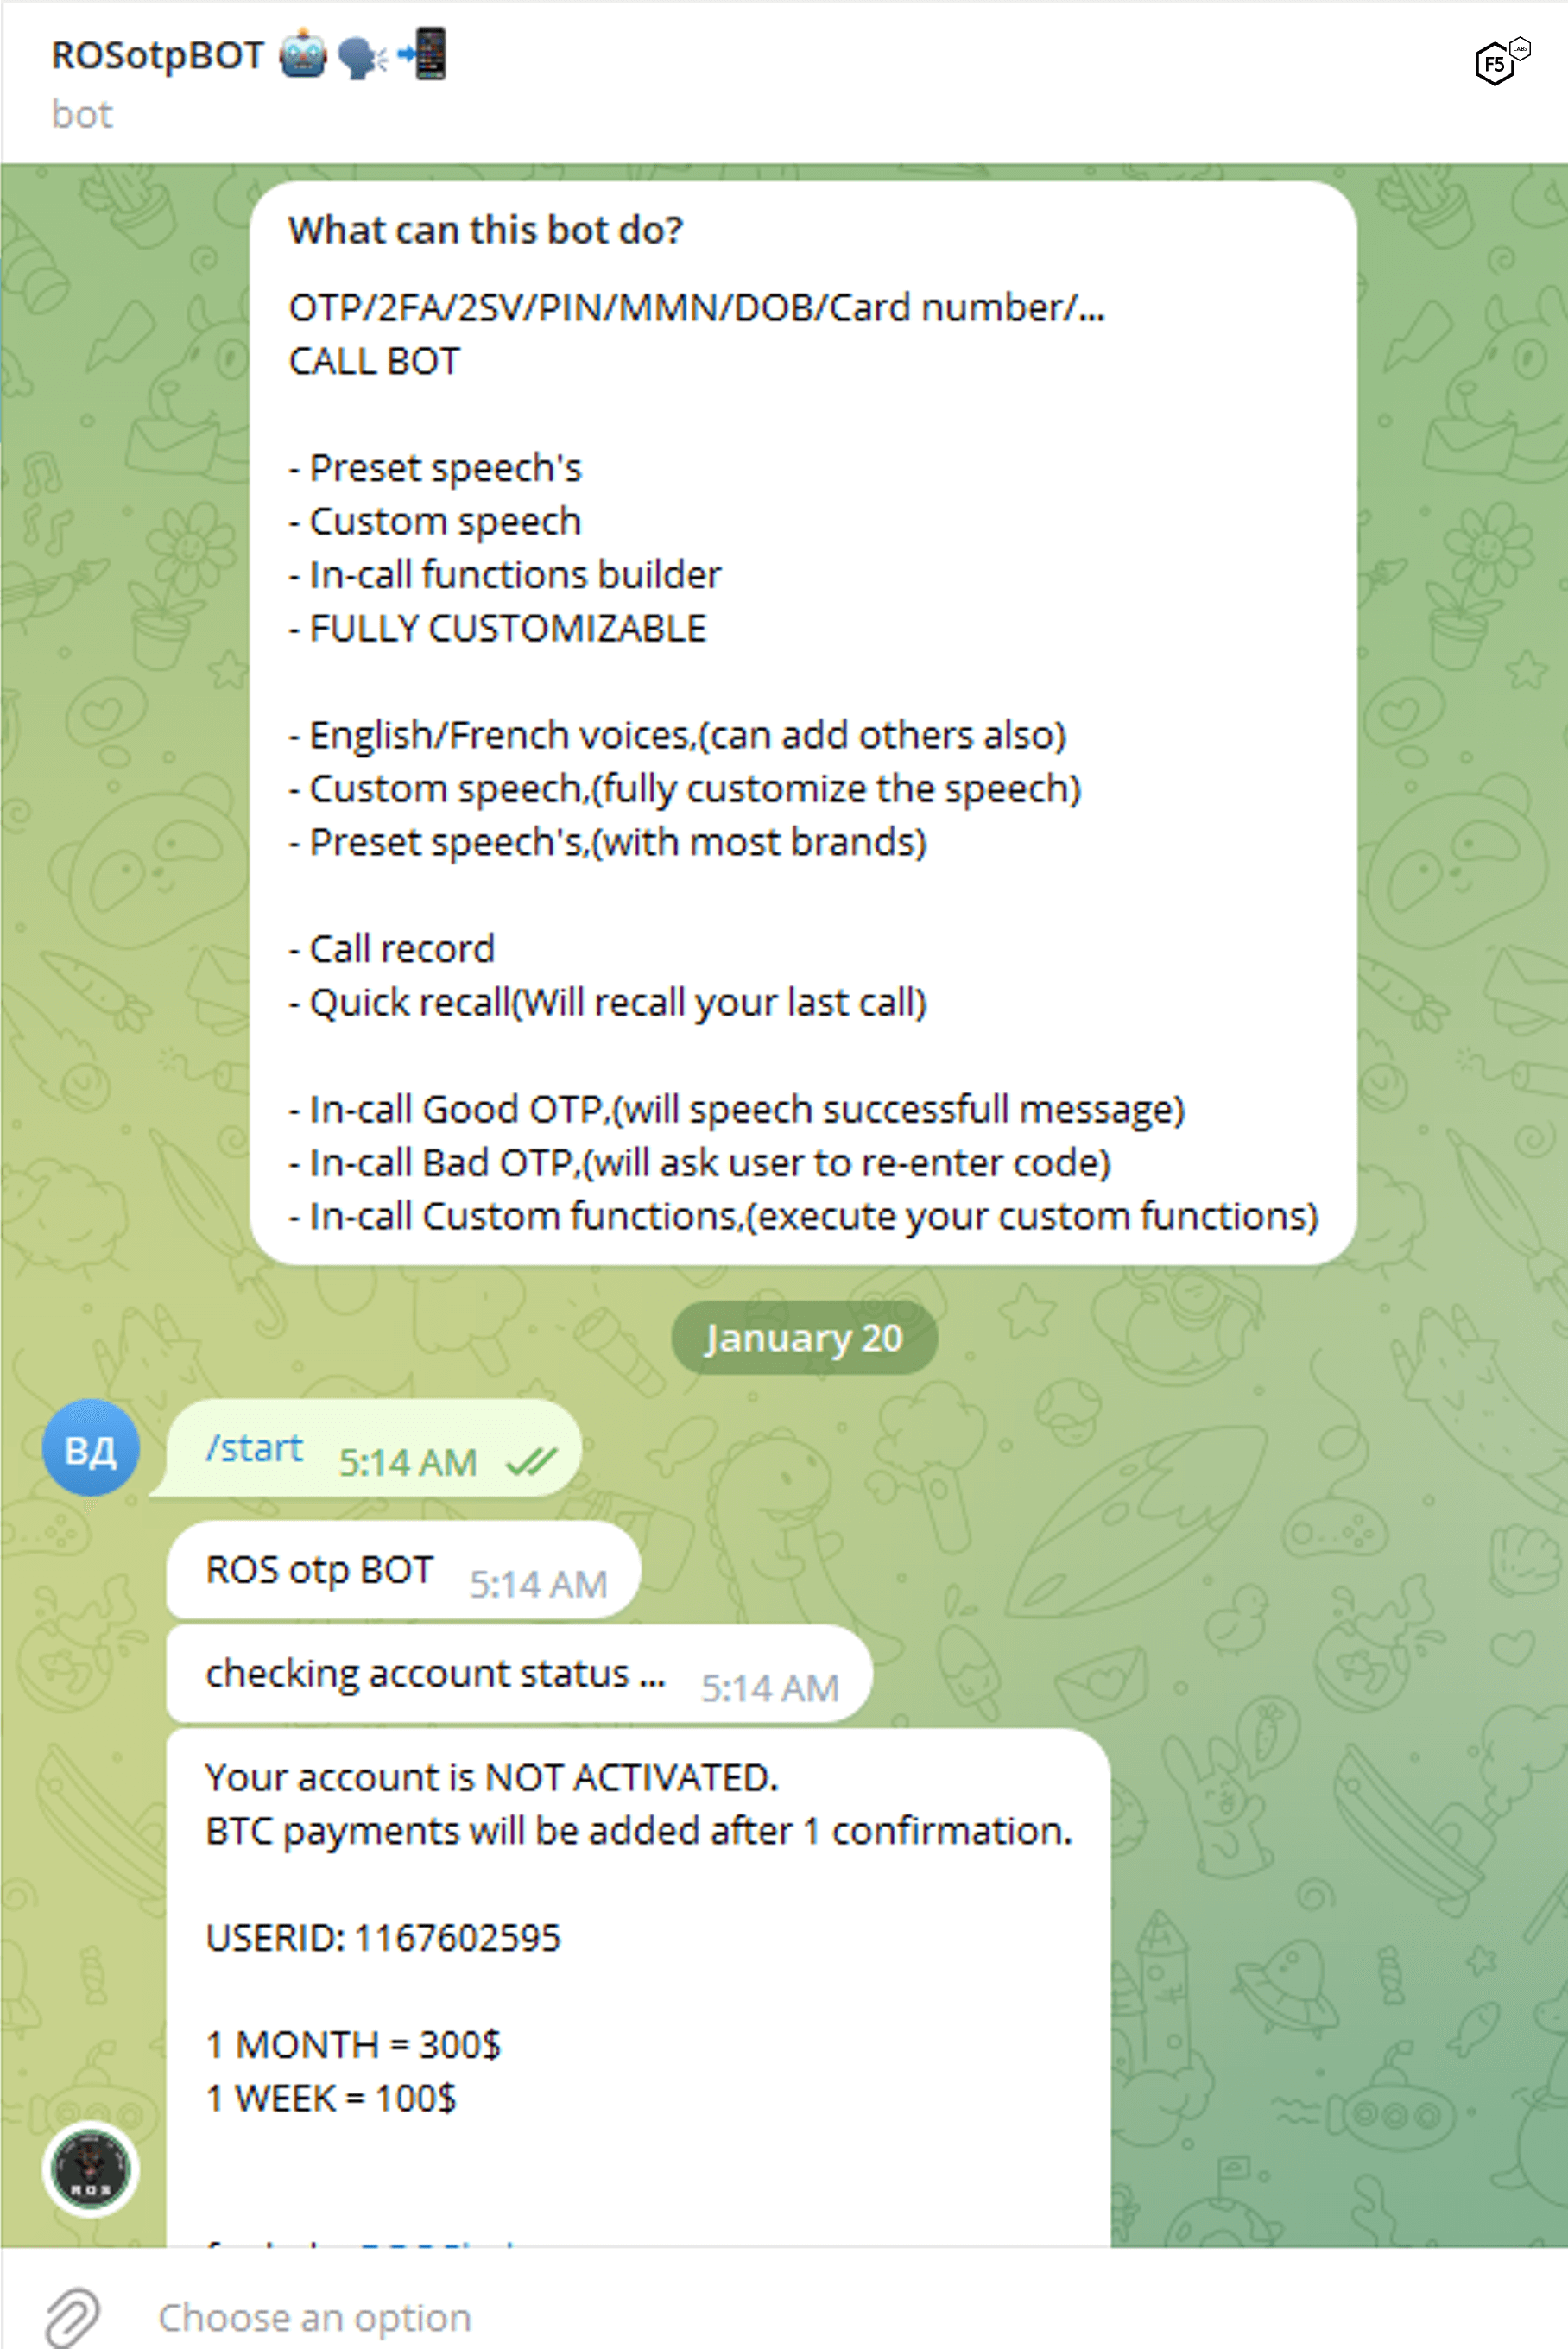
Figure 35. Screenshot of a threat actor offering an automated phone system to harvest MFA/OTP codes.
One important prerequisite is that this approach requires the attacker to have obtained and tested the individual victim’s credentials via another method. This credential testing is a good scenario for the information facilitation-type credential stuffing attacks that we detailed earlier (Figure 8). Some of these approaches are novel in that they ask the victim to type a code into the phone rather than speak it, due to the widespread guidance that users should never divulge their code to anyone else.
Social Engineering for MFA Code—Human
This is the same as the above approach except that the phone calls come from humans and not an automated system. This approach obviously scales less well than the automated approach and would presumably be reserved for attacks with a higher probability of success. It also has the same prerequisite of having already obtained the regular credentials for the target. Figure 36 shows an example of a threat actor advertising this capability.
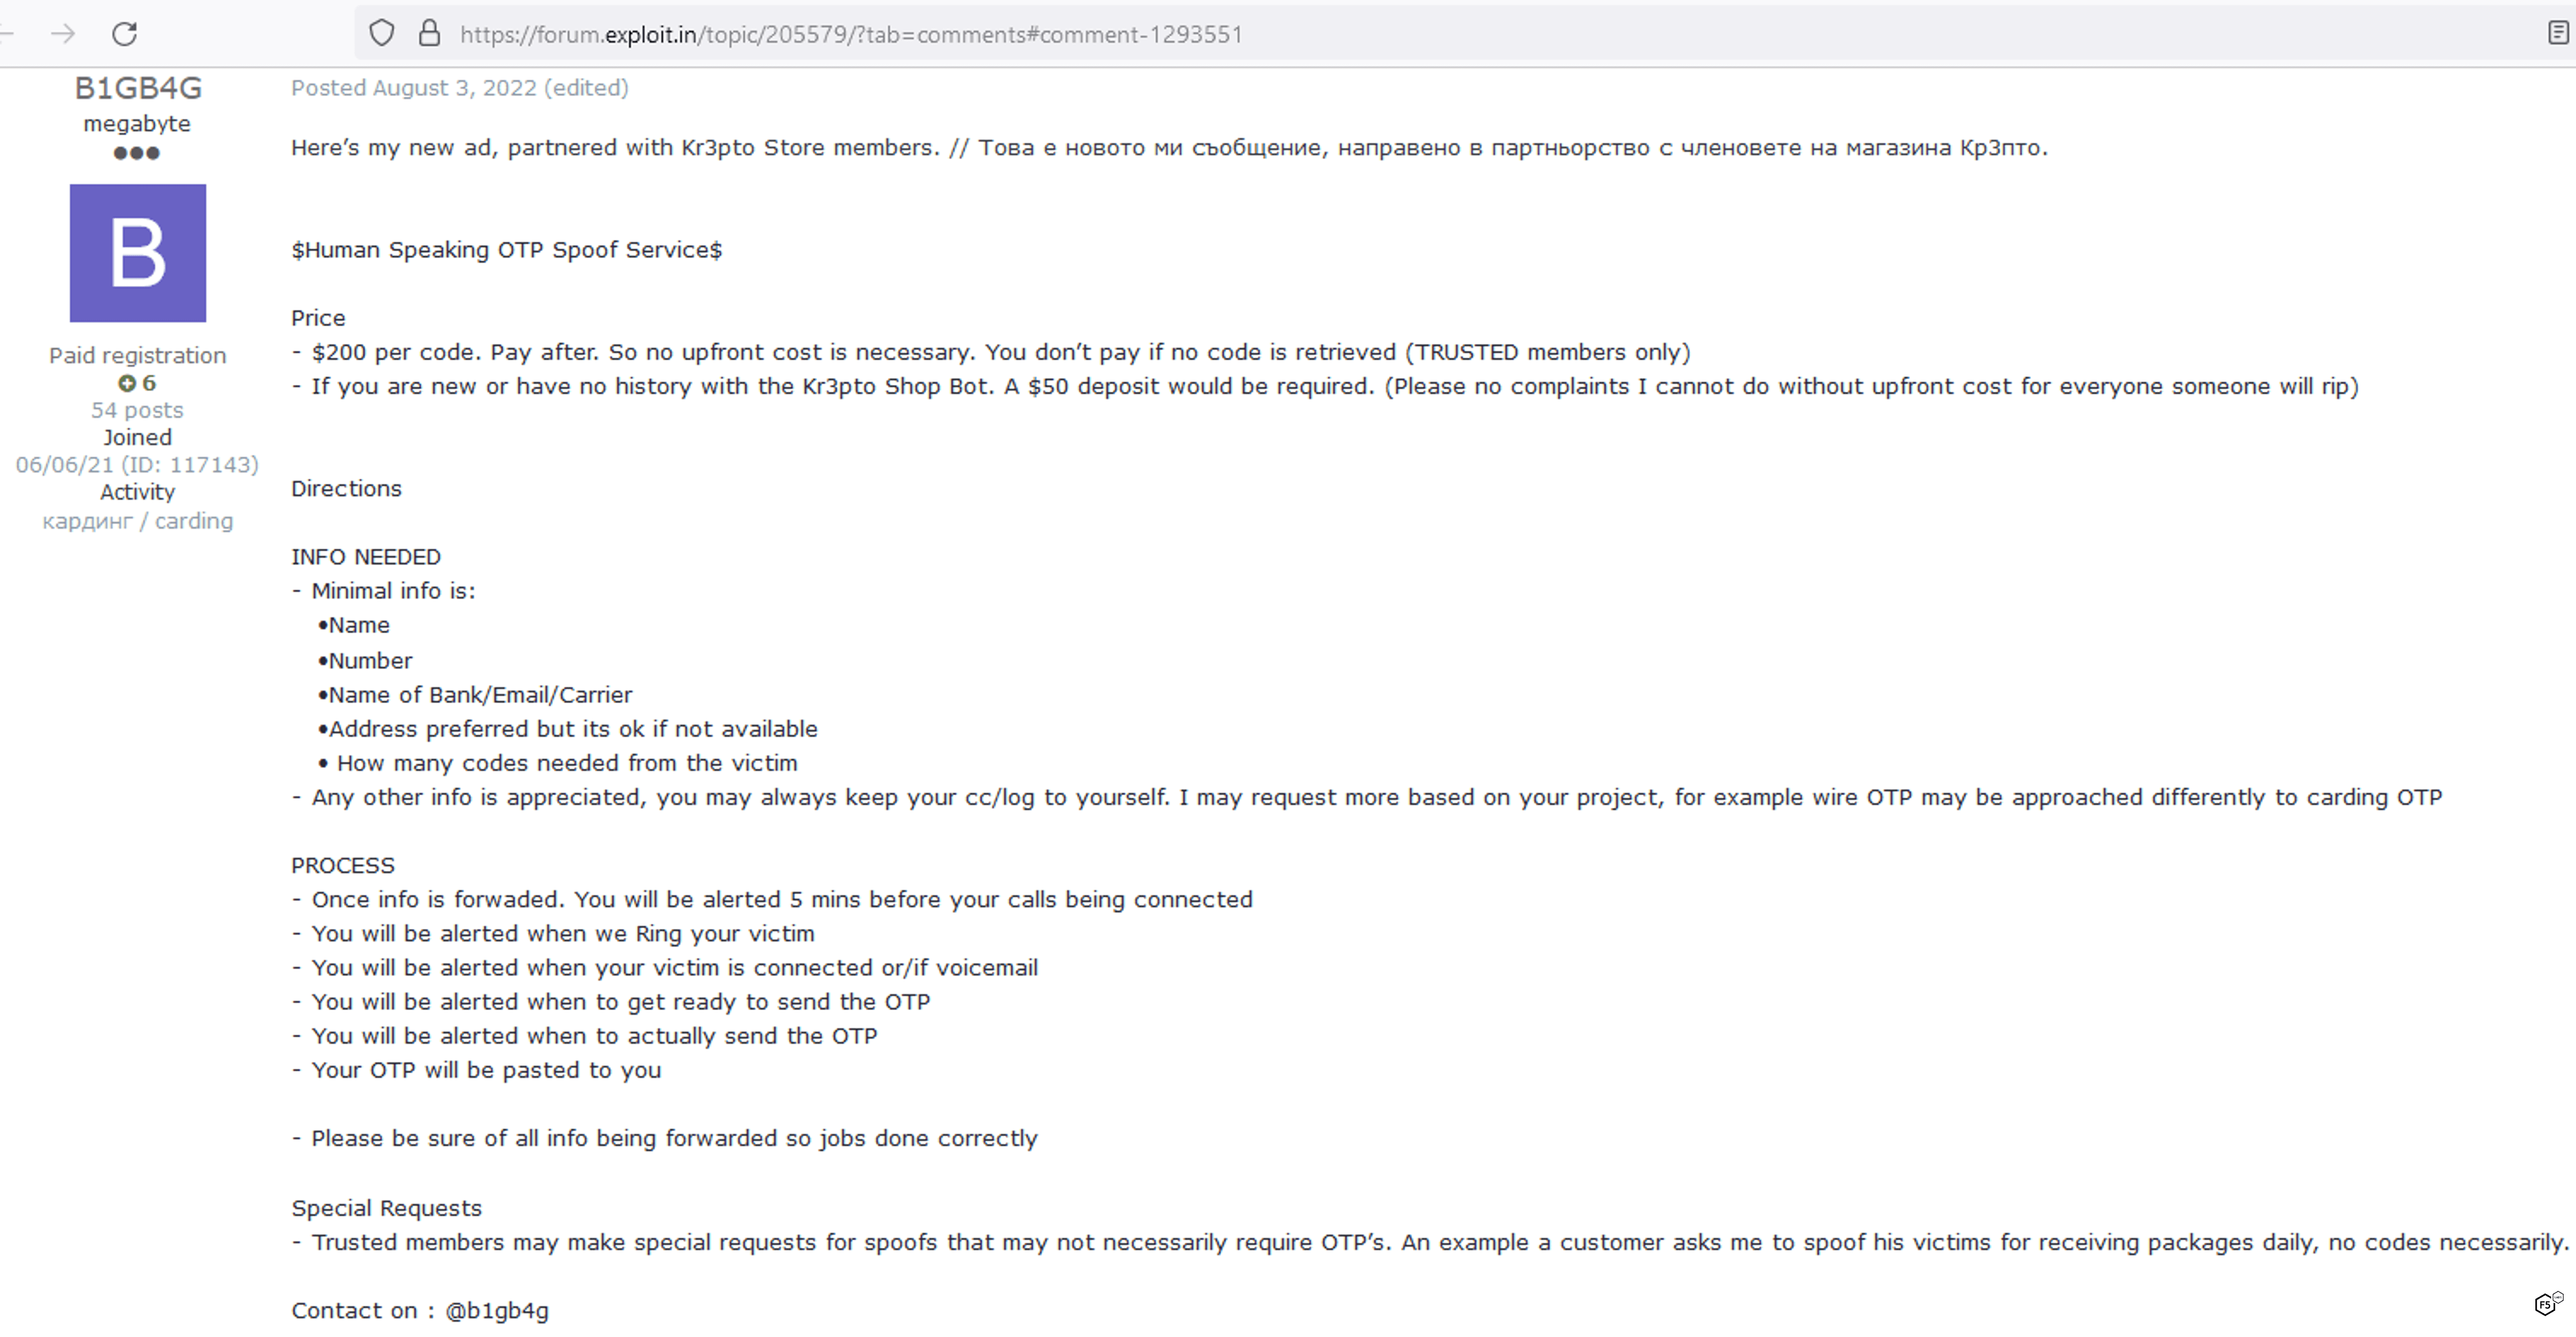
Figure 36. Dark web advertisement for MFA/OTP code harvesting via a call from a human.
SIM Swaps
In this kind of attack, a threat actor obtains a SIM card for a mobile account that they want to compromise, allowing them to assume control of the device and collect MFA codes, OTPs, or confirm a push-style MFA prompt. There are several variations on this approach.
In the social engineering approach to SIM swapping, the attacker contacts a telecommunications provider and convinces them to send a new SIM card to the attacker’s address. These attacks require greater effort and preparation than the other MFA bypass techniques. They require the attacker to have the victim’s credentials for the target identity provider and their phone number at a minimum. The more information about the victim the social engineer has, the higher likelihood they can convince the telecommunications provider to do the SIM replacement. Attackers also share playbooks with one another outlining specific policies and processes from telecommunications providers in order to maximize their chances of success.
In another variation on this approach, attackers work with an insider in a telecommunications company to arrange SIM swaps for compromised identities. Threat actors on the dark web claiming to be insiders at U.S.-based mobile companies are common on dark web forums. Figure 37 shows a post from an alleged insider at an Italian telecommunications firm.

Figure 37. Dark web post by an insider threat at a telecommunications company, offering SIM swaps for a 50% cut of profits.
Finally, there is another approach to compromising MFA via mobile phones that does not rely on a SIM swap. Some mobile providers allow account holders to use web portals to send and receive SMS messages. In such a situation, an attacker could use credential stuffing to gain access to the SMS portal, then intercept MFA codes for other accounts and replay them. This hinges on already having multiple sets of valid credentials, and also on the absence of MFA at the mobile provider.
[back to top]
MFA Bypass Summary
If nothing else, we hope it is clear that identity threats focusing on multi-factor authentication have advanced. Of the MFA bypass techniques we’ve just outlined, reverse proxy phishing has the lowest cost of entry, the greatest amount of commoditization, and is almost certainly the most common in the wild. Malware is probably the second most common approach, while various social engineering strategies are probably the least frequent, given that they require the attacker to already control the username and password, unlike the other two techniques.
The added pressure on MFA is probably an indicator of how effective multi-factor authentication has been over the last decade. Wolfgang Goerlich recently summed it up nicely by saying, “Whenever a control reaches critical mass, the control will be bypassed. Another way of saying that is, all a better mousetrap does is breed better mice.”17
In this case, however, this attacker focus on MFA has also clarified that not all MFA schemes are equal in their ability to control risk. FIDO2 based approaches, whether they rely on hardware or software to sign challenges, are resistant to most of these techniques, and the only way we are currently aware of to bypass this kind of MFA is to steal cookies via another vector such as malware.
There is one other implementation of MFA outside of the PKI approach that is worth mentioning because it is resistant to some MFA bypass approaches, and it highlights the importance of proper implementation. It is possible to implement simple MFA approaches like OTPs such that the OTP is required at the same time as the other credentials, either appended to the password or transmitted separately. The important aspect here is that the attacker doesn’t gain any additional information before being asked for the second factor.
A reverse proxy approach would still succeed, in that the attacker would still be able to pass the concatenated password and OTP through to the origin and allow the attacker in. However, other MFA bypass techniques listed here would struggle against such an arrangement because they would never be able to confirm that they had the right credentials in the first place, nor would they be able to tell that MFA was required. Even organizations lacking the budget or bandwidth to implement PKI-based approaches can take steps like this to harden their MFA.
[back to top]
Recommendations and Conclusions
Here we want to wrap up a few loose ends, provide some guidance about mitigating these threats, and finally see how to encapsulate the difference between web threats and identity threats.
Password Managers
As with MFA, password managers have been a staple in the list of recommendations from most security people for several years, so we should not be surprised by the compromise of several password managers in the recent past. These compromises include the data breach of LastPass in the second half of 202218 and the release of CVE-2023-2405519 and CVE-2023-3278420 for KeePass in May 2023. The successful vectors for these attacks have varied, including credential stuffing end users, targeting developers via vulnerable software, vulnerabilities in the product itself, phishing, memory issues, and cryptographic failures. In other words, password manager companies are just like all other companies, and they make mistakes.
As long as passwords still exist (more on that in a moment), credential stuffing will represent a reliably scalable way to test a breached identity against different IdPs. Therefore, password reuse remains a significant risk in its own right, so the question boils down to which of these risks is harder to control: risk of a compromise via a password manager, or a compromise because of password reuse?
Ultimately, the risk around a password manager breach can be reasonably controlled by pairing the encryption it uses with a PKI-based MFA solution. We would argue that the risk of managing three or four hundred distinct identities without reusing passwords is significantly greater. Therefore, despite the demonstrable attacker focus and high-publicity breaches in the recent past, password managers are still important while passwords are around.
[back to top]
Passkeys To Replace Passwords?
Recently there has been a push toward the adoption of passkeys instead of passwords. Passkeys operate on the same principle as FIDO2-based multi-factor authentication, in that they use the WebAuthn protocol to accomplish a cryptographically signed authentication flow. The main differences are that they are not usually used with another credential pair in an MFA situation, and they are not necessarily bound to specific hardware like an MFA token. Passkeys can be thought of as using the cryptographic challenge part of a WebAuthn MFA process, but as the only factor. This is why the FIDO alliance has recommended the terms “synced passkeys” for what we’re calling passkeys and “device-bound passkeys” for the MFA tokens we were discussing earlier. Both types of passkeys require the IdP to issue randomized challenges based on the public key of the identity holder, which the identity holder’s system signs using the private key. Both prevent replay attacks due to the same origin policy and the randomized nature of the challenge.
Synced passkeys, as you might have deduced, can sync across devices via cloud-based platform accounts, which makes them significantly more portable and easier to use than device-bound passkeys.21 However, they do have one weakness compared with device-bound passkeys, which is that they are still susceptible to phishing during transfer to another device.22 In this scenario, a user could phish a platform account and initiate a sync to get the private key.
Given attackers’ evolution to defeat nearly all types of MFA, passkeys are still significantly better than passwords and codes via SMS. Our view is that synced passkeys represent the near future of authentication for end users and customers for whom low friction is paramount. Device-bound passkeys, with or without an accompanying password, are the best option for high-impact scenarios such as finance or employee authentication.
[back to top]
Recommendations
- Identity providers should employ an anti-bot solution to mitigate malicious automation such as credential stuffing. Even simple anti-bot solutions can mitigate the bulk of unsophisticated credential stuffing.
- Identity providers should implement multi-factor authentication based on public key cryptography such as FIDO2.
- Alternatively, identity providers should implement FIDO2-based passkeys.
- Identity providers who are not in a position to implement PKI-based authentication should implement MFA approaches in which OTPs are appended to passwords to limit the amount of information attackers can gain.
- All organizations, even those using MFA, should take steps against malicious automation to prevent attackers from validating credentials and then using MFA bypass techniques to go the final step.
- For identity providers who do not implement passkeys, end users with sensitive data should adopt password managers and protect that identity with PKI-based MFA.
- Identity providers in high-impact scenarios such as finance should verify individual transactions (not merely authenticate users) with MFA, including from aggregator traffic.
- Identity providers should route third-party traffic, such as that from aggregators, to dedicated APIs and authenticate third-party traffic using a federated approach, such as OAuth 2.0 or SAML.
- Organizations should monitor and analyze traffic to establish baselines (including authentication and account creation success rates) and identify both malicious and nonaligned actors (such as aggregators).
- Passwords stored by the password manager should be long, randomized strings. A nice, overkill guideline could be 32-character random strings for passwords, or max length if the IdP has length restrictions.