Updated Feb 7, 2024:
This report has been updated following the discovery of some data contamination in the original analysis. The broad findings of the report remain the same, though the specific values for some industries have been adjusted.
Introduction
This is the first of a series of reports tracking the amount of unwanted automation observed against F5 bot defense customers in different industries. Data used in this report is from customers around the world but is heavily skewed towards North American customers. The report also includes the tracking of long-term automation trends for each of these industries. Such long-term trend data is helpful for security teams in the various industries as they protect their applications. Security practitioners can tell whether their experience is in line with peers in their industry, as well as identify ways in which they can improve their security posture to make their organizations less attractive targets for unwanted automation.
This initial report is focused on the first half of 2023 with deep dives into particular industries and flows. A flow is defined as an application or API function e.g. Login, Sign Up, Search, Shop etc. These are functions that a given endpoint allows users to perform. The report is not meant to be a comprehensive review of all flows across all industries, but aims to cover the most common industries and flows. Over time the list of industries and flows may be adjusted in response to audience feedback, so feel free to reach out should you like specific data added to this report.
Automation Overview
Automation by Industry
Figure 1 below gives an overview of the average proportion of unwanted Web and Mobile API automation observed for the first half of 2023 across 13 industry verticals. Overall, automation levels ranged from 0.2% Mobile API automation on Insurance companies to 42.1% against the Healthcare industry’s Web applications.
The difference between levels of automation on Web vs Mobile is a bit harder to explain. Some industries see higher levels of Web automation while others see higher levels on Mobile. Sometimes the difference in automation may be driven by a difference in functionality available between the web and mobile applications. For example, it may be easier to accomplish certain functions on the mobile app, or specific functionality may only be available via the website. The trend we are seeing has been an increasing proportion of automated attacks coming via the Mobile channel over time. This trend continues even in industries where the majority of attacks are still on Web. As more industries adopt modern application architectures and move towards APIs, we expect this trend to continue as APIs are more structured and easier for attackers to work with.
Though there are fluctuations from month to month (as shown in Figure 2 below), there are some strong patterns in the proportion of unwanted automation by industry. There are several factors that affect how much automation we see on a given enterprise and by aggregation in a given industry:
Value – What is the payout of using automation against the given enterprise? What kinds of money, stored credit cards, gift cards, miles, points, discounts, services etc. can be stolen from hacked accounts? i.e. what is the payout of success?
Security – How well defended are enterprises in this sector? Do they have large security budgets and teams? How long will it take for fraudulent activities to be detected i.e. what is the probability of success?
Risk – what is the probability of being identified and what are the consequences if identified?
Deterrence (length of protection) – How long have strong defenses been in place? Have existing anti-bot defenses successfully mitigated and deterred attackers? (New Bot Defense customers tend to have higher automation percentages than those that have been protected for longer. The mix of new and old customers in each industry may also impact the industry automation overview in Figure 1, though this impact will decrease over time.)
Using this simple factor list, we can explain why the Telecoms industry is one of the most attacked: the value of the payout from taking over an account is very high. Telecomsaccounts allow hackers to steal new phone upgrades and get brand new smart phones. They can also take over and port phone numbers to other devices, circumventing phone based 2FA used by banks and other high value targets. This makes Telecoms companies very desirable targets, even if they have very large security budgets and teams. Given the consolidation in the Telecoms industry, the match rate of stolen credentials is bound to be high as most adults have a Telecoms account with one of a handful of providers, compared to the tens of thousands of credit unions.
On the other end of the percentage automation spectrum are credit unions. These tend to have smaller user bases and smaller average account balances than some of the larger banks. The probability of matching a list of stolen credentials against a small 50 thousand member credit union is much lower than matching against a 50 million customer international bank. Not only is the probability of credential matches higher with larger banks, but the value sitting in the accounts is also higher. This makes credit unions smaller targets despite the perception that they are likely to have weaker security, smaller budgets, and smaller security teams. Contrary to this perception, credit unions typically outsource a lot of services including security to larger organizations that use their scale to bring best in class security to what would otherwise be small and poorly secured credit unions. This combination of low value, low probability of success and outsourced security makes credit unions a less desirable target for bots.
Industry Trend Analysis
Web
Figure 2 below gives the June year to date (YTD) trend in Web automation (%) for the 13 industries highlighted in Figure 1 above. The image legend is sorted from highest to lowest automation (%) based on June 2023 numbers for ease of reference.
From January to April 2023, Healthcare had the highest levels of unwanted Web automation. However, this automation saw a significant decrease in May 2023 before rebounding in June. The Hospitality industry has seen a steady increase in automation starting off as the eighth most targeted industry in January 2023 with 11.7% automation. This peaked in June 2023 when Hospitality which was the second most targeted industry with 30.5% automation, coinciding with the summer travel season. Credit unions, despite being one of the least targeted industries throughout the first half of 2023, saw a marked rise in attacks during June 2023, increasing from 1.2% automation in May to 6.8% in June.
It is hard to explain a lot of these fluctuations as they are often influenced by large events like sales or major marketing events (e.g., Black Friday, Cyber Monday, back-to-school, Memorial Day), summer holiday travel, mergers and acquisitions, changes in applications and security posture, breaches and credential leaks. They can also be influenced by less obvious factors, such as a new advanced persistent threat actor targeting a specific industry, a new automation tool or technique, or an increase or decrease in underlying enterprise base for that industry. This data is therefore meant to be directional, and to allow security teams to see if their experience is indicative of wider industry factors or is unique to their own enterprise.
Table 1 below gives the raw numbers used to create Figure 2.
| Industry | Jan | Feb | Mar | Apr | May | June |
| Healthcare | 44.90% | 50.90% | 44.30% | 45.10% | 27.30% | 40.20% |
| Hospitality | 11.70% | 14.80% | 18.70% | 16.80% | 24.70% | 30.50% |
| Telecom | 24.80% | 20.90% | 22.00% | 26.10% | 27.50% | 25.30% |
| Airline | 19.70% | 22.00% | 16.90% | 21.70% | 17.70% | 17.60% |
| Grocery | 21.30% | 19.10% | 32.10% | 17.40% | 32.20% | 16.30% |
| Fashion | 21.10% | 23.00% | 18.90% | 17.70% | 24.10% | 16.00% |
| eCommerce | 14.80% | 33.90% | 19.60% | 12.30% | 21.60% | 15.00% |
| Entertainment | 7.60% | 7.80% | 14.00% | 15.30% | 19.00% | 9.80% |
| Credit Union | 1.10% | 2.30% | 1.10% | 1.10% | 1.20% | 6.80% |
| State / Local Gvt | 3.30% | 4.10% | 22.30% | 12.30% | 6.80% | 6.40% |
| QSR | 16.50% | 10.00% | 12.40% | 5.40% | 5.90% | 4.70% |
| Bank | 3.80% | 3.80% | 6.40% | 7.60% | 4.30% | 3.30% |
| Insurance | 1.00% | 5.50% | 0.90% | 1.30% | 2.00% | 2.30% |
Table 1. The data behind Figure 2, showing automation rates by industry, January - June 2023.
Mobile
The June 2023 YTD trend for Mobile API automation (%) is shown in Figure 3 below. There is a clear divide between the top 4 targeted industries on Mobile API (Entertainment, Fashion, Airline, and Telecoms) and the rest. Entertainment and Fashion in particular consistently showed significantly more automation on their Mobile APIs than all the other industries.
Entertainment on Mobile is by far the most targeted over the half year with over a quarter of Mobile API traffic against Entertainment companies being unwanted automation. The Entertainment industry includes many of the online streaming and cable companies. This industry has seen a significant increase in bot activity over the last two months of H1 2023 reaching 42.9% and 45.5% automation in May and June 2023 respectively. This is more than four times the proportion of automation the same industry sees on Web. A lot of streaming is done via mobile devices and architectures have been designed to optimize for that. Attackers have also seemingly moved to predominantly target these APIs.
The Healthcare industry saw a significant increase in Mobile API automation in March 2023 due to a series of large automated Mobile attacks against customers in this sector. Automation rose from 0.1% in February to 21.4% in March 2023. Once these attacks died down, the automation level for April returned to 0.3%.
| Industry | Jan | Feb | Mar | Apr | May | June |
| Entertainment | 43.60% | 35.50% | 41.96% | 34.93% | 42.87% | 45.48% |
| Fashion | 3.20% | 24.00% | 13.60% | 14.02% | 16.33% | 17.47% |
| Airline | 4.30% | 5.40% | 1.24% | 6.63% | 3.40% | 9.63% |
| Telecom | 11.40% | 5.10% | 6.58% | 13.92% | 5.35% | 7.67% |
| Grocery | 2.50% | 5.90% | 4.69% | 0.64% | 0.56% | 1.42% |
| Hospitality | 1.20% | 1.20% | 1.03% | 1.30% | 1.22% | 1.35% |
| QSR | 0.60% | 0.60% | 0.72% | 1.64% | 1.24% | 1.11% |
| eCommerce | 1.90% | 2.00% | 8.63% | 1.18% | 1.73% | 0.63% |
| Bank | 0.70% | 1.80% | 0.97% | 0.19% | 0.33% | 0.55% |
| Healthcare | 0.70% | 0.60% | 21.42% | 0.31% | 0.87% | 0.33% |
| Credit Union | 1.30% | 1.00% | 0.29% | 1.85% | 0.38% | 0.19% |
| Insurance | 0.10% | 0.10% | 0.14% | 0.14% | 0.14% | 0.12% |
Table 2. The data behind Figure 3, showing mobile API automation rates by industry, January - June 2023.
Automation by Flow
A flow is defined as an application or API function e.g. Login, Sign Up, Search, Shop etc. These are functions that a given endpoint allows users to perform. Different kinds of flows therefore attract different kinds of attackers, e.g. Login attracts credential stuffing and account takeover, while Product Search attracts scrapers and Shop flows attract sneaker and other reseller bots. A list of definitions for the flows included in this report have been provided in the appendix. Figure 4 below shows an overview of Web and Mobile API Automation (%) by flow for the first half of 2023.
Figure 4 is ordered in decreasing order of average unwanted automation % across both Web and Mobile. The Search flows (that are most targeted by Web scrapers) have the highest levels of unwanted automation with 22.1% of all Web traffic to these flows being from automated scrapers. Scrapers tend to be significantly more active on Web than on Mobile APIs. Shop flows (which include add to cart, checkout, shipping etc.) experienced the second highest percentage of unwanted automation during the period. 19.0% of Web and 7.5% of Mobile API Shop transactions were unwanted automation. This shows evidence of the prevalence of reseller bots against Shop flows. F5 Labs recently wrote an article series on these kinds of bots, including two case studies showcasing this activity. The article series can be found on the Reseller Bots Article page. Quote flows are the third most targeted, with most automation against this flow being against Insurance quote flows.
Giftcard flows are fourth. These include all flows related to giftcards like buy, load credit, check balance, add to account, pay with giftcard, etc. Giftcards are as good as money and are vulnerable to a number of automated attacks, including but not limited to:
- Giftcard cracking – guessing of gift card numbers and PINs.
- Giftcard theft – Stealing of giftcards stored in victim accounts that have been taken over.
- Giftcard fraud – buying giftcards using proceeds of other fraudulent activities.
- Money laundering – using giftcards as a means of laundering illicit cash
All these use cases lend them well to the use of automation and will show up as high levels of automation against gift card related flows.
All the way at the other end of the spectrum, Account Originations (mainly opening of bank accounts and credit card applications) experiences low automation. This is mainly due to Know Your Customer (KYC) requirements put in place to prevent money laundering. These require all new account openings to supply verifiable identity information including names, dates of birth, addresses and social security numbers which are difficult for bots to acquire at scale. Content flows on content platforms are also low on the list of flows targeted as this kind of automation is very difficult to monetize unlike taking over user accounts and cracking gift cards which have a clear path to monetization.
Figure 5 below provides a heatmap showing which combinations of industries and flows receive the most automation for the month of H1 2023. The color coding goes from yellow for low levels of automation (%) to purple for higher levels.
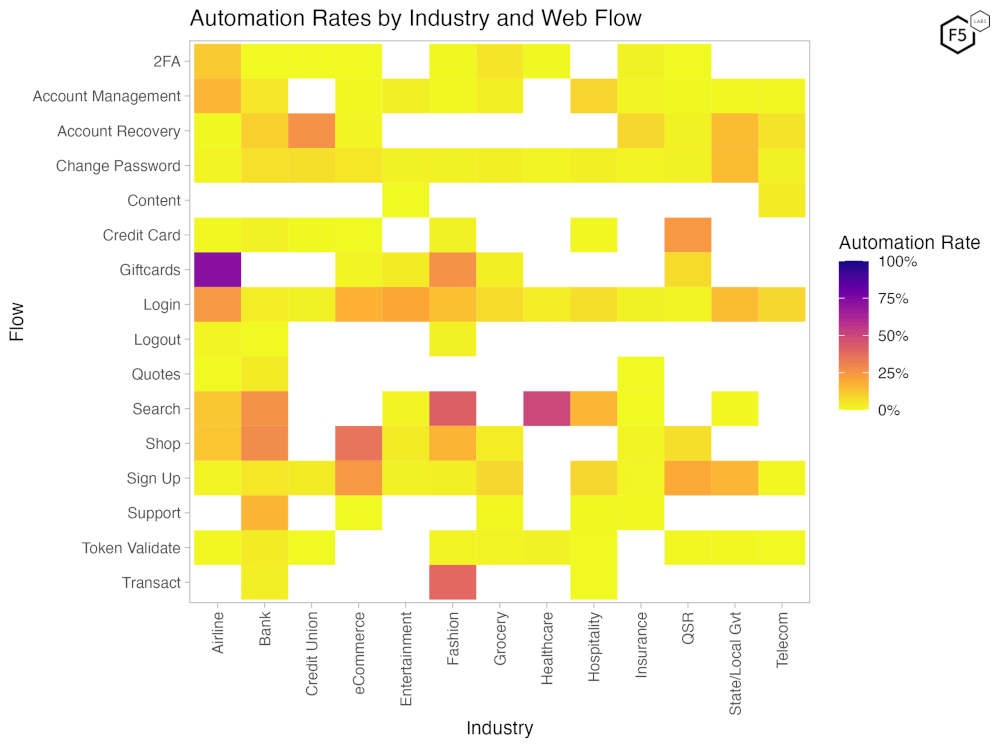
Figure 5. Heat map showing automation rates by flow and industry for the first half of 2023. Yellow values are low automation and purple values approach 100% automation. Blank spaces represent industry/flow pairs with insufficient data.
The highest levels of automation (%) were observed on Giftcard and Search flows. This automation comes from giftcard bots and scrapers respectively. Giftcards across Airlines, Entertainment and Fashion retail are heavily targeted by giftcard cracking bots that try to guess giftcard numbers and PIN codes. Login is heavily targeted across most industries as credential stuffing attacks try to take over user accounts using stolen credentials.
What might be surprising for many is that the Support flow, which includes the “contact us” forms or support ticket systems for banks, is among the most targeted by unwanted automation. This automation ranges from vulnerability scanning bots attempting to inject code into the support forms, to spam bots that fill ticketing queues with nonsense requests, or complaints or hacktivist messaging.
What Normal Login Success Rates Look Like
A simple way to try and estimate how much credential stuffing or automation you are getting on your login flows is to look at the login success rate. This article from F5 Labs contributor Jarrod Overson highlights how important it is to keep an eye on the average login success rate as an indicator for unwanted automation or account takeover activity. Central to this approach is knowing what the expected average login success rate should be for your enterprise. This is hard to estimate as there is no objective source of truth. Historical data (even the ones with the highest historical success rates) may still include significant amounts of unwanted automation. This rate is also very industry dependent and varies significantly from one to the next. This makes it hard to find credible sources of this information. To aid with this, F5 Labs will be publishing average human/legitimate login success rates by industry. These are shown in Figure 6 below for the month of May 2023.
As highlighted in Figure 6 above, the highest legitimate human login success rates are for the Finance Industry (Credit Unions and Banks). This makes sense because:
- These are accounts that are very valuable, hence users are less likely to forget their login credentials.
- Accounts are accessed with high frequency, reducing chances of forgetting or mistyping passwords that are entered frequently.
- Credentials are more likely to be saved into password managers or autocompleted by browsers due to regular usage.
- These accounts typically have very short time outs and users even in the same session may be logged out after several minutes of inactivity. This causes users to have to login a lot and hence are more likely to successfully do so.
The lowest average success rates in this list were for Grocery, Hospitality and State and Local government industries, which tend to be low for two different sets of reasons.
Grocery
- Sessions tend to be extremely long with users seldom being asked to reauthenticate after the first login both on Web and Mobile. As a result, many users will have forgotten their credentials when they eventually have to authenticate.
- Low success rate, especially on Mobile, due to credentials not being stored in the browser (like on Web); when a new app has been installed and is being used to log in for the first time, users are often unable to recall their password.
- This is seen as a lower tier of account and users do not use the same strong passwords and do not take as much effort to remember these passwords as the cost of forgetting it is minimal.
Hospitality and State and Local Government
- The infrequency of needing to access these accounts for most users results in them forgetting their passwords and having to reset them. There is also some turnover of users as people move in and out of states.
- There are several state login systems that may not share credential information leading to confusion on the part of users as to which credentials to use on a given State site vs another.
- This is seen as a lower tier of account and users do not use the same strong passwords and do not take as much effort to remember these passwords as the cost of forgetting it is seen as minimal.
Conclusions
The first half of 2023 was typical from a bot stats perspective. Entertainment and Fashion are the most targeted industries on Mobile APIs while Healthcare, Hospitality and Telecoms were the most targeted on Web. Healthcare saw a surge in automated Mobile attacks in March 2023. The year-to-date trend analysis shows general stability with occasional large fluctuations for some industries on Web and on Mobile APIs. Though it is difficult to provide explanations for the long-term trend, it is helpful for security teams to keep an eye on the numbers for their industry to help decipher whether their experience is indicative of an industry trend or something unique to their enterprise.
The view of automation by Flows shows that Search, Shop and Quote flows are the most targeted by high volume Web scrapers. These tend to be well funded, resourced and persistent bots. The second group of highly targeted flows are Giftcard flows that are targets for reseller and giftcard bots. Login success rates are a good way of keeping an eye on potential credential stuffing and account takeover activity. The human login success rates vary by industry for a number of reasons, and average human login success rates by industry and Platform (Web vs Mobile API) were provided to assist security teams in knowing when their experience falls out of line with industry standards which may be indicative of credential stuffing and other automated account takeover activity.
Recommendations
- Conduct an inventory of flows that require protection from bots to ensure that nothing is left out.
- Examine your traffic ahead of time to establish baselines for typical behavior. Analyze authentication success rates and anomalous traffic (such as hundreds of thousands of requests from a single system) to compare with industry benchmarks.
- Use an anti-bot solution to mitigate malicious automation once you determine that you have a problem.


