Introduction
This year we are releasing our 2019 Application Protection Report as a series of short, tightly focused episodes. This helps ensure we provide timely threat intelligence that our readers can add to their own threat models and use to prepare appropriate defenses and responses. Last episode (/content/f5-labs-v2/en/labs/articles/threat-intelligence/application-protection-report-2019--episode-1--sensor-networks-r.html), we focused on PHP’s continuing run as one of the great weak points on the Internet. We also dived into the details of a widespread and unsophisticated reconnaissance campaign against PHP database targets.
This week we explore the world of data breaches, examining patterns across sectors, breach causes, and impacts. Our analysis is based on U.S. state-level breach notifications that organizations (or their lawyers) are legally obligated to provide whenever personally identifiable information under their control is exposed either to attackers, or to the public. Data in this form have some limitations—most specifically that these are legal documents, not technical ones, and lawyers often include only the legally obligated minimum amount of detail in order to protect their clients. Furthermore, the obligation to report varies from state to state. Some states mandate reporting for breaches involving their citizens, while others require reporting for any organization that “does business” in their state. Nevertheless, the legal underpinning for these notifications also means that they are the closest thing we have to verifiable and comparable breach data.
For the 2018 report, we reviewed 384 breaches in 2017 across four states: California, Idaho, Oregon, and Washington. Most U.S. states require that victims be notified of data breaches, but at the time, only a few states’ attorneys general collected and shared breach letters on their websites. Because California, Washington, Idaho, and Oregon represent more than 16% of the U.S. population, we felt this was still a sufficiently large sample size to allow us to draw some broader conclusions about what’s going wrong.
For this year’s report, we looked at 761 breaches reported in 2018 across 10 states representing 21.4% of the U.S. population: California, Washington, Wisconsin, Vermont, New Hampshire, Iowa, Maryland, Oregon, Idaho, and Delaware. Here are the conclusions we drew.
Top Threats
Last year, we found that two threat vectors—code injected form-jacking and phishing—had become significant and growing problems.
In our 2018 report (which analyzed data gathered in 2017), we found that payment card skimming via injection was the single greatest threat to applications. These attacks are injection attacks that exploit local web application vulnerabilities to load payment card software-skimmers (sometimes referred in breach reports as malware) into unsecured payment entry forms. Attacks of this type constituted 21 % of the total set of breaches we analyzed, and included many of the most significant injection-based breaches of that year. Most of the compromised payment forms and shopping cart applications ran on PHP; additionally, we found that PHP exploit attempts made up 58% of the total attack traffic observed in 2017 by Loryka sensors.
Phishing and other access control attacks were the second greatest threats, representing 14% of all breaches that we analyzed last year. As 2018 went on we found that phishing campaigns were growing in prevalence and sophistication (/content/f5-labs-v2/en/labs/articles/threat-intelligence/2018-phishing-and-fraud-report--attacks-peak-during-the-holidays.html), so it was no surprise to see that for this past year, phishing actually surpassed injection: phishing was responsible for 21% of breaches with a known root cause, whereas injection for payment card skimming was responsible for about 12%.
Specific exploits and tactics may shift slightly, but it looks as though the two weakest points on the internet—people and PHP-based payment card forms—are set to retain their unenviable crowns.
Sorting breaches by cause
As noted above, breach notification letters usually lack technical detail. Unfortunately, 13% of breach letters in 2018 did not attribute a specific cause, including the four largest breaches by number of exposed records. We cannot use these breach notifications to reach definitive conclusions, but we can at least organize them into categories by cause to get a sense of overall trends, if not specific diagnoses. Here are the significant breach cause categories as we found them, with our notes in parentheses:
Access-related breach causes included
- Email (yes, we also found this annoyingly vague)
- Phishing which resulted in access to email (no other details noted)
- Phishing to gain access to login credentials
- Social engineering by email to gain access (yes, this is probably the same as phishing)
- Brute forcing of credentials
- Credential stuffing
- Stolen access credentials (possibly from a phish?)
- Access credentials stolen from a third party (could be related to credential stuffing)
- Social engineering by telephone to gain access credentials (“Hi, I'm the county password inspector.”3)
Web breach causes included
- Web app code injection attacks (aka the form injection / Magecart / skimmer malware)
- Web hacking (no other details noted)
- Web application hacking
Accidental breach causes included
- Sending information to unintended recipients (wrong attachment or wrong receipent)
- Lost/stolen/misplaced physical assets (mostly laptops in cars)
- Access misconfigurations that allowed unauthorized access
Physical security breach causes included
- Physical infiltration (mostly burglary and laptops stolen out of cars)
- Point-of-sale device attacks and the placing of physical skimmer devices
Insider breach causes included
- Malicious data exfiltration
- Intentional misconfiguration/sabotage (more on this (/content/f5-labs-v2/en/labs/articles/cisotociso/intentionally-insecure--poor-security-practices-in-the-cloud.html))
- Insiders at trusted third parties that abuse their authorized access
Malware breach causes included
- Any use of malware to manipulate or gain control of remote systems
- Ransomware attacks (which triggers a breach notification in some venues)
Third-party hacked refers to specific incidences where a cyber-related breach at a third party led to unauthorized access to organizational data.
Phishing (no other details given) are cases where phishing was mentioned but it was not clear whether the phishing was used to obtain access credentials, or to drop malware.
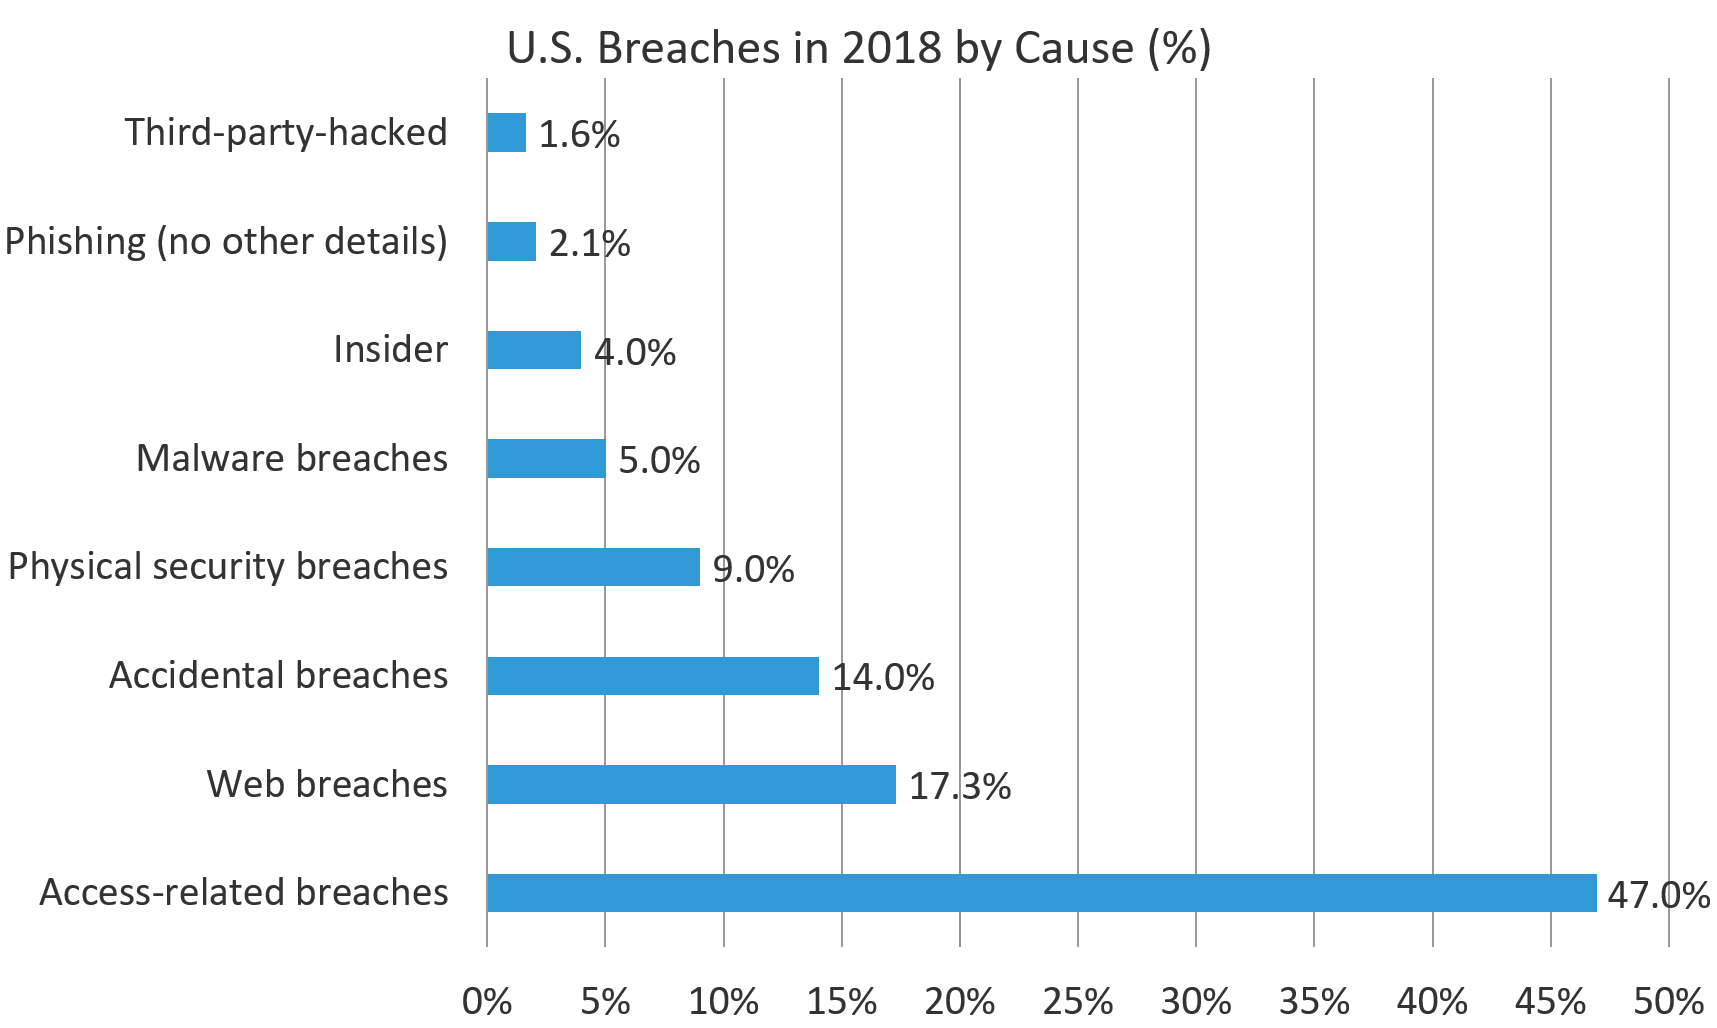
Figure 1 shows the distribution of causes of U.S. breaches in 2018, by breach count. The lack of detail in the breach reports means that there is partial overlap between many of these categories.
We found that access-related breaches constituted the largest proportion by far of the known breach causes, at 47%. The subcategories within access-related breaches obviously have significant overlap, but all of them are reducible to either one form or another of social engineering (as in the case of phishing) or credential theft. This is partly a reflection of the strength of other technical controls: if it were easier to circumvent authentication completely, we would not see so many attackers getting through this way. As it stands, this year’s real breaches show humans and their access structures remain one of the weakest point to applications.
Industry Profiles
While the lack of details in the dataset prevent us from identifying more specific trends, we were able to group the breaches into two rough target/vector profiles that corresponded to the two most common breach causes identified above.
Industry profile 1 – Organizations that accept payment cards on the web
One of the profiles we identified was a pattern of industry sectors with a high rate of compromise through payment form injection. The retail sector, which relies heavily on ecommerce transactions, had a disproportionately high rate of compromise by injection, with 72% of attributable breaches coming from that vector. Similar industries, such as manufacturing and technology, also tended to be breached this way. The public sector also had a high incidence of successful injection attacks, probably due to the prevalence of the Click2gov exploit that haunted local government and utility sites in 2017 and 2018.1
In short, for organizations that accept credit cards for online payment, payment form injection attacks such as Magecart are a significant risk and specific controls must be put into place to prevent and monitor for these attacks. We’re going to dive much deeper into this attack (and controls to mitigate it) in a future article.
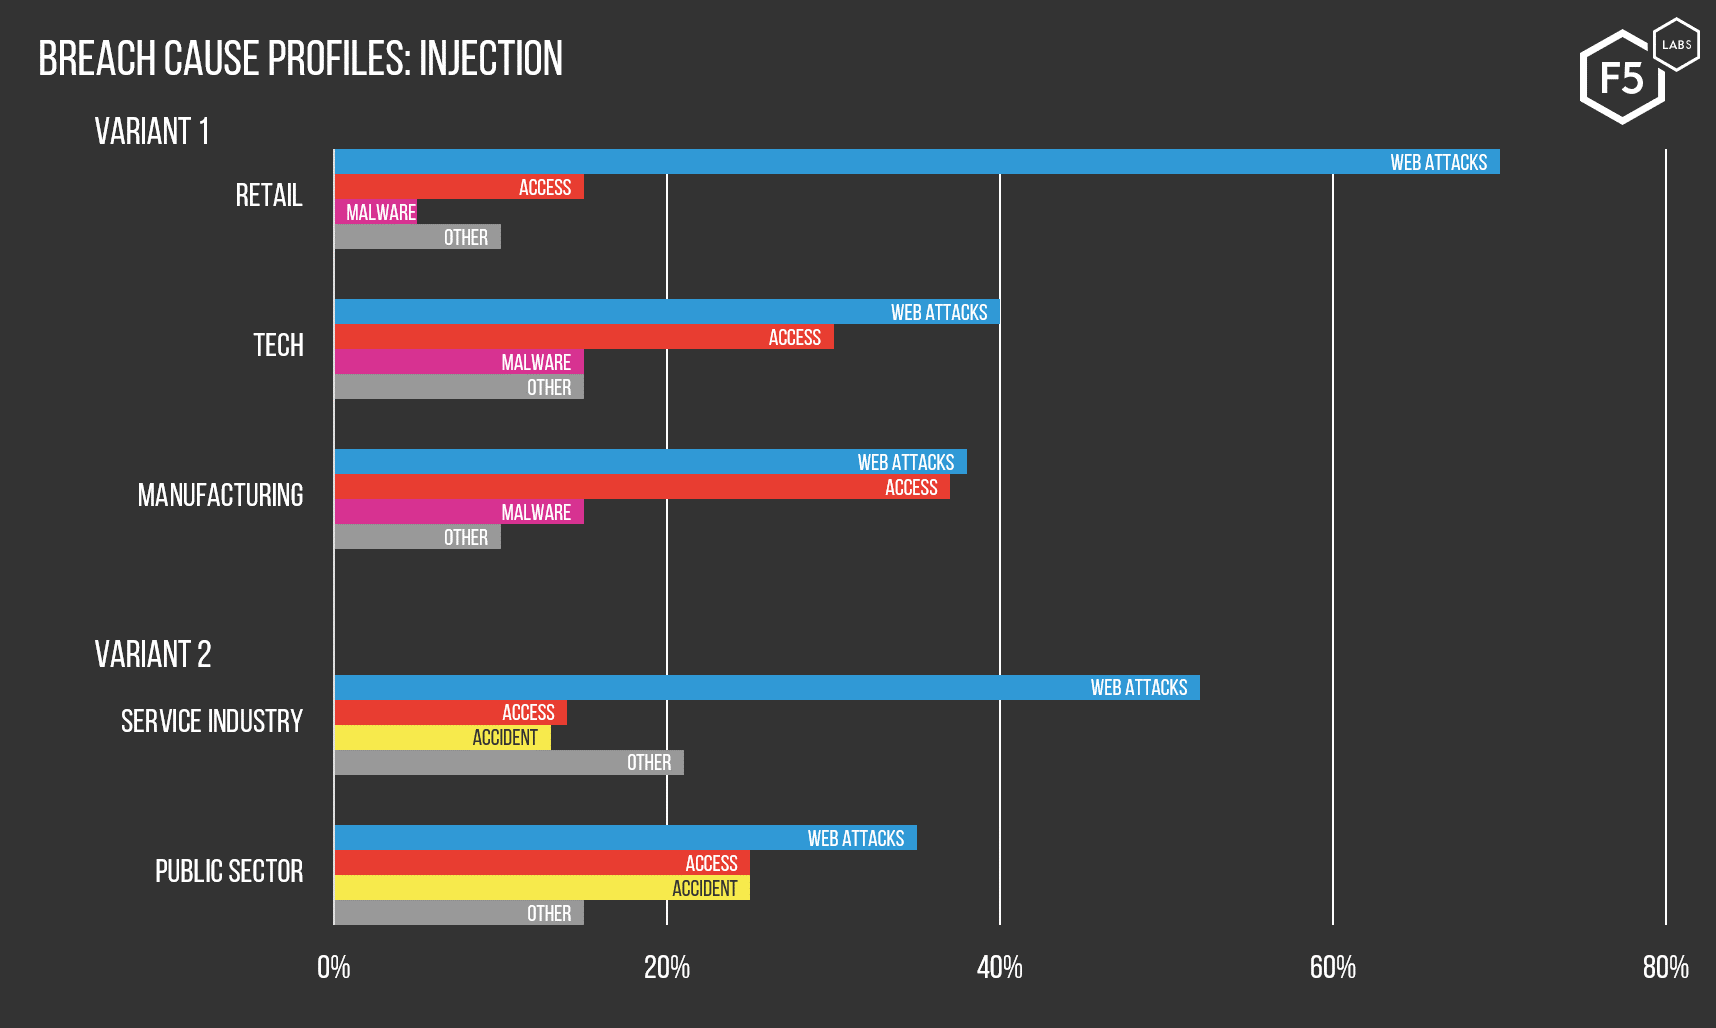
Figure 2: These charts show the various industries that were most likely to experience a data breach through injection, and the subtle variations in the historical likelihood of injection breaches versus other causes per sector.
Industry profile 2 – Organizations with identity data usable for fraud
The other profile we identified centers on organizations in the finance, health, education, non-profit, and accounting sectors that were significantly more likely to be compromised through phishing or illicit email access. This profile split on the second and third most frequent breach vectors, with malware and insider threats playing a bigger role in the accounting sector and accidents or physical breaches more prevalent in finance, health, education and non-profit. However, all sectors in this profile were disproportionately likely to experience a breach through phishing or other email breaches.
In many of these cases, the breach notification letter mentions how unauthorized parties (the attackers) were able to find unencrypted personal information within the organization’s email caches. Of course, most security policies explicitly prohibit users from storing data of this nature within their email boxes for exactly this reason, but as we are seeing, it happens quite a bit. We’re also going to dive much deeper into this attack (and controls to mitigate it) in a future article.
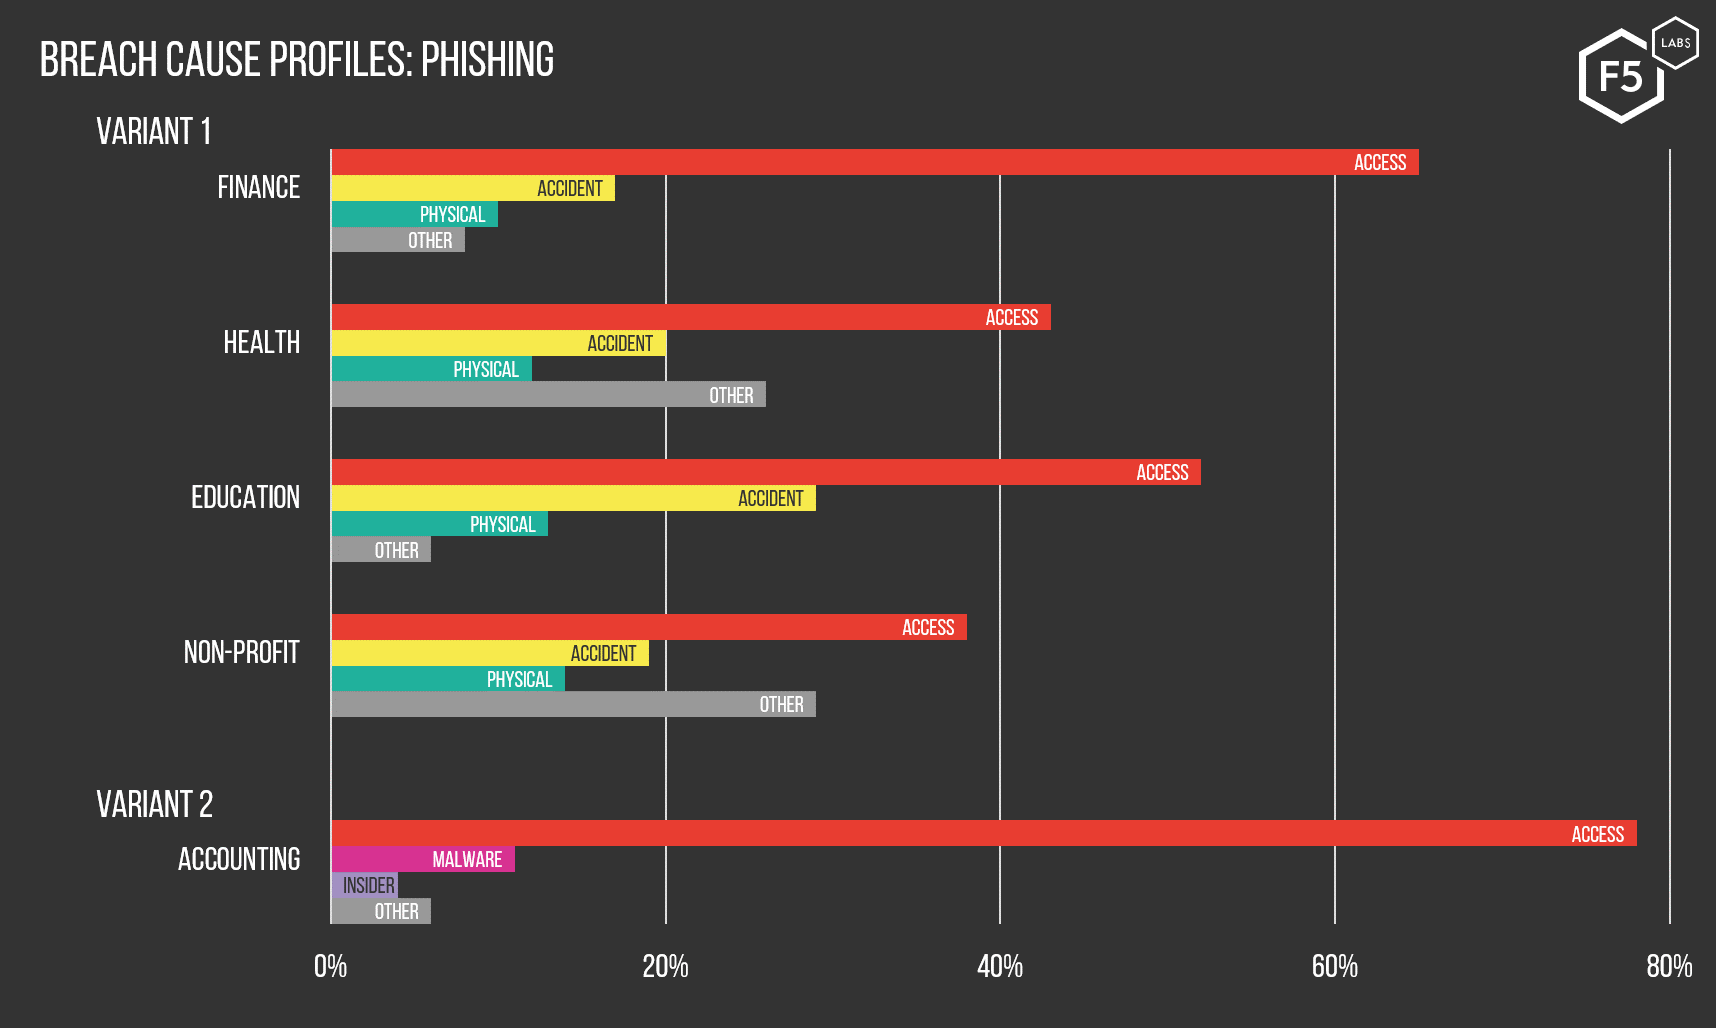
Figure 3: These charts show the various industries that were most likely to experience a data breach through phishing, and the subtle variations in the historical likelihood of phishing breaches versus other causes.
What does this all mean?
These trends make sense from the standpoint of how organizations in different sectors tend to store and transmit valuable assets. For sectors whose business models emphasize ecommerce, the ecommerce applications themselves represent a path to the goods that is relatively direct and unimpeded unless otherwise controlled. It is no surprise that the initial Magecart campaigns were directed against Magento storefronts. Magento runs on PHP, which, as we’ve seen, continues to present rich targets (/content/f5-labs-v2/en/labs/articles/threat-intelligence/application-protection-report-2019--episode-1--sensor-networks-r.html) to attackers.
By contrast, organizations in the second profile, coming from industries such as finance, healthcare, and education, can afford to store sensitive assets far from web front-ends. Getting to the good stuff on such networks usually entails complex, multi-stage attacks that require an initial foothold – which is almost always what phishing and email breaches provide. While it is certainly possible to find valuable information in email (and we saw some breaches happen this way in 2018), data exfiltration from human-structured data such as email is usually laborious and only worth the effort for small, value-dense data, such as intellectual property or political communications. For large-scale, profit-minded attacks, email is often just the first step in a broader campaign to reap PII (Personally identifiable information), PHI (Protected health information), or PFI (Personal financial information).
Conclusions
Although open source data about actual breaches are not rich in detail, they do tell us enough to conclude that the most likely threat vector depends on where and how organizations store assets that malicious actors want. If, by dint of their business model, ecommerce-oriented organizations have to store PFI close to their application front ends, those front ends are going to become a focus for attacks, as they have in the various shopping cart campaigns we’ve seen over the last few years. If organizations store their valuables elsewhere on their networks, then social engineering and escalation of privileges are the order of the day—hence the phishing campaigns.
There are a few broader conclusions that we can draw from these data, which, for all their flaws, are valuable specifically because they are as empirical as data get in the security industry. For example, we can cross reference these empirical findings with the OWASP Top 10. Injection is the number one issue in the OWASP Top 10, and has been continuously since 2010. The breach data from 2018 confirm its ongoing relevance in the wild, despite being a known and solvable problem for many years.2 At the same time, broken access control is ranked fifth by OWASP, but it featured in nearly half of the 2018 breaches we examined.
We believe that this disparity stems not from any issue with OWASP’s work or methods (which are enormously valuable), but from the bigger questions around what an application really is (spoiler: it’s an onion (/content/f5-labs-v2/en/labs/articles/cisotociso/apps-are-like-onions--they-have-layers.html)). Applications are not just the code that they execute, but also everything around them that makes them tick: architecture, configuration, other assets to which the application connects, and—not least—the user population. In other words, there are things that have little to do with the narrow definition of a web application that can have huge effects on that application’s security. The prevalence of access attacks like phishing in the breach reports are a good reminder of this bigger context. Cross-referencing our findings to the OWASP Top 10 is therefore a sign that we need to understand applications both at the level of the individual components that comprise them, and at the larger level of the entire environment in which humans use them. We will be returning to this fundamental question about how to conceptualize a web application more over the course of the entire application protection report series.
The other conclusion we can draw from the industry breach profiles is that, from what we can establish, actual breaches validate risk-based security programs instead of best practices or checklists. If we know that successful attacks map with some precision to where target organizations store sensitive assets, it follows that organizations need to tailor controls and architecture to reflect the threats they actually face. This supports our long-held assertion that risk assessment needs to be a cornerstone of any security program, and the first step in any risk assessment is a substantive (and ongoing) inventory process. We realize this seems like common sense, but given the obstinate gap between theory and practice (/content/f5-labs-v2/en/labs/articles/cisotociso/4-areas-where-infosec-facts-and-fiction-clash--mind-the-gap-pt--.html) in our industry, it bears repeating.


