
The Sensor Intel Series is created in partnership with Efflux , who maintains a globally distributed network of sensors from which we derive attack telemetry.
------------------------------------------------------------------------------------------
Introduction
Welcome back to the Sensor Intelligence Series, our recurring monthly summary of vulnerability intelligence based on distributed passive sensor data. August witnessed ructions among the 80 CVEs whose attack traffic we track. Several CVEs that had been ascendant or predominant plunged in attack traffic, which, oddly enough, restored our old favorite CVE-2020-8958 back to its place of honor at the top of the CVE pile. This is an OS command injection vulnerability in a Guangzhou fiberoptic router, and it has seen a huge amount of scanning and exploitation activity on our sensors in the last 18 months.
August Vulnerabilities by the Numbers
Figure 1 shows the traffic for the top 10 CVEs in August. Below CVE-2020-8958 is CVE-2022-24847, an RCE vulnerability in the open-source GeoServer software, followed by CVE-2022-42475, one of the Fortinet SSL-VPN vulnerabilities we added to our list in July. Also in the top 10 are four Microsoft Exchange Server vulnerabilities, a Citrix NetScaler Gateway injection flaw, and another router flaw, CVE-2017-18368.
Table 1 shows traffic for August, change in traffic from July, CVSS v3.x score, and EPSS scores for 64 CVEs. Our list of CVEs with confirmed attack or scanning traffic currently stands at 80, but 16 vulnerabilities saw no traffic in either July or August and so don’t make this table.
| CVE Number | August Traffic | Change from July | CVSS v3.x Score | EPSS Score |
| CVE-2020-8958 | 4019 | 201 | 7.2 | 76.4% |
| CVE-2022-24847 | 2616 | -261 | 7.2 | 0.1% |
| CVE-2022-42475 | 2118 | 196 | 9.8 | 46.0% |
| CVE-2022-22947 | 1863 | 379 | 10 | 97.5% |
| CVE-2017-9841 | 1692 | -3724 | 9.8 | 97.5% |
| CVE-2022-41040/CVE-2021-34473 | 1572 | -124 | 9.8 | 97.4% |
| CVE-2021-26855 | 1335 | 669 | 9.8 | 97.5% |
| CVE-2016-4945 | 976 | -3452 | 6.1 | 0.2% |
| CVE-2021-28481 | 699 | -281 | 9.8 | 4.4% |
| CVE-2017-18368 | 564 | 276 | 9.8 | 97.5% |
| 2018 JAWS Web Server Vuln | 557 | -325 | NA | NA |
| CVE-2018-10561 | 332 | -564 | 9.8 | 97.5% |
| NETGEAR-MOZI | 275 | -51 | NA | #N/A |
| CVE-2014-2908 | 274 | 12 | NA | 0.6% |
| Citrix XML Buffer Overflow | 267 | 8 | NA | NA |
| CVE-2020-25078 | 191 | -162 | 7.5 | 96.8% |
| CVE-2019-18935 | 168 | 1 | 9.8 | 91.2% |
| CVE-2021-40539 | 160 | -354 | 9.8 | 97.5% |
| CVE-2021-3129 | 136 | -1501 | 9.8 | 97.5% |
| CVE-2021-26086 | 117 | -54 | 5.3 | 94.4% |
| CVE-2017-1000226 | 107 | -56 | 5.3 | 0.1% |
| CVE-2021-22986 | 69 | -350 | 9.8 | 97.5% |
| CVE-2021-44228 | 77 | -48 | 10 | 97.6% |
| CVE-2022-35914 | 77 | 3 | 9.8 | 97.4% |
| CVE-2018-13379 | 72 | -40 | 9.8 | 97.5% |
| CVE-2021-26084 | 70 | -184 | 9.8 | 97.5% |
| CVE-2019-9082 | 64 | -1739 | 8.8 | 97.5% |
| CVE-2022-22965 | 60 | 32 | 9.8 | 97.5% |
| CVE-2013-6397 | 54 | -1243 | NA | 65.8% |
| CVE-2021-27065 | 22 | -131 | 7.8 | 93.6% |
| CVE-2022-1388 | 19 | -29 | 9.8 | 97.5% |
| CVE-2014-2321 | 16 | -68 | NA | 96.4% |
| CVE-2022-40684 | 10 | -14 | 9.8 | 96.8% |
| CVE-2020-3452 | 9 | -15 | 7.5 | 97.5% |
| CVE-2019-12725 | 7 | -44 | 9.8 | 96.5% |
| CVE-2018-17246 | 5 | 5 | 9.8 | 96.9% |
| CVE-2020-25213 | 5 | 4 | 9.8 | 97.3% |
| CVE-2021-25369 | 5 | 5 | 6.2 | 0.1% |
| CVE-2017-17731 | 4 | 4 | 9.8 | 14.0% |
| CVE-2018-7600 | 4 | 3 | 9.8 | 97.6% |
| CVE-2020-17496 | 4 | 3 | 9.8 | 97.5% |
| CVE-2020-17506 | 4 | 4 | 9.8 | 96.1% |
| CVE-2021-33357 | 4 | 2 | 9.8 | 96.8% |
| CVE-2023-25157 | 4 | 4 | 9.8 | 35.3% |
| CVE-2017-11511 | 2 | 2 | 7.5 | 33.2% |
| CVE-2017-11512 | 2 | 2 | 7.5 | 97.2% |
| CVE-2020-13167 | 2 | 2 | 9.8 | 97.4% |
| CVE-2020-9757 | 2 | 2 | 9.8 | 97.2% |
| CVE-2021-21985 | 2 | -10 | 9.8 | 97.5% |
| CVE-2017-0929 | 1 | 0 | 7.5 | 3.6% |
| CVE-2018-1000600 | 1 | 0 | 8.8 | 95.6% |
| CVE-2018-7700 | 1 | 1 | 8.8 | 73.2% |
| CVE-2019-9670 | 1 | 0 | 9.8 | 97.5% |
| CVE-2020-15505 | 1 | -467 | 9.8 | 97.5% |
| CVE-2020-28188 | 1 | 1 | 9.8 | 97.3% |
| CVE-2020-7796 | 1 | 0 | 9.8 | 72.5% |
| CVE-2021-3577 | 1 | 1 | 8.8 | 97.1% |
| CVE-2021-41277 | 1 | -2 | 10 | 96.0% |
| CVE-2022-1040 | 1 | 1 | 9.8 | 97.5% |
| CVE-2008-6668 | 0 | -1 | NA | 0.4% |
| CVE-2018-20062 | 0 | -3 | 9.8 | 96.8% |
| CVE-2020-0688 | 0 | -2505 | 8.8 | 97.3% |
| CVE-2021-21315 | 0 | -2 | 7.8 | 97.2% |
| CVE-2021-31589 | 0 | -1 | 6.1 | 0.3% |
Table 1. August traffic, change from July, CVSS and EPSS scores for 64 CVEs.
Targeting Trends
To better assess rapid changes in attack traffic, Figure 1 shows a bump plot, which plots both traffic volume and changes in rank. The 12 CVEs shown here represent the top five for each of the twelve months. In this plot the dramatic drop in traffic targeting CVE-2016-4945 (78% decline) and CVE-2017-9841 (69% decline) are immediately apparent. Less obvious is the fact that the curve for CVE-2020-0688 stops completely at July because we observed zero traffic targeting it in August. It is common for vulnerabilities to fluctuate widely but it is rare to see a vulnerability that had so consistently been targeted drop to zero. This view really emphasizes the moderate amount of traffic in August’s top five, illustrating how quickly CVE targeting trends can reverse.
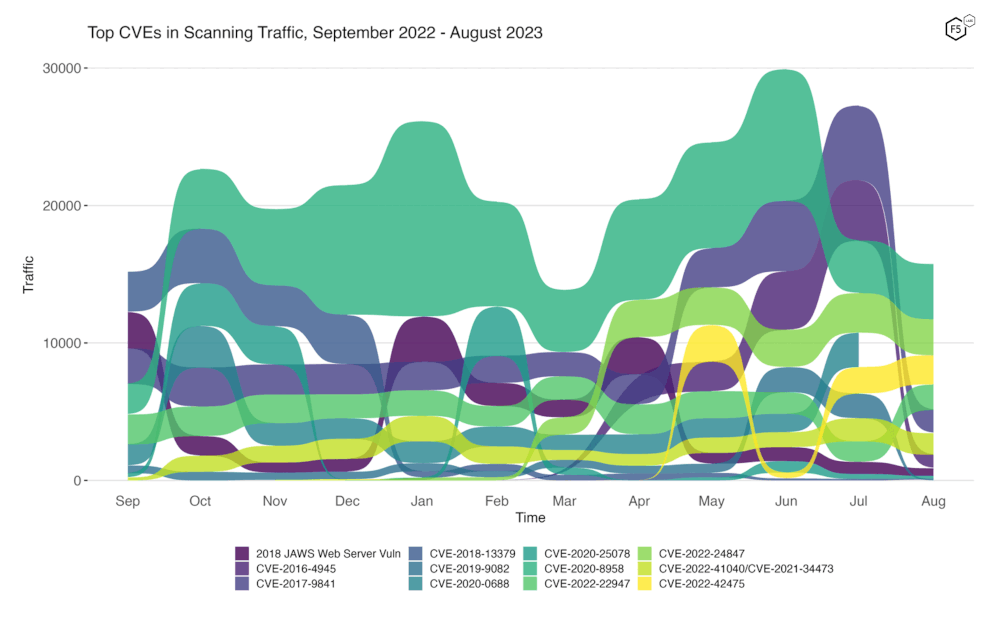
Figure 2. Evolution of vulnerability targeting trends over previous twelve months. The dramatic drop in traffic targeting several CVEs left CVE-2020-8958 back at the top, with the Geoserver RCE CVE-2022-24847 just behind.
Long Term Trends
Because Figure 2 only shows high-traffic CVEs, Figure 3 shows traffic for 79 out of the 80 CVEs we have tracked (one CVE hasn’t been targeted for more than a year and so isn’t shown in this plot). In this view several more CVEs that dropped precipitously become apparent. CVE-2019-9082 (an RCE flaw in ThinkPHP) dropped by 99%, from nearly 1800 requests in July to just 64 in August. CVE-2020-15505 (a MobileIron RCE) declined by 99.8% as well. We also noted that the critical Fortinet SSL-VPN flaw that came to our attention in July, CVE-2022-42475, stayed mostly steady compared with last month.
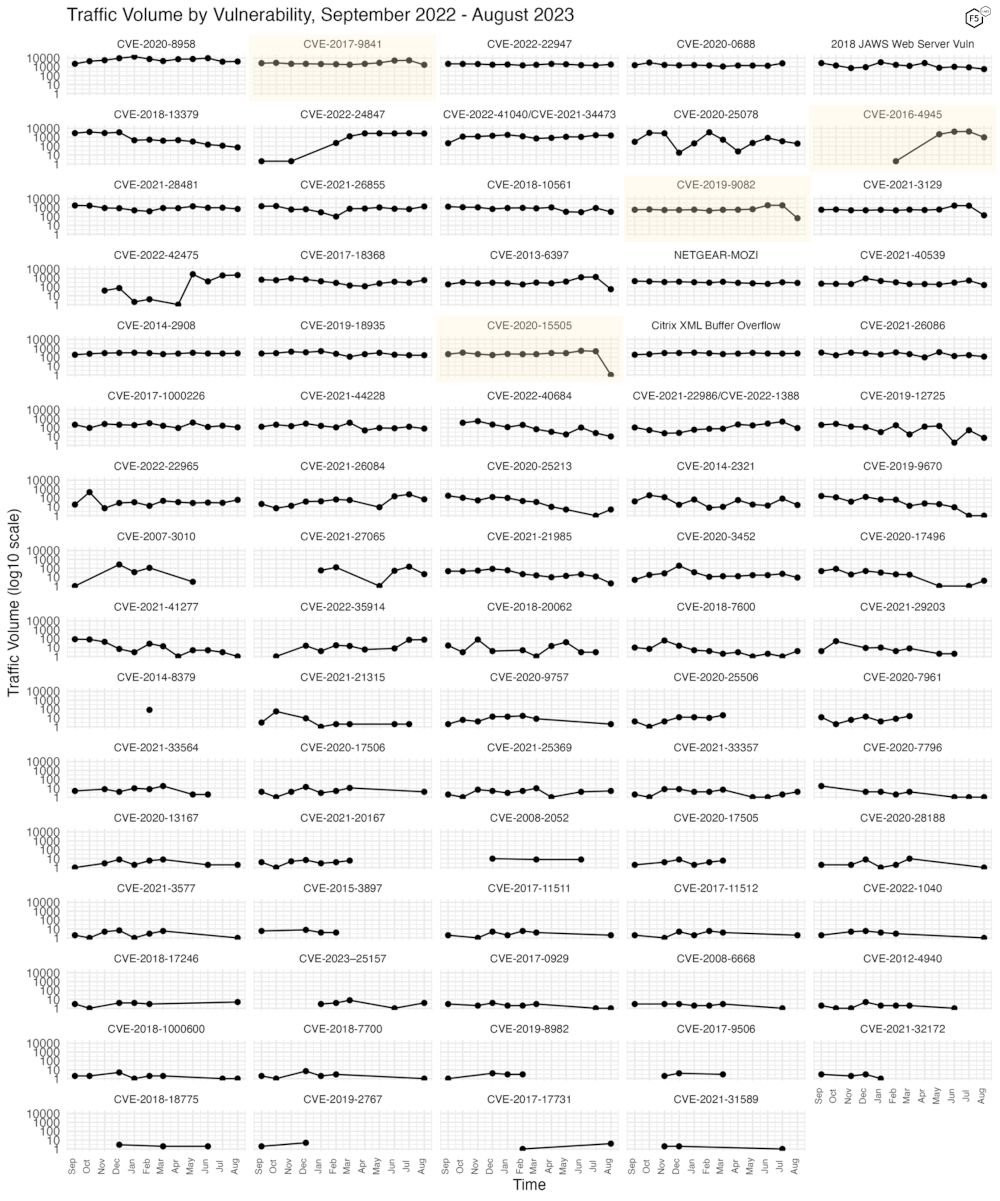
Figure 3. Traffic volume for the last twelve months for 72 tracked CVEs.
Conclusions
This month we were able to add seven newly observed CVEs to our list of confirmed exploited vulnerabilities:
- CVE-2012-4940, a directory traversal vulnerability in the Axigen Free Mail Server.
- CVE-2016-4945, a cross-site scripting flaw in Citrix Netscaler Gateway
- CVE-2017-11511 and CVE-2017-11512, arbitrary file download flaws at different URIs in the Zoho ManageEngine ServiceDesk tool
- CVE-2017-17731, a SQL injection vulnerability in DedeCMS.
- CVE-2022-35914, a code injection vulnerability in GLPI, the open-source IT asset management tool.
- CVE-2023-25157, a SQL injection vulnerability in GeoServer, an open-source server software for geospatial data.
In looking for patterns among this data we always have to consider that passive sensors like these tend to select for unsophisticated actors who are scanning for targets of opportunity, as opposed to threat actors who know exactly whom they want to attack. This means that when we identify patterns such as a focus on open-source software, Microsoft Exchange, or IoT vulns, we are always thinking about it in terms of commoditized, repeatable attacks, in the assumption that we probably won’t observe custom exploits, zero-days, and hands-on-keyboard activity with long attack chains. This automatically leads to more questions: is this combination of target and tactics, techniques and procedures trickling down from more sophisticated attacks? Or does this represent an attacker strategy completely removed from the more skilled end of the spectrum, where state-sponsored actors and top-tier cybercrime operators rub elbows?
Ultimately there are so many unknowns around the question of attribution and sophistication that we often end up going in circles, attributing observed methods to known actors and observed actors to known methods. Nevertheless, the question of low sophistication in our attack traffic is a question to which we continually return, and over time we hope to enrich this data with more observations that will shed more light on attackers' motivations and strategy.
Finally, just in case anyone reading this month’s article is brand new to the Sensor Intelligence Series, we will conclude by repeating some old but valid observations. We believe that the continuing attacker focus on vulnerable IoT devices like fiberoptic routers is a sign that attackers are looking for fresh devices to add to a botnet for DDoS attacks. In other words, scans for IoT devices are of concern not only to organizations with those devices, but to everyone, because those routers will only be used to create yet another attack. And with that, we’ll talk to you in October.
Recommendations
- Scan your environment for vulnerabilities aggressively.
- Patch high-priority vulnerabilities (defined however suits you) as soon as feasible.
- Engage a DDoS mitigation service to prevent the impact of DDoS on your organization.
- Use a WAF or similar tool to detect and stop web exploits.
- Monitor anomalous outbound traffic to detect devices in your environment that are participating in DDoS attacks.


