Known Exploited Vulnerabilities (KEV)
Exploit code is one thing but what about actual, honest to goodness, exploitation in the wild? This is a hard question to answer, as attackers are usually not gonna bother explicitly mapping their efforts to specific CVEs or broadcast what systems their efforts are targeting. However, our intrepid friends at Cybersecurity and Infrastructure Security Agency (CISA) have recently compiled a handy list of vulns they know to be exploited in the wild, though they are equally cagey about exactly how they know. All we know is that there is a published list of vulnerabilities that say “Yes, we know this is exploited”, so we treat it like our other data and have a look. See Figure 22.
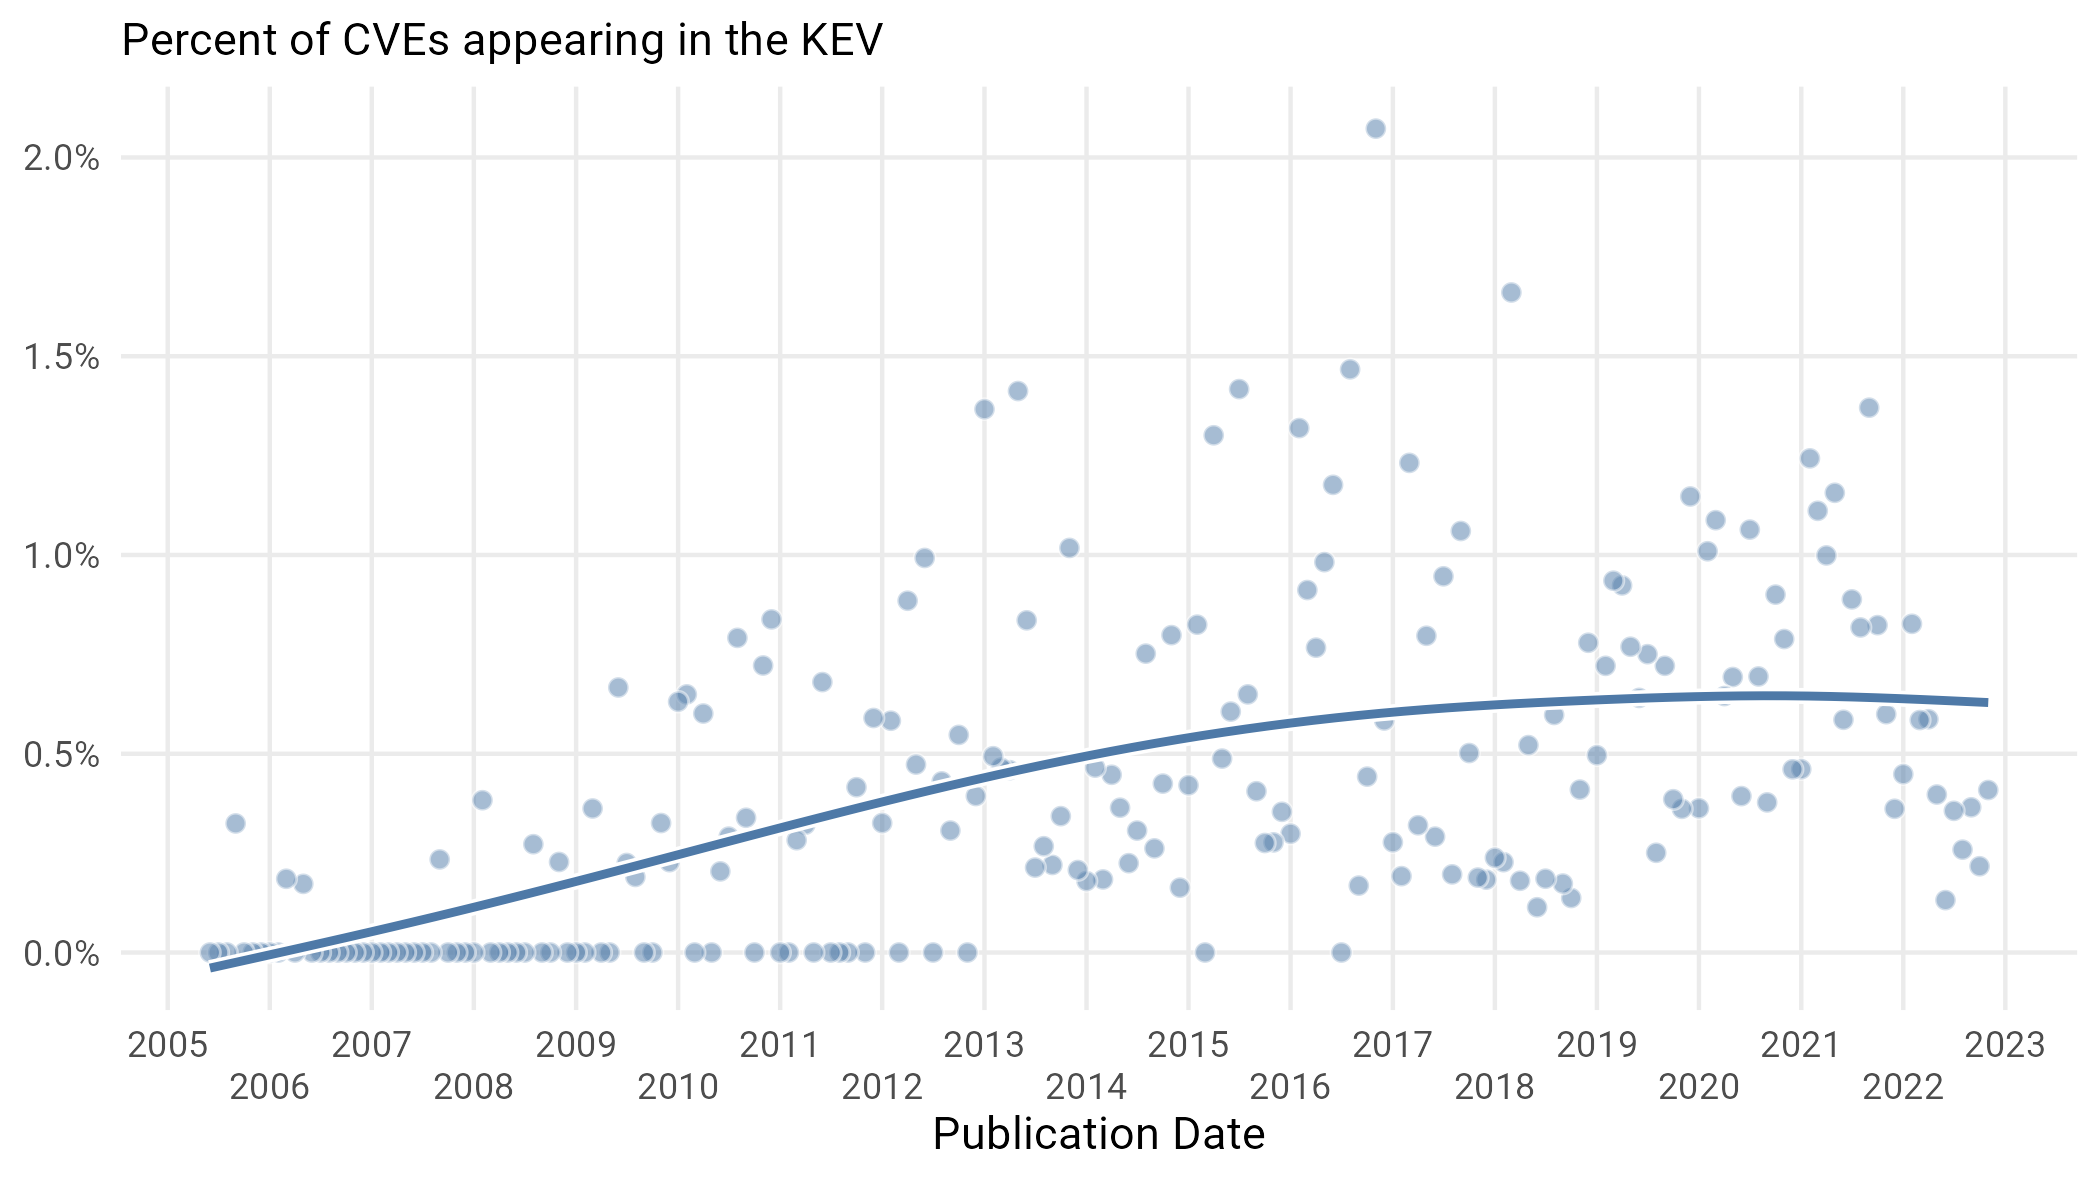
Figure 22: Percent of all CVEs published on a particular date that end up showing up in the KEV.
Given what we know about the increase in the total volume of published CVEs in the last few years, the steady (or more likely slowly increasing) average of 0.5% is maybe slightly less comforting than it would appear. This would be equivalent to a 17% increase in new CVEs on the KEV per month, creeping up to around 16 per month at the beginning of 2025. In other words, the number of distinct approaches that attackers are choosing from is constantly growing—certainly something that might end up overwhelming organizations.
Conclusion: Ask Not For Whom The Vuln Vulns…
Many of the findings in this study are inconclusive from the standpoint of defense. There are some patterns to what day of the week vulnerabilities are published but they aren’t set in stone. Similarly, it does not appear fruitful to try to predict the severity of new vulnerabilities, what kind of software flaws they will comprise, or exactly what weakness they will exploit. There are, however, two broader conclusions that are helpful for understanding the vulnerability landscape and its relationship to what we can do as defenders:
More vulnerabilities mean more opportunities for attackers, other things being equal. Throughout this study, the most conclusive findings are about the increasing release rate and absolute number of vulnerabilities. Since each new vulnerability represents a theoretically new component in an attack vector, and since old vulnerabilities never really go away, defenders will face an escalating number of distinct attack vectors. Our observation about the steady proportion of CISA KEVs masking the absolute growth of known exploited vulnerabilities highlights this fact. Thus, diverse opportunities for attackers will continue to grow.
The most urgent question facing CISOs today is not “will I be attacked?” (yes) or “when will I be attacked?” (today), but “how will I be attacked?” This means that the task of triaging new CVEs and prioritizing patches will become an increasingly significant part of security operations.
CVEs are not vulnerabilities—they are vulnerability communications. The reason so many of the findings are equivocal in terms of risk is that the process of publishing CVEs itself generates noise that has little to do with threats. Figures 11, 12, 13, 14, 15, 16, 18, 19, and 21 all show systems in which human vagaries like collection processes, changing schemas, and expert disagreement mask any sort of technical conclusions about vulnerabilities. On the surface, this is frustrating; hence, one purpose of the project was to better assess vulnerability risk. However, this is also useful to help understand exactly what a CVE is and how it is different from a vulnerability. CVEs are subject to all kinds of human variance because they represent a signal from one set of humans to another and not a software flaw. This might sound obvious, but recognizing what a CVE’s purpose really is also helps to understand what is really happening when one is published, which leads us to our next thought.
…it Vulns for Thee
As a vulnerability communication, the publication of a CVE marks the point that the vulnerable vendor shifts the responsibility of management onto its own customers, and rightly so: only the people administering the vulnerable systems can mitigate the flaw. Indeed, you can lead an administrator to a patch, but you can’t make them apply it. This also means that the publication of a CVE divides a customer base into two populations—those who patch and those who don’t. Upon publication, each of these groups will experience a distinct change in risk over time.
For organizations who patch, both the likelihood and the impact of a successful exploit go down (assuming an effective patch). At that point, the threat actors targeting them will have to choose between finding another vector or finding another target. But, for organizations that don’t patch, their risk changes in more complex ways. Publicizing the existence of a vulnerability means that attackers know about it, so the likelihood of exploitation will increase relative to pre-publication. This is also why we are steadfastly in the camp of “don’t disclose a vulnerability until a patch is available”1, but we’ll try not to stir that particular hornets’ nest here. Of course it’s not quite that simple, as publication also means the opportunity to put other controls in place, potentially mitigating risk while not applying a patch.
What’s the point of this pedantic discussion of the metaphysical nature of a CVE as vulnerability communication rather than the embodiment of a vulnerability itself? Mostly, it helps us contrast the world we have with what it would look like in the absence of CVE. Suppose those early efforts we described in our brief history fizzled out. The communication around vulnerabilities would be all that more difficult; “Hey did you hear about that Microsoft vuln?” “Which one, Bluekeep? DejaBlue? BlueFrag? EternalBlue?”. When we don’t even know what vulnerability we are talking about it’s hard to tell whether the danger they pose is actually mitigated. In a world with this type of uncertainty all vulnerabilities would start to feel like zero-days.
Of course it’s not only human-to-human communication that the CVE process makes easier, but it also allows tools to find, track, and mitigate vulnerabilities (sometimes automagically). As we are faced with what seems like an accursed flood of CVEs, these tools will be all the more critical. Therefore, publishing a CVE represents trading in a less predictable, foggy environment for one that is not only more predictable but also more easily managed. As messy and flawed as the CVE publication process is, it’s a whole lot better than not having one.
Explicitly understanding CVEs as published vulnerabilities changes the significance of their proliferation. Sure, we are collectively publishing more and more vulnerabilities every week (since 2017), but is that because vendors are creating more flaws, or because they are discovering, communicating about, and mitigating more flaws? The answer is likely both, and is unfortunately outside of the scope of this study. Viewed this way, however, the accelerating rate of CVEs does not look like such a problem; instead, it starts to look like a solution: putting more tools in the hands of defenders. It might be a messy, imperfect solution, but then it is a solution to a messy and tangled problem. Truly, the CVE vulns for thee: the defender.
Executive Summary & Key Takeaways
As security professionals, we often live and die by the release cycle of the latest vulnerabilities. In this report, sponsored by F5 Labs, we take a step back and examine the universe of vulnerabilities (defined by the CVE) and how it’s changed in the last 20 years. As you will see, we find some surprising things along the way.
- The CVE landscape has changed substantially in the last two decades, with an increasing number and widening variety of vulnerabilities
- Some of those changes are due to the evolution of technology while some are “genetically modified”, i.e., how data is collected has changed rather than the data itself
- The number of CVEs published is accelerating, and we expect 500 new CVEs to be published in a typical week in 2025.
- New vulnerability territory is being uncovered every day
- Growing number of vendors: vendors publishing their first CVE are increasing at a rate of 18% per year
- Growing diversity of flaws: the number of unique software flaws (CWEs) present in any month’s worth of new CVEs has increased from about 20 to more than 130
- Both new and old territory is being reformed
- The OWASP top 10 has shifted dramatically over time
- The diversity of weakness in software has increased
- The language used in CVE descriptions is changing with less of a focus on Actors and Outcomes, and more focus on Weakness and Requirements
- The severity of CVEs (as measured by the CVSSv3 score) is not increasing
- CVSSv3 has a higher average severity than v2
- BUT the average severity of each hasn’t increased in the last decade
- CNAs and NVD often disagree on the severity of vulnerabilities
- Exploit code and exploitation in the wild has changed
- Older vulnerabilities were likely (sometimes as high as 1/3rd!) to have exploit code in ExploitDB
- Newer vulnerabilities are more likely to have exploit code appear in GitHub, though at a much lower rate (~5%)
- The size of the CISA Known Exploited Vulnerability List continues to grow, both in total size and the percentage of all CVEs
Introduction
We’ve all been there. After a hard day defending networks against foes—real and imaginary alike—we try to take a break from the big screen and scroll a bit through social media on the little screen2. Then, we see it: that infosec influencer account with the weird eye avatar is posting about a new vulnerability. This one is gonna be big apparently; it affects widely used software and may even be remote executable. There might be proof of concept code available, or maybe it’s already being exploited. Details remain murky for the next few hours of refreshing all of our possible feeds until the CVE drops. Evaluate, cancel weekend plans, soothe C-Suite worries, put out the fire, and start again.
The pendulum swings between the monotony of defending our networks from threats aimed at the backlog of known vulnerabilities and the panic of addressing the next big name brand vulnerability. The monotony and the panic both tend to leave us with a myopic view of individual vulnerabilities, while the overall vulnerability landscape is just a background blur. In this report, sponsored by F5 Labs and completed by the Cyentia Institute, we want to take a step back and try to bring that landscape into focus, and ask a few questions about where we’ve been and where we are going.
In particular, we are going to focus on individual vulnerabilities as they are often at the nexus of our security thinking. Moreover, because of the heroic efforts of those in our community, vulnerabilities are relatively well cataloged via the Common Vulnerabilities and Exposures (CVE) process3 with numerous sources of data about them publicly available. We’ll use this open data to take a retrospective as well as prescient view of the landscape, providing deep, quantified answers to sticky questions such as:
- How fast is the number of vulnerabilities growing?
- What are the most common types of vulnerabilities?
- Are vulnerabilities more severe now than they were before?
- How many vulnerabilities actually have exploit code published?
- How has the language we use to talk about vulnerabilities changed?
We’ll give some answers to the above questions, but along the way, we’ll have to step lightly. The world is a complex place and the way data is collected has changed over time and depending on who exactly is doing the collecting. So we’ll point out the results we think are real bona fide trends, as well as those that are just artifacts of the data collection process. To that end, we’ll try to make some observations about absolutely weird things in the vulnerability landscape.
The Basics
Before we dive in and try to start to survey the wide, weird world of vulnerabilities, it’s worthwhile to pause for a moment to define exactly what we mean by “vulnerability”. For our purposes, a “vulnerability” means a flaw that has a CVE ID assigned to it. We acknowledge that this is not the full universe of vulnerabilities, but it’s the easiest set to analyze and the one most often used4. Given that we are focusing on the CVE, let’s start with some definitions and examine the history of the CVE as well as a brief overview of some of the data fields from which CVEs are constructed.
Glossary
- Common Vulnerability and Exposures (CVE) A framework developed at the MITRE corporation for organizing information around computer vulnerabilities.
- Common Weakness Enumeration (CWE) A framework developed at the MITRE corporation for hierarchically organizing the types of software flaws that lead to vulnerabilities. CWE information is included in a CVE.
- OWASP Top 10 A subset of CWEs, published by the Open Web Application Security Project (OWASP), and deemed by it to be the most critical security vulnerabilities.
- Common Platform Enumeration (CPE) A framework developed, again, at MITRE corporation, that enumerates all possible software versions that are affected by a vulnerability, including the type, vendor, product, and version of software affected.
- CVE Number Authority (CNA) An entity that is bestowed with the power to publish new CVEs.
- Common Vulnerability Scoring System (CVSS) A method for assessing a vulnerability's severity.
- Known Exploited Vulnerabilities (KEV) A list of CVEs published by the United States Department of Homeland Security indicating vulnerabilities that are actually being used in the wild.
A Brief History of the CVE
We are not historians here at Cyentia, and so we don’t claim this to be a definitive history of the CVE5. But we do want to highlight some of the important waypoints visited to get to where we are today. One major theme is that the socio-technical process of creating a framework that fits everyone’s use case is a complex one, and it often takes a long time before the stakeholders arrive at something everyone can agree with, or at least not disagree with.
The idea for a framework for gathering information about vulnerabilities was first presented at the 2nd Workshop on Research with Security Vulnerability Databases in January of 1999 by Dave Mann and Steve Christey. Because the question of how to share information about vulnerabilities requires broad community buy-in, a working group was formed to create a more formal framework. Approximately nine months later6, the first CVE list was birthed into the world in September of 1999 with a mere 321 vulnerabilities. My, how things have grown (over 190k have been published since then!); we are now at nearly 200k.
In the early days, there was a lot of necessary wrangling to get buy-in from various different parts of the community (MITRE, vendors, industry practitioners, and governments). The result of this wrangling was that while the MITRE CVE list grew, another database using the CVE framework with a slightly different mission came into existence: the Internet Category of Attacks Toolkit (ICAT)7. ICAT was a NIST project headed by Peter Mell8. Early versions of the ICAT were cheeky, leaning into the “CAT” in ICAT (Figure 1).
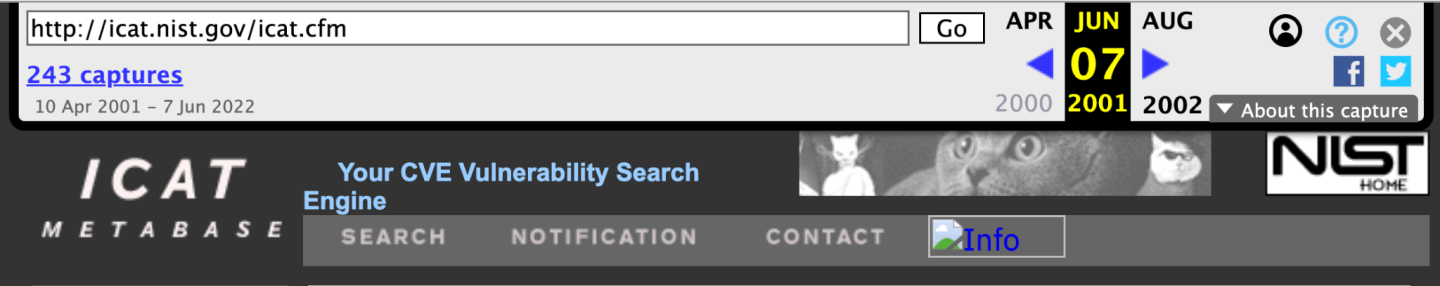
Figure 1: An archived screenshot of the ICAT website from June 8, 2001. Note the use of proto-meme cat pictures in the upper right-hand corner.
In order to strike a delicate balance to keep all the stakeholders happy, the MITRE CVE list stayed just that, a list with the CVE-ID, a short description, and links to references. Meanwhile, the ICAT was able to expand and provide more information and functionality, including search. Today, they are funded by the same source, the US Department of Homeland Security, but are maintained as two separate and distinct programs.
The next few years were fraught with danger for ICAT (while MITRE’s CVE list kept chugging along). Funding from NIST ran out in 2001, but the then-director of SANS, Alan Paller, funded students to analyze the actual vulnerabilities. In 2004, DHS decided to fund ICAT, and the development of the renamed National Vulnerability Database (NVD) was started. The NVD launched in May 2005, and things have grown in size and complexity since then. Without delving into too much detail, here are some milestones taken directly from NVD:
- CVSSv2 is adopted in 2007
- Common Product Enumeration (CPE) is revised to a more recognizable form in 2008, though the full dictionary won’t be incorporated into NVD until 2011
- NVD-specific Common Weakness Enumeration (CWE) views are first introduced in 2007, with revisions in 2016 and 2019
- In 2016, CVE Number Authorities (CNAs) were introduced, allowing software companies and other organizations to define their own CVEs and lighten the load on MITRE and NIST
How the Size of the CVE Landscape Has Grown
One of the first mathematical concepts everyone learns is counting, and even as data scientists we find that counting can be one of the most informative activities we can engage in. As we mentioned in the previous section, the initial MITRE CVE list had a mere 321 vulnerabilities. It’s worth asking what the current state is and how fast that number is growing.
We’d like to add a programming note here: we are going to primarily use the NVD for our data rather than other sources of CVEs. Why? Well, primarily because the NVD is well organized, consistent, publicly and easily available, and does not greatly differ from other sources. While you might be inclined to quibble (I can hear it now…“I know CVE-2014-OMGWTFBBQ was published by MITRE 32.6 hours before it was on NVD and, therefore, all your conclusions must be wrong!”), try not to miss the forest for the trees. Wherever we can, we’ll identify where the data might be biased towards NVD’s particular worldview.
Vulnerabilities Published Per Week
As of December 31, 2022, there were 190,971 vulnerabilities published in NVD. In recent weeks, this has meant hundreds of new vulnerabilities every week. When does a CVE actually become a CVE? Here, and throughout this report, we will refer to a CVE’s publication date, that is, the date that NVD (and usually MITRE) officially recognized the CVE and placed it in the database. We note we only examine published CVEs and do not consider “Reserved” (or “Rejected” or any of the other members of the zoo of MITRE tags) CVEs, i.e., those CVE numbers that a CNA has set aside for potential future use. Only honest-to-goodness published CVEs for us.
So how has the number of CVEs published per week9 grown? Take a gander at Figure 2.
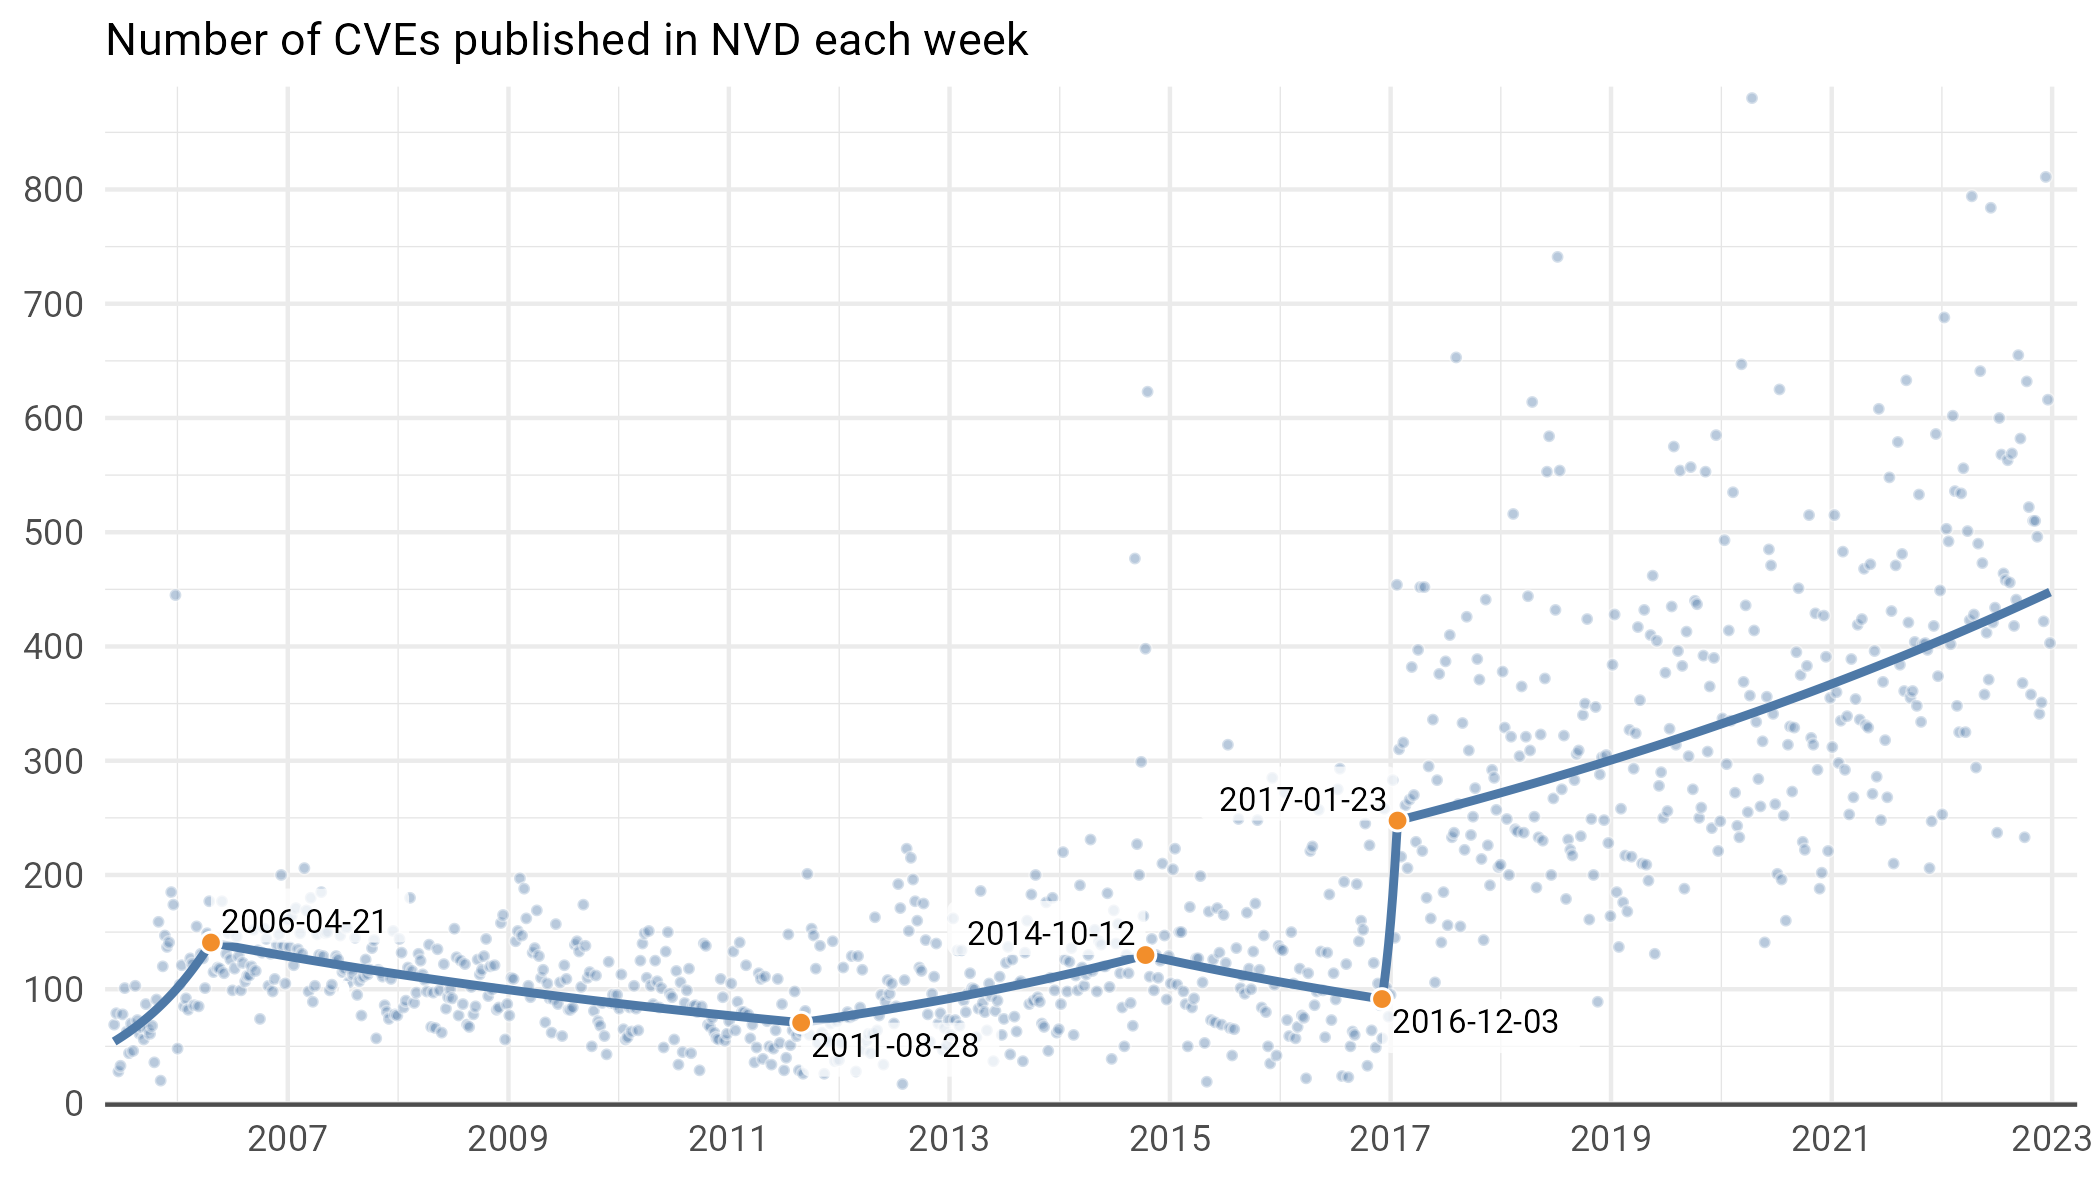
Figure 2: Weekly CVEs over time (each point represents a week). The red line here is a segmented linear model. It’s a straightforward linear regression (though we do so on the logarithm of the weekly count) with breakpoints selected by fancy algorithms to best fit the data.
We see a number of distinct eras of CVE growth and decline over the years. After the birth of the NVD in 2005, we saw nearly a year of rapid growth culminating around US Tax Day in 2006. Then, there was a slow but steady decline in the weekly rate for five years, until August 2011, followed by a period of slow growth until October of 2014, with another slow decline until December of 2016. Once the CNA process began to take off in early 2017, the number of CVEs has steadily increased. In particular, weekly CVE publication rates are growing at about 10% per year. By 2025, this implies we’ll be typically seeing 547 new CVEs a week with some weeks topping out with as many as 1,250. Yikes!
Weird Thing 0: Days of Many Vulnerabilities
You might be looking at Figure 2 and saying: “Wait a second, what are all those points that are way higher than any of the others?” Well, that leads us to weird thing number 0, which is that the CVE process is strange , and the way the CVE framework is set up sometimes means a single type of vulnerability gets a lot of CVEs.
For example, in the late summer and early fall of 2014, someone noticed that there were a lot of Android applications that didn’t do a great job handling their public key HTTPS certificates. As a result, during the weeks of September 7, 2014, October 12, 2014, and October 19, 2014, new CVEs were published for each and every Android app that made this particular certificate mistake. Each CVE had a near-identical description that read “<apk> for Android does not verify X.509 certificates,” resulting in several hundred new CVEs per week at a time when only around 100 was typical. A similar spike occurred around Christmas in 2005, when a huge slate of new SQL injection and XSS attacks were published across a large variety of applications.
We point this out because it demonstrates something that we’ll see throughout the rest of the report. Sometimes weird or dramatic observations are a result of data collection and the framework used to collect data rather than some sort of actual trend. This was, in fact, well covered by one of the original CVE authors, Steve Christey, in a talk he gave at the BlackHat conference in 201310. If we hadn’t dug into the mechanisms behind those spikes, we might have concluded that those weeks were particularly dangerous; in actuality, however, it was really one vulnerability copied and pasted across many Android apps (including those such as “Grandma’s Grotto,” a rudimentary gluten free cooking app; see CVE-2014-6968).11
Yeah, But Which Day of the Week?
We chose the weekly aggregation of Figure 1 for a reason, namely that the number of CVEs published on any given day (the finest level of time granularity we have) fluctuates quite a bit. From a response-vs-nice-weekend standpoint, however, you might be wondering exactly what day of the week you are likely to be inundated with new vulnerabilities. Well, wonder no more, and look at Figure 3.
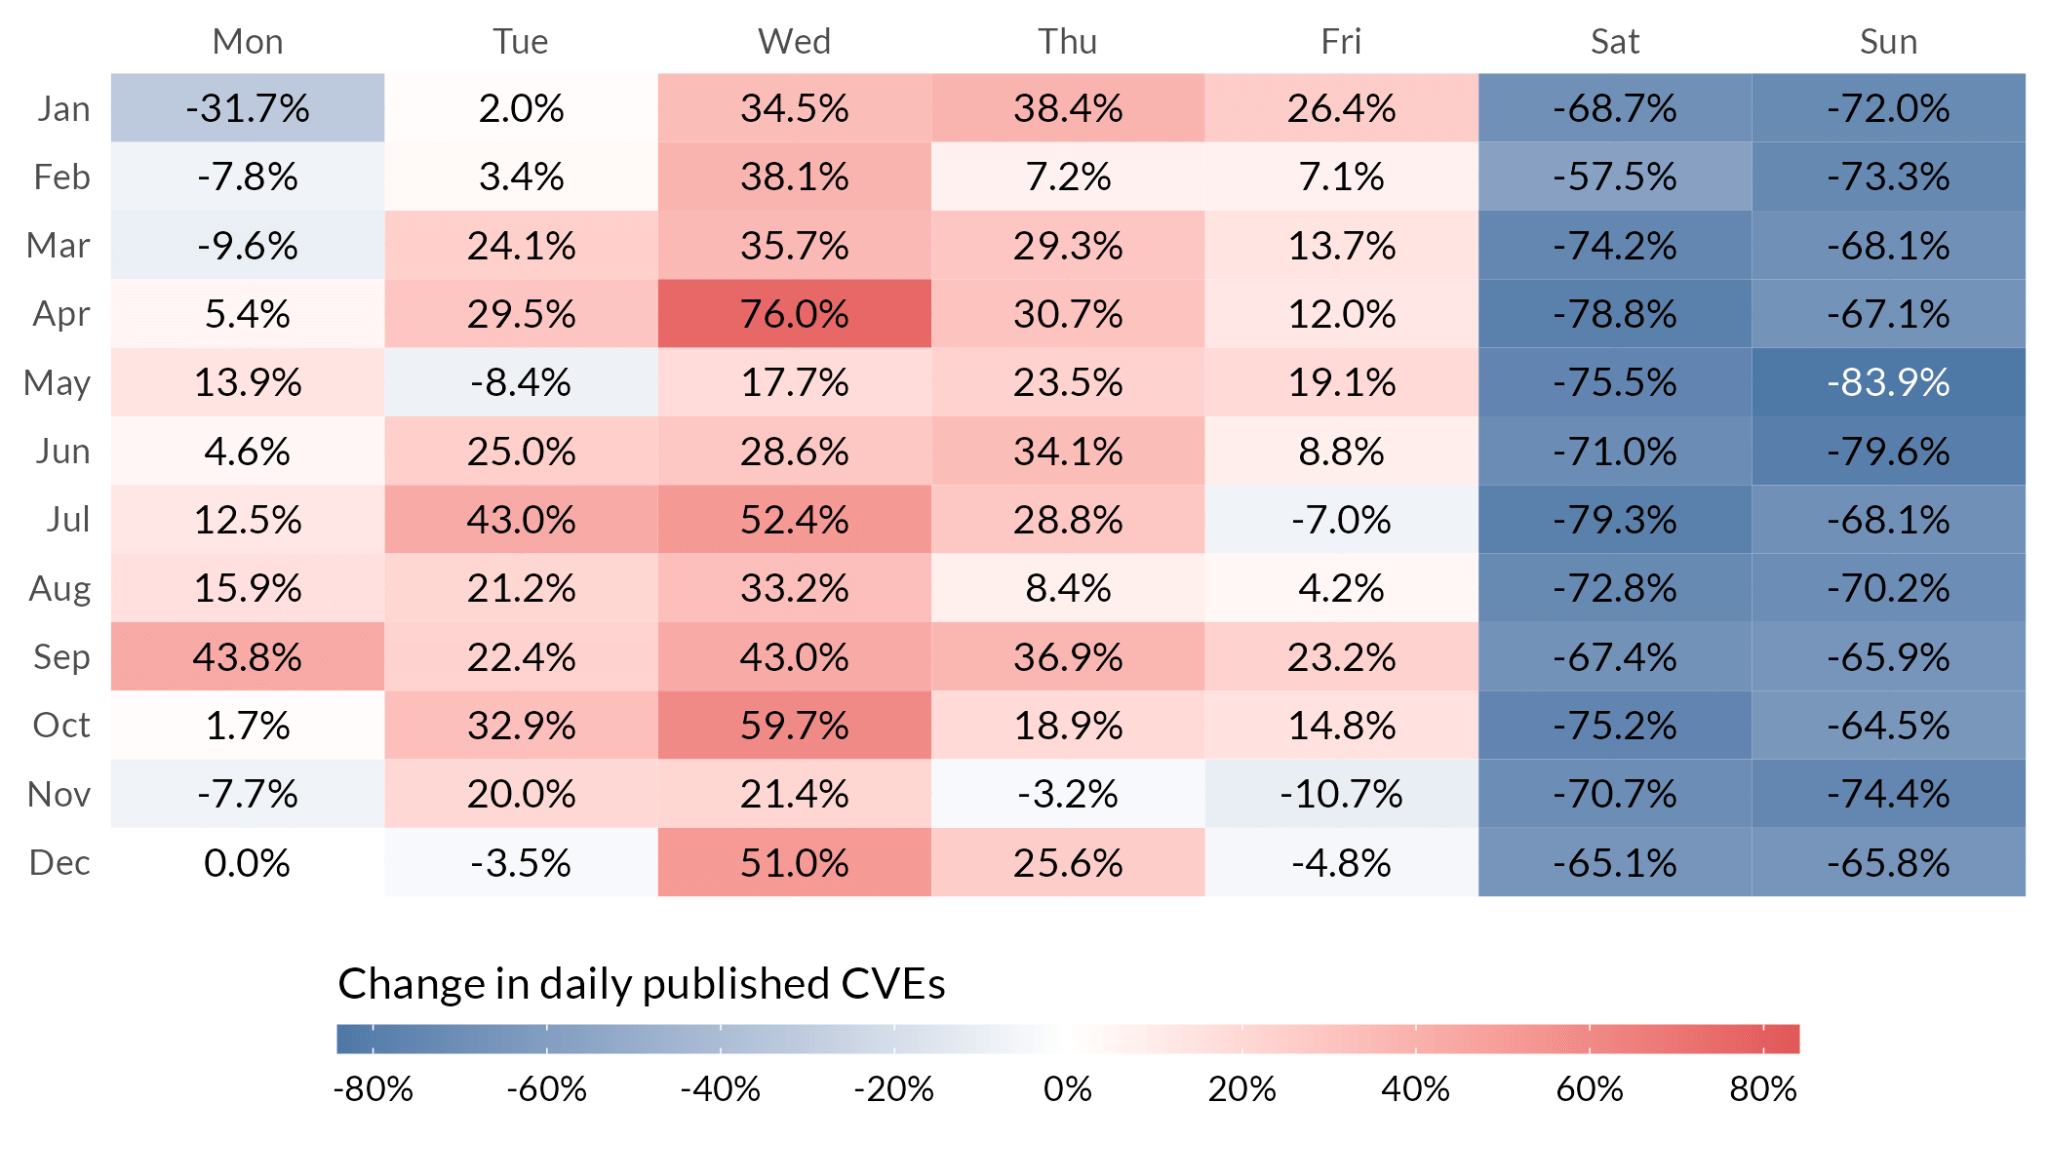
Figure 3: The percent increase in the median number of CVEs we’d expect to see on a given day of the week relative to Monday's in December accounting for the trends we see above in Figure 2. The numbers are derived from a Generalized Additive Model to account for time-based trends. Monday’s in December are an arbitrary but necessary decision given the nature of these types of models and the fact that comparisons have to be relative to something.
It’s notable (and thankful) that weekends tend to be quiet for “official” publications. Wednesdays in April though… whoo boy, that’s when things tend to get crazy. Why? Who knows. We note that the results above also account for US holidays12 (we are really good at statistics, trust us), and our model also allows us to ask, what three-day weekend is most likely to get interrupted? See Figure 4.
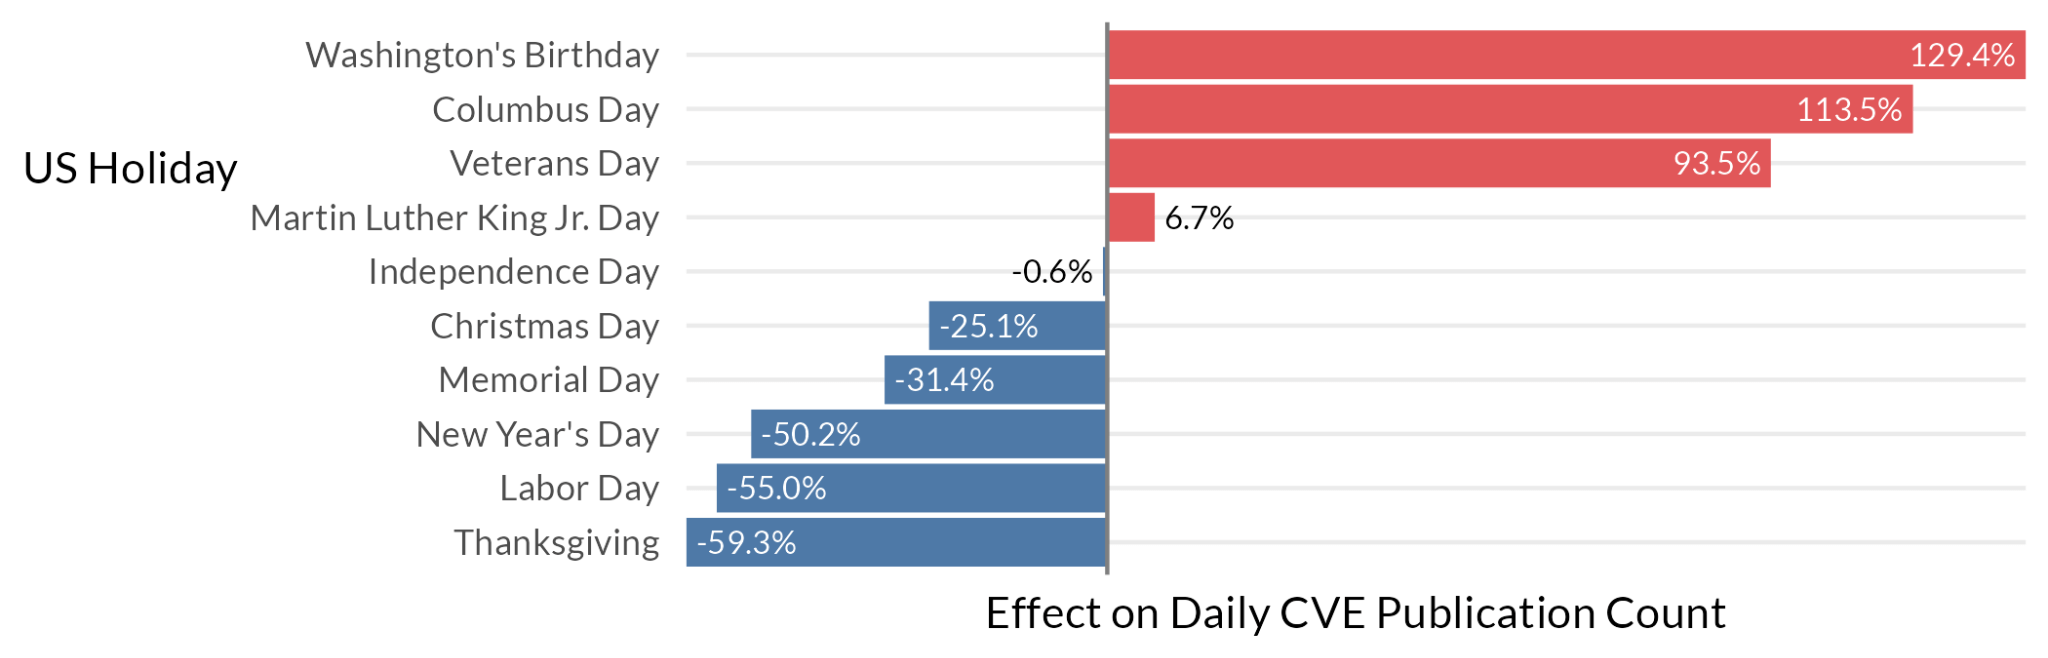
Figure 4: Busiest (and least busy) US holidays, by number of CVEs, relative to non-holidays.
Thankfully, Thanksgiving, Christmas, and New Year’s Day tend to be pretty quiet. The NVD is similarly respectful of Memorial Day and Labor Day. However, most of those other three-day weekends are, in fact, likely to have more vulnerabilities than your typical non-holiday.
One more time-based result we have is that no particular month seems to be loaded with CVEs. Check out Figure 5, and note that the percentage of CVEs published in a particular year by month is all over the place.
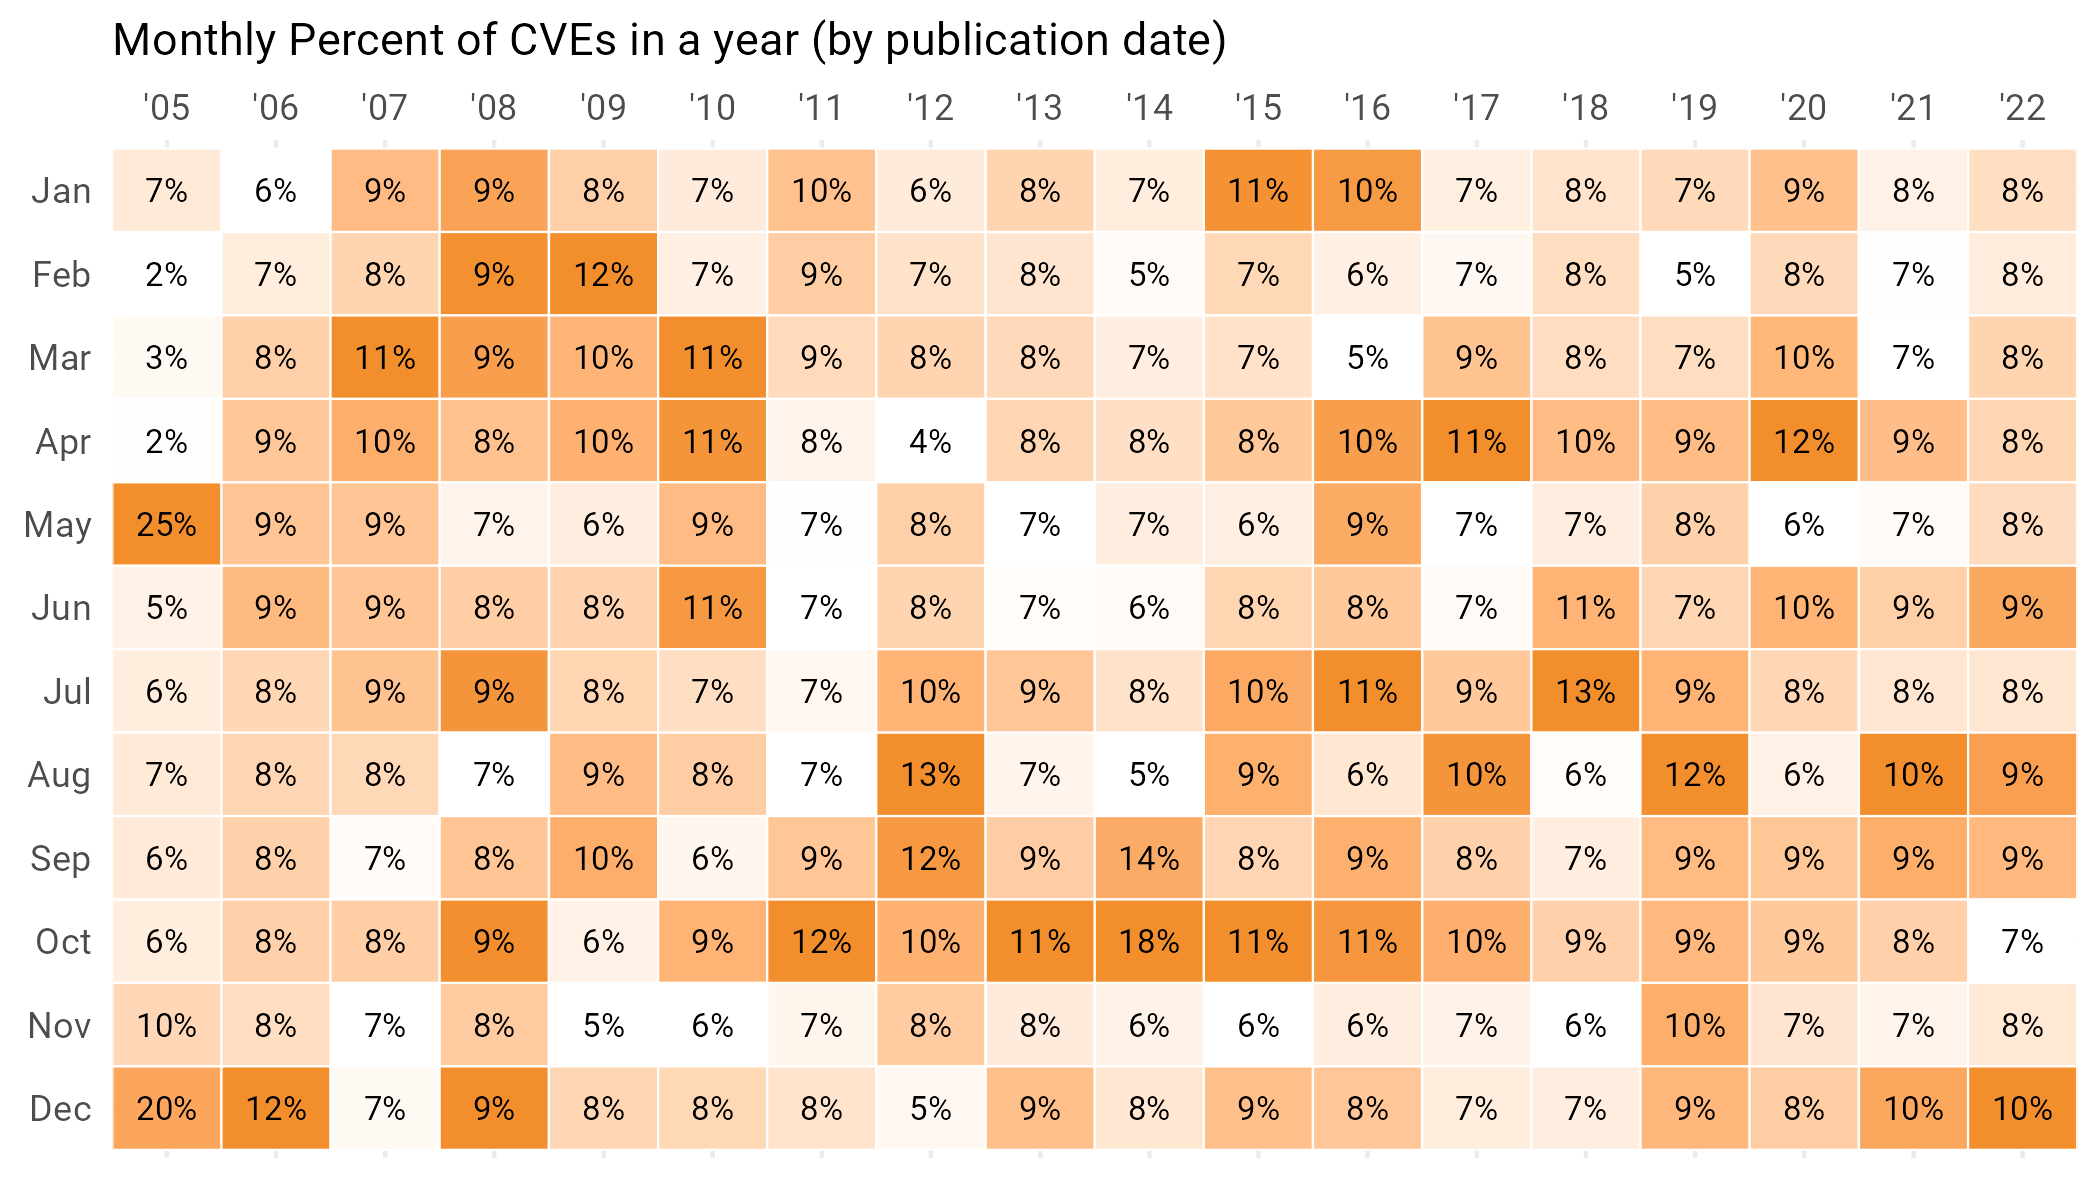
Figure 5: Percentage of vulnerabilities published in each month by year. No clear pattern emerges of the “Worst Months of the year”.
New Vendors
It is helpful to know how many new vulnerabilities are published each week, but there are other methods of counting. For example, we might want to know how many peddlers of soft-wares have actually produced a product with a security vulnerability. Using the same methodology as before, we look at how many software vendors publish their very first vulnerability each week in Figure 6.
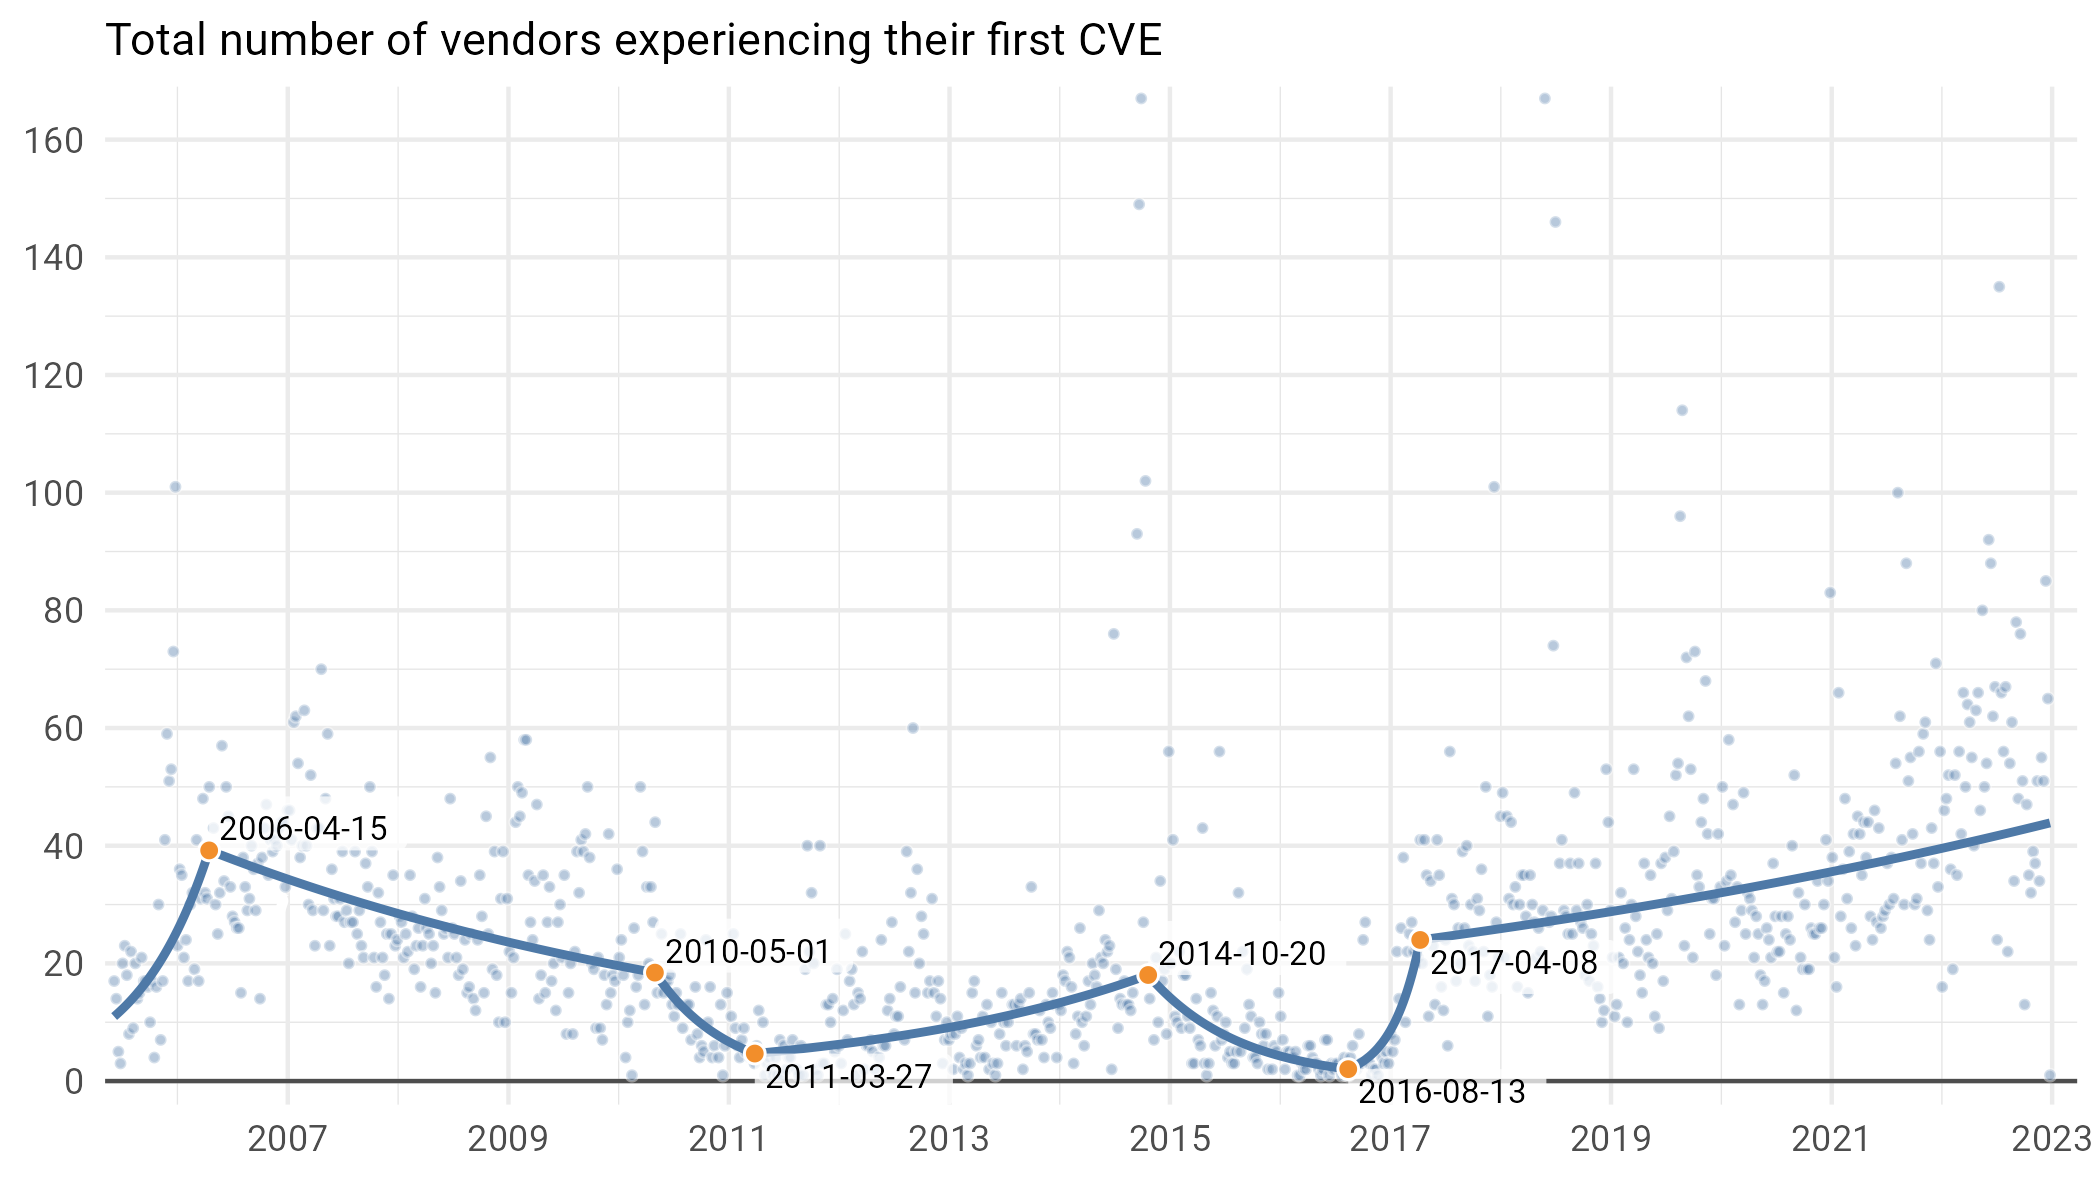
Figure 6: Number of vendors with their first associated CVE each week (each dot represents one week).
What’s interesting is that we see a few distinct periods of growth. First, as funding for the NVD ramped up after 2005, there was a bonanza, with hundreds of new vendors publishing their first vulns each week. In fact, peeking ahead to the same time period in Figure 7, a good 1/3rd of vulnerabilities published in any given week were some poor vendor’s first. Things calmed significantly through the early aughts (though we do see that massive spike for all those APKs in 2014), with the CNA process once again leading to an expansion of the number of distinct new vendors with CVEs from 2017 onward. If this growth continues (which, given the change-points in the timeline, is already far from certain), we’ll be seeing CVEs from 54 new vendors in a typical (median) week in 2025, and as many as 200 at the high end.
Daily CVEs Publications From New Vendors
While the growth above is interesting, it’s worthwhile to normalize this by the total number of CVEs published in a given week. We do this in Figure 7.
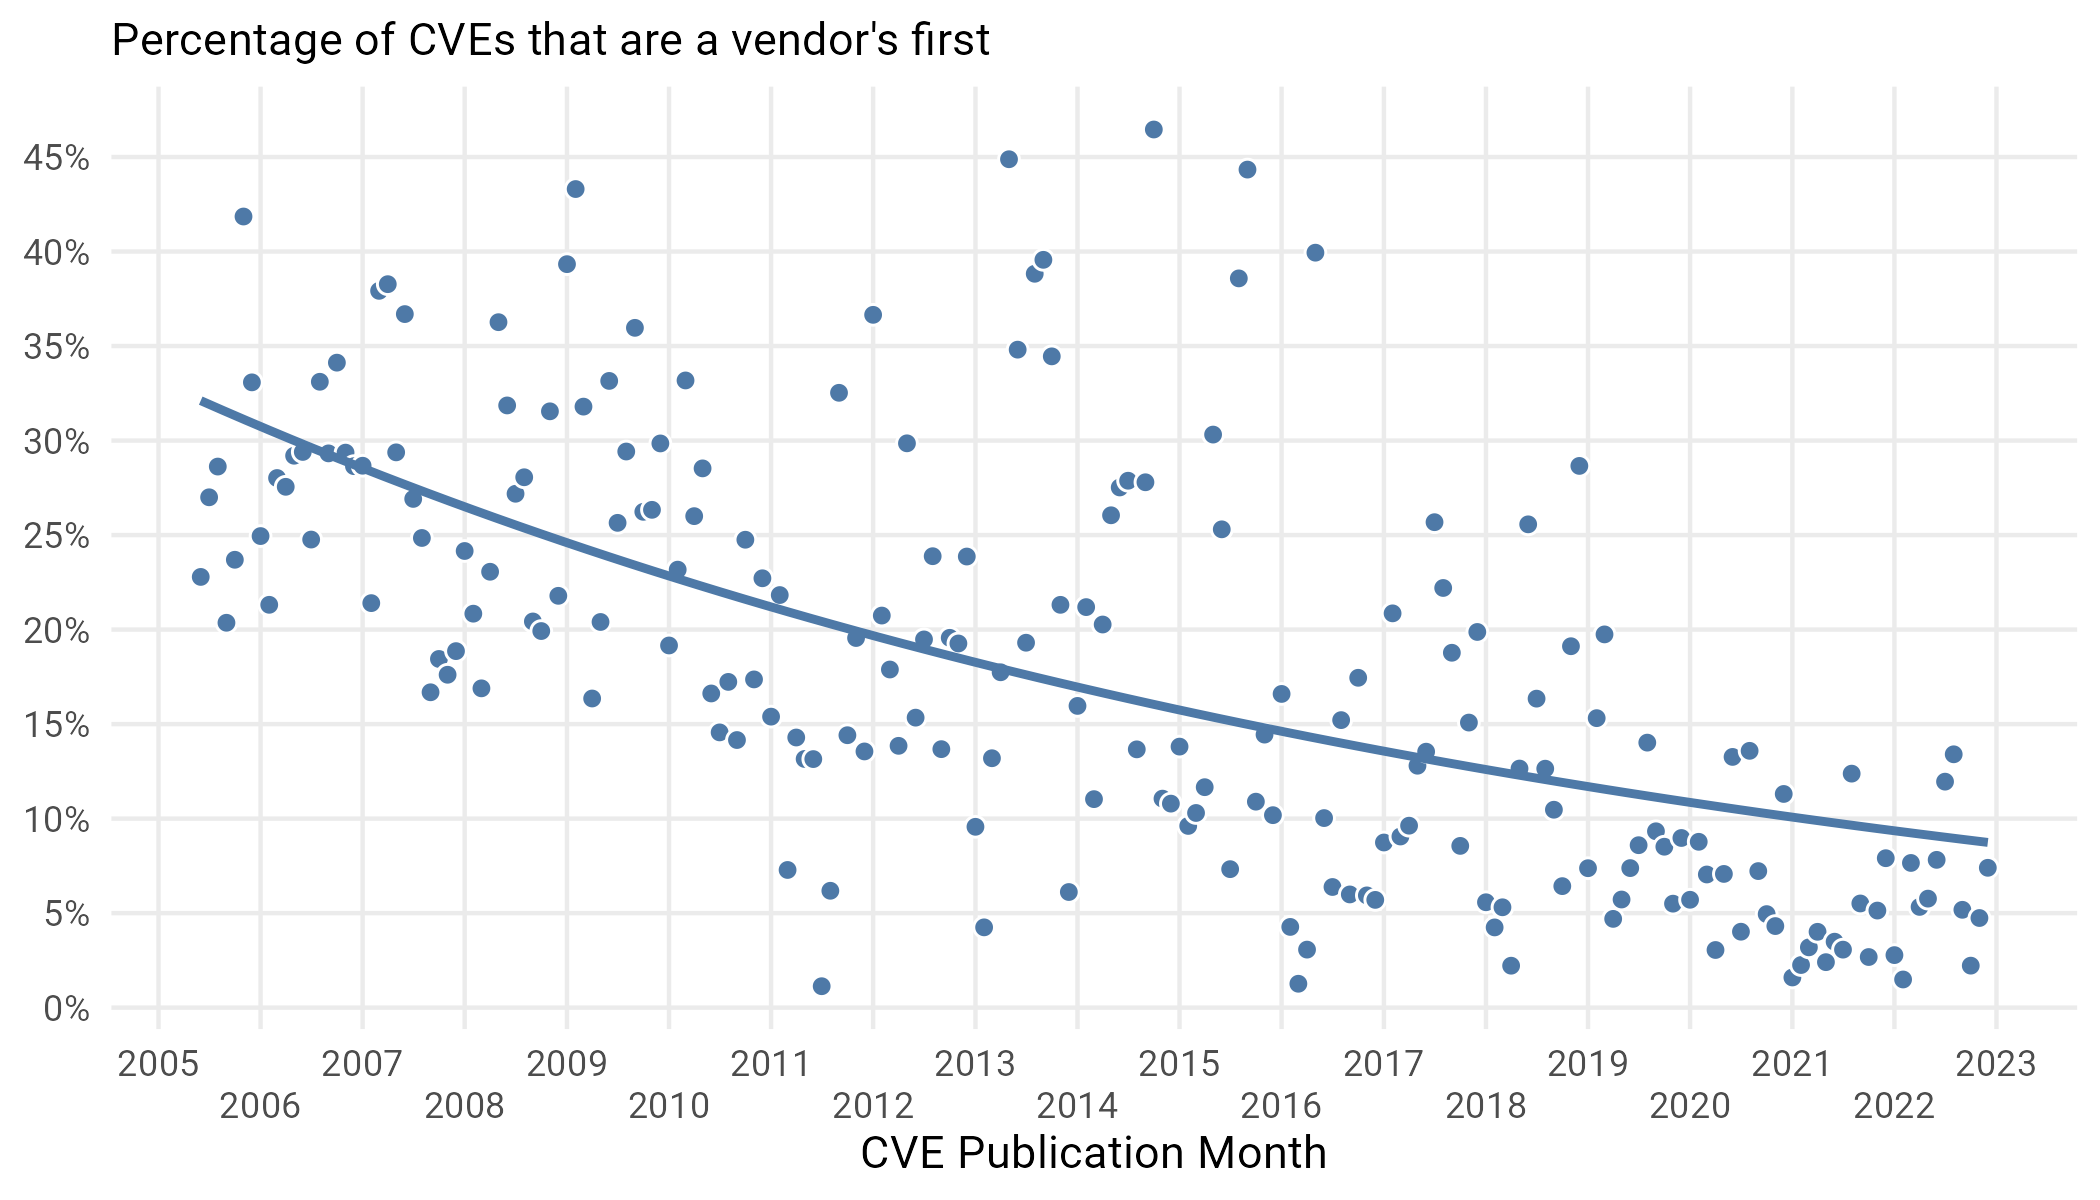
Figure 7: Percent of CVEs published each week that are a vendor’s first.
Strangely, even though Figure 6 showed that there are many new vendors with their first CVE each week, the percentage of overall attributed to new vendors is declining. While initially this might seem paradoxical, it has a simple explanation: vulns pile up on old vendors faster than they are being found for brand new vendors.
Days Between CVEs
So, how quickly do those vulns pile up on old vendors? To examine this, we look at the median time between vulnerability publication of successive vulnerabilities in Figure 8.
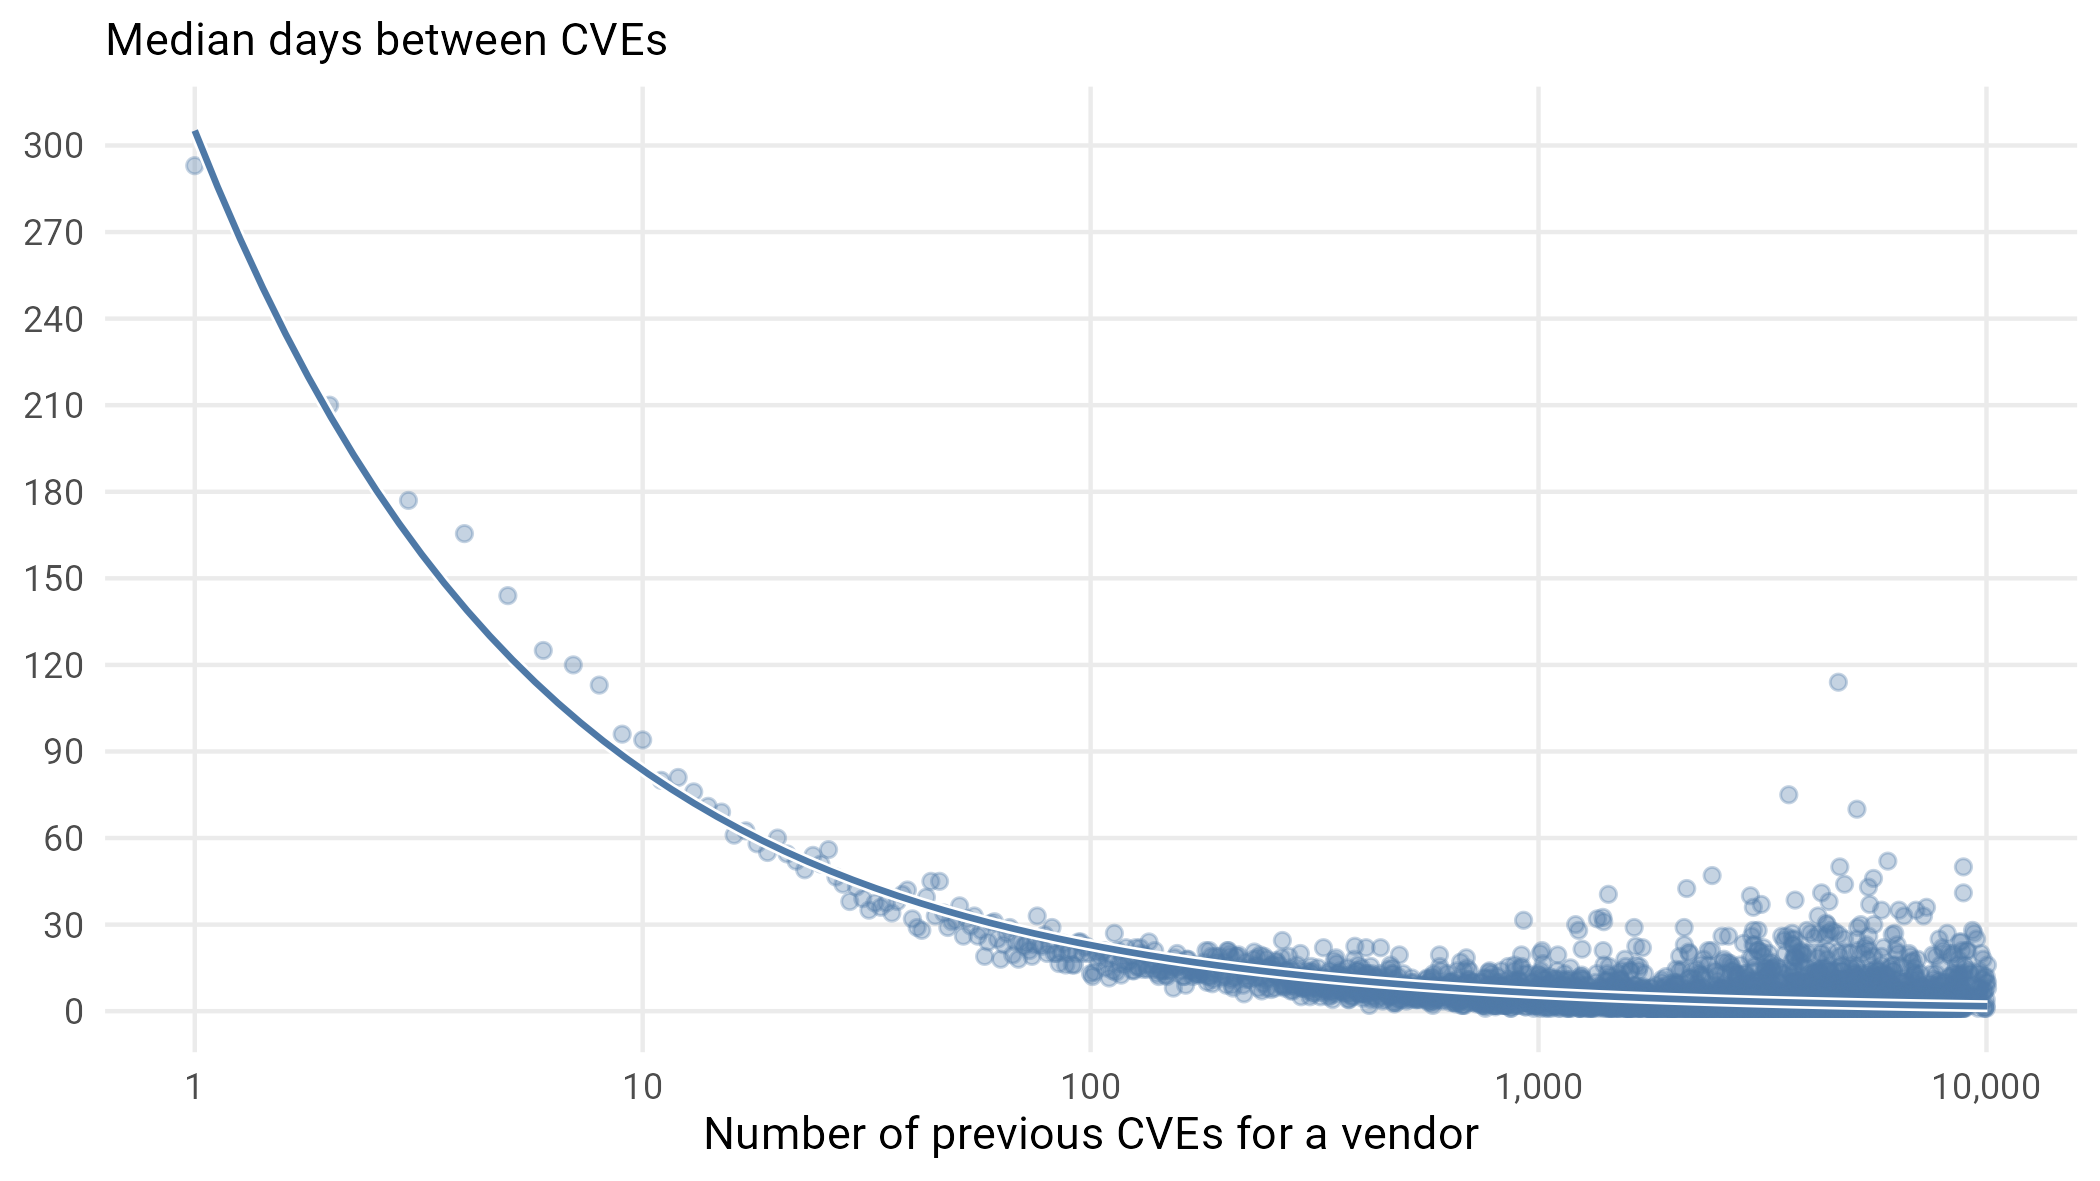
Figure 8: Median days between vulnerabilities for vendors.
It’s clear that once you get to be a software giant with a few thousand vulns attributed to you, they are going to continue coming fast and furious. On average, daily. We want to make it clear that we don’t think this is a causal relationship, that somehow vulns beget more vulns, but rather that there are simply companies that produce a lot of software used by a lot of people and this drives both the high volume of security vulnerabilities creation and discovery attackers.
Weird Thing 1: One Hit Wonders
The flip side of this is organizations that have published one vuln and have managed to avoid having another published for more than a decade, more than three times longer than the median in Figure 8 would suggest. In fact, among the 27,960 vendors with a published vulnerability, there are only 382 who have a single CVE published and that CVE was published more than 10 years ago. These include some pretty prominent vendors, with a reasonably large software portfolio. Here is a sample of four we found particularly interesting:
- Deutsche Telekom (https://nvd.nist.gov/vuln/detail/CVE-2008-1252)
- IronMountain (https://nvd.nist.gov/vuln/detail/CVE-2011-2397#match-1725328)
Highest Highs, Lowest Lows, and the Shifting CVE Landscape
Now that we’ve gotten a sense of the overall size of the CVE landscape, and how it’s growing, let’s see if we can examine some of its topological features and point out some interesting looking landmarks.
Top Vendors
The last section left off with how often new vendors show up in the vulnerability pool, and the time between vulnerabilities for vendors who already have a few under their belt. But now it’s time to name names. In particular, which vendors—according to the NVD—have the most CVEs? Figure 9 absolutely will not surprise you.
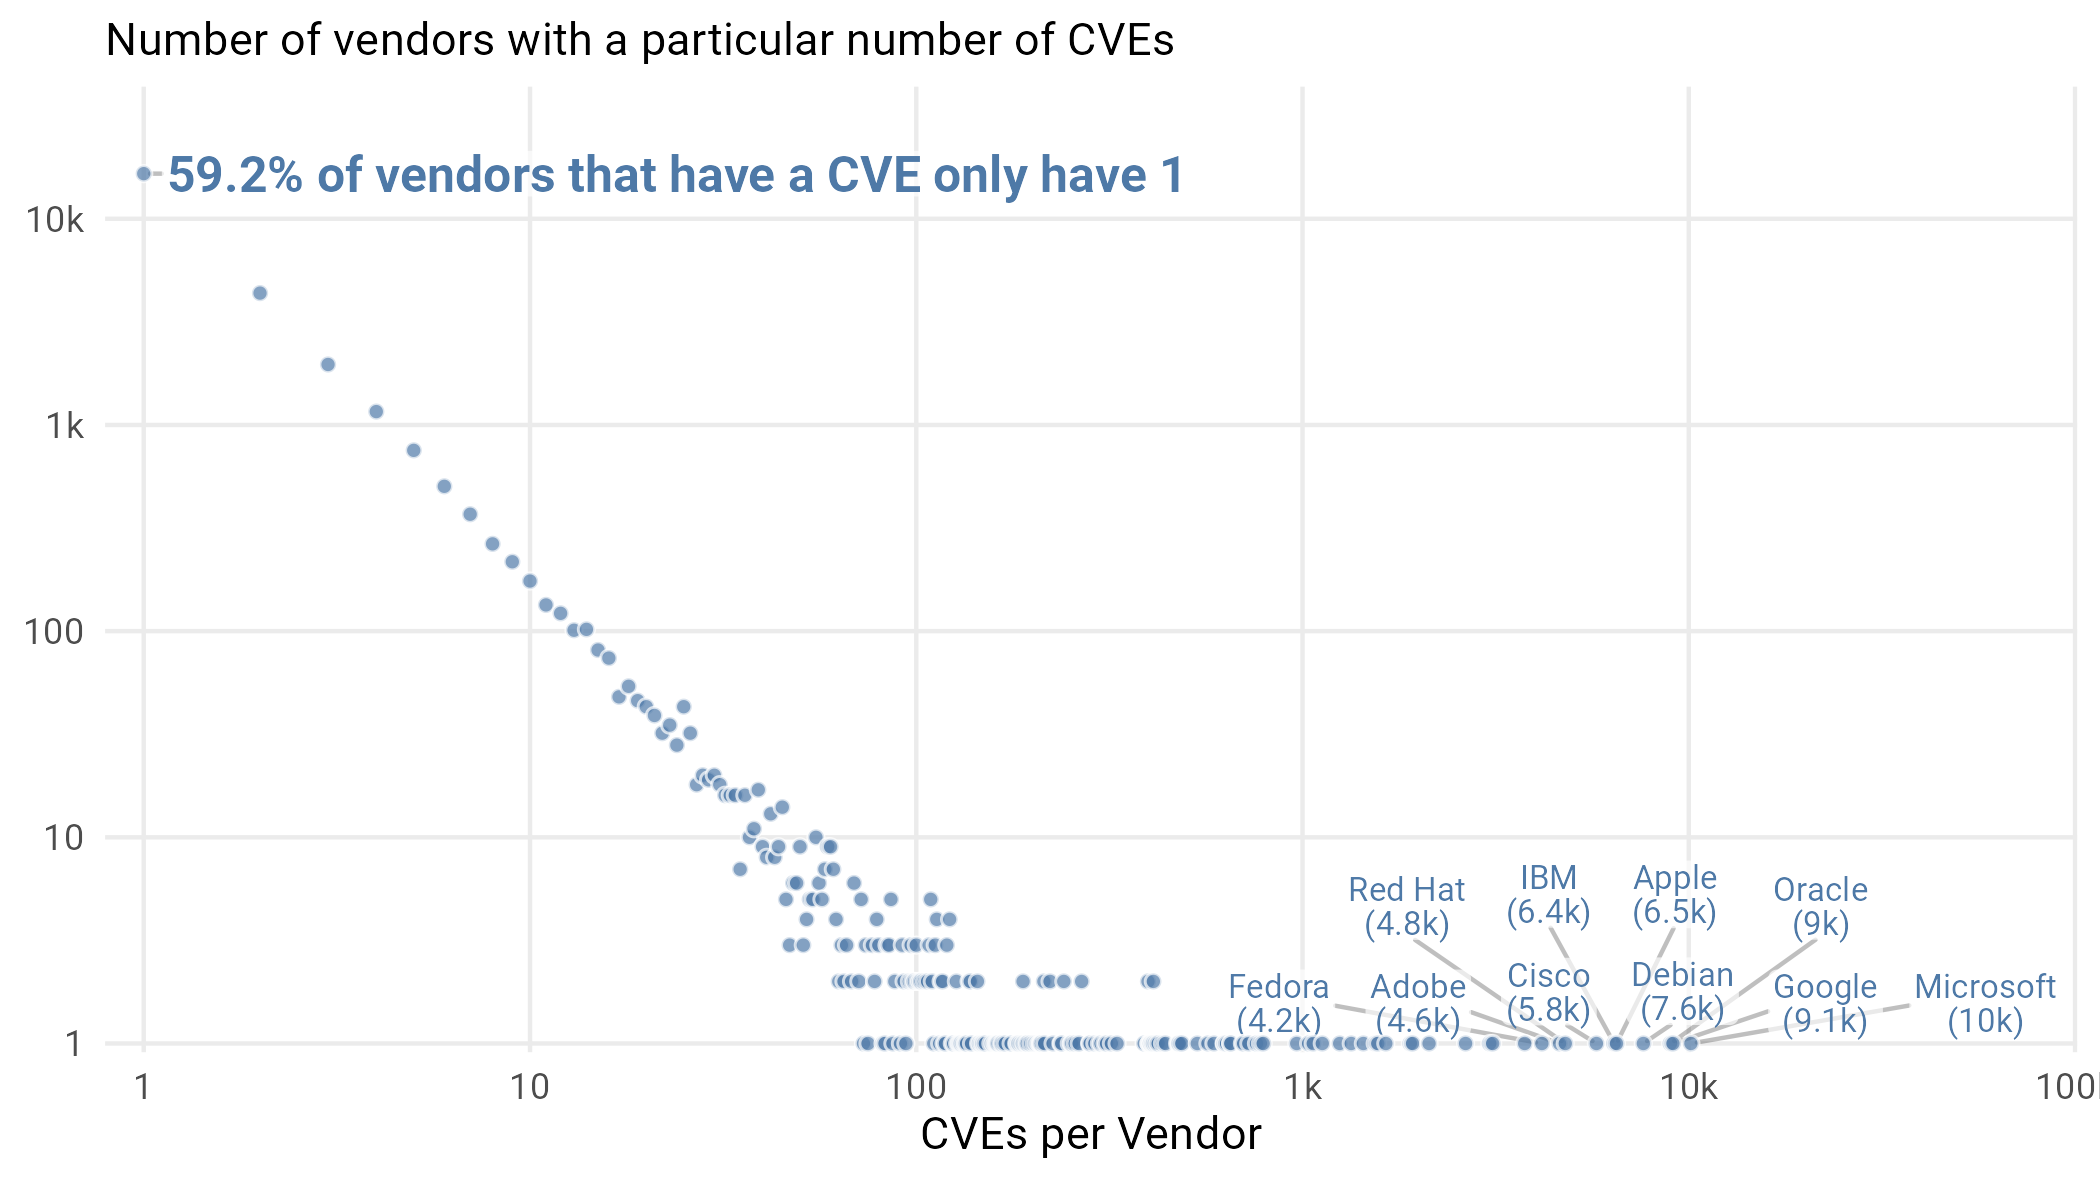
Figure 9: Count of number of vendors with a particular number of CVEs. Note the log scales on both axes. Since we don’t know how many vendors there are without a published CVE, statistics like the 59% number are specifically in terms of the 27,960 vendors who have a CVE.
The top players in this figure are, and we think few would disagree, the top players in software over the last 20 years. Microsoft leads the way with Google and Oracle close behind. This is in no way a criticism of these companies, but rather a demonstration that when you write a lot of software used by a lot of people, there are bound to be vulnerabilities and attackers willing to scour the software for those vulnerabilities.
Weird Things 2, 3, and 4: Most Wide-Ranging CVEs (by software affected)
Of course, some vulnerabilities affect more than one piece of software. Exactly what parts of the software are affected is the purview of the “Common Platform Enumeration” (CPE) is something we glossed over a bit before. CPE is another NIST maintained initiative that systematizes exactly what software a CVE affects and largely breaks things down into three levels: vendor, product, and version13.
This means that most vulnerabilities affect multiple versions, some affect multiple products from a single vendor, and some affect a myriad of vendors. To be clear, most CVEs have a pretty narrow focus: 90% affect a single vendor, 74% affect just one product, and 49% affect just one version of a single product. But to use a statistical term, the tail is long and some CVEs affect a wide range of software.
We call out three CVEs in particular that are the widest ranging by different criteria and interestingly (weirdly?) different reasons.
- CVE-2017-15361 affected 35 different manufacturers of Chromebooks which used an Infineon Trusted Platform Module that had a faulty implementation of the RSA algorithm.
- CVE-2015-12207 was a flaw in page table invalidation that was exploitable for virtual guest operating systems running on Intel processors. This means that this CVE was associated with a wide range of Intel products as well as essentially every OS or hypervisor that was able to run virtual OSes on Intel Hardware, making it a whopping 1,532 different products.
- CVE-2016-1409 is a vulnerability found in Cisco’s product implementation of Neighbor Discovery Protocol for IPv6. It affects a whopping 4,891 software versions. Why so many? Simply because Cisco provides very fine-grained version information for many of its products, with new version releases coming for the smallest change.
Top Common Weakness Enumerations (CWE)
Some vendors have piled up a large number of vulnerabilities and some of these range across many vendors. But exactly what are the vulnerabilities? What exactly was written into the software to create these opportunities for attackers? The need to categorize these is so strong that MITRE created another categorization to try to organize all the ways software can go wrong. This culminated in the creation of the Common Weakness Enumeration (CWE) framework.
Weird Thing Number 5: Multi-CWE CVEs
CVEs are supposed to have a single CWE, but it turns out around 5% have multiple CWEs assigned. ¯\_(ツ)_/¯
The CWE list is a cacophony of information hierarchically arranged to try to catalog all the ways software can go wrong. There is a lot of history, complexity, and change here, some of which we’ll cover in a later section, but just know there are a lot of ways to slice vulnerabilities into weaknesses14. Let’s take a look at which ones have been popular and how that’s changed over time in Figure 10.
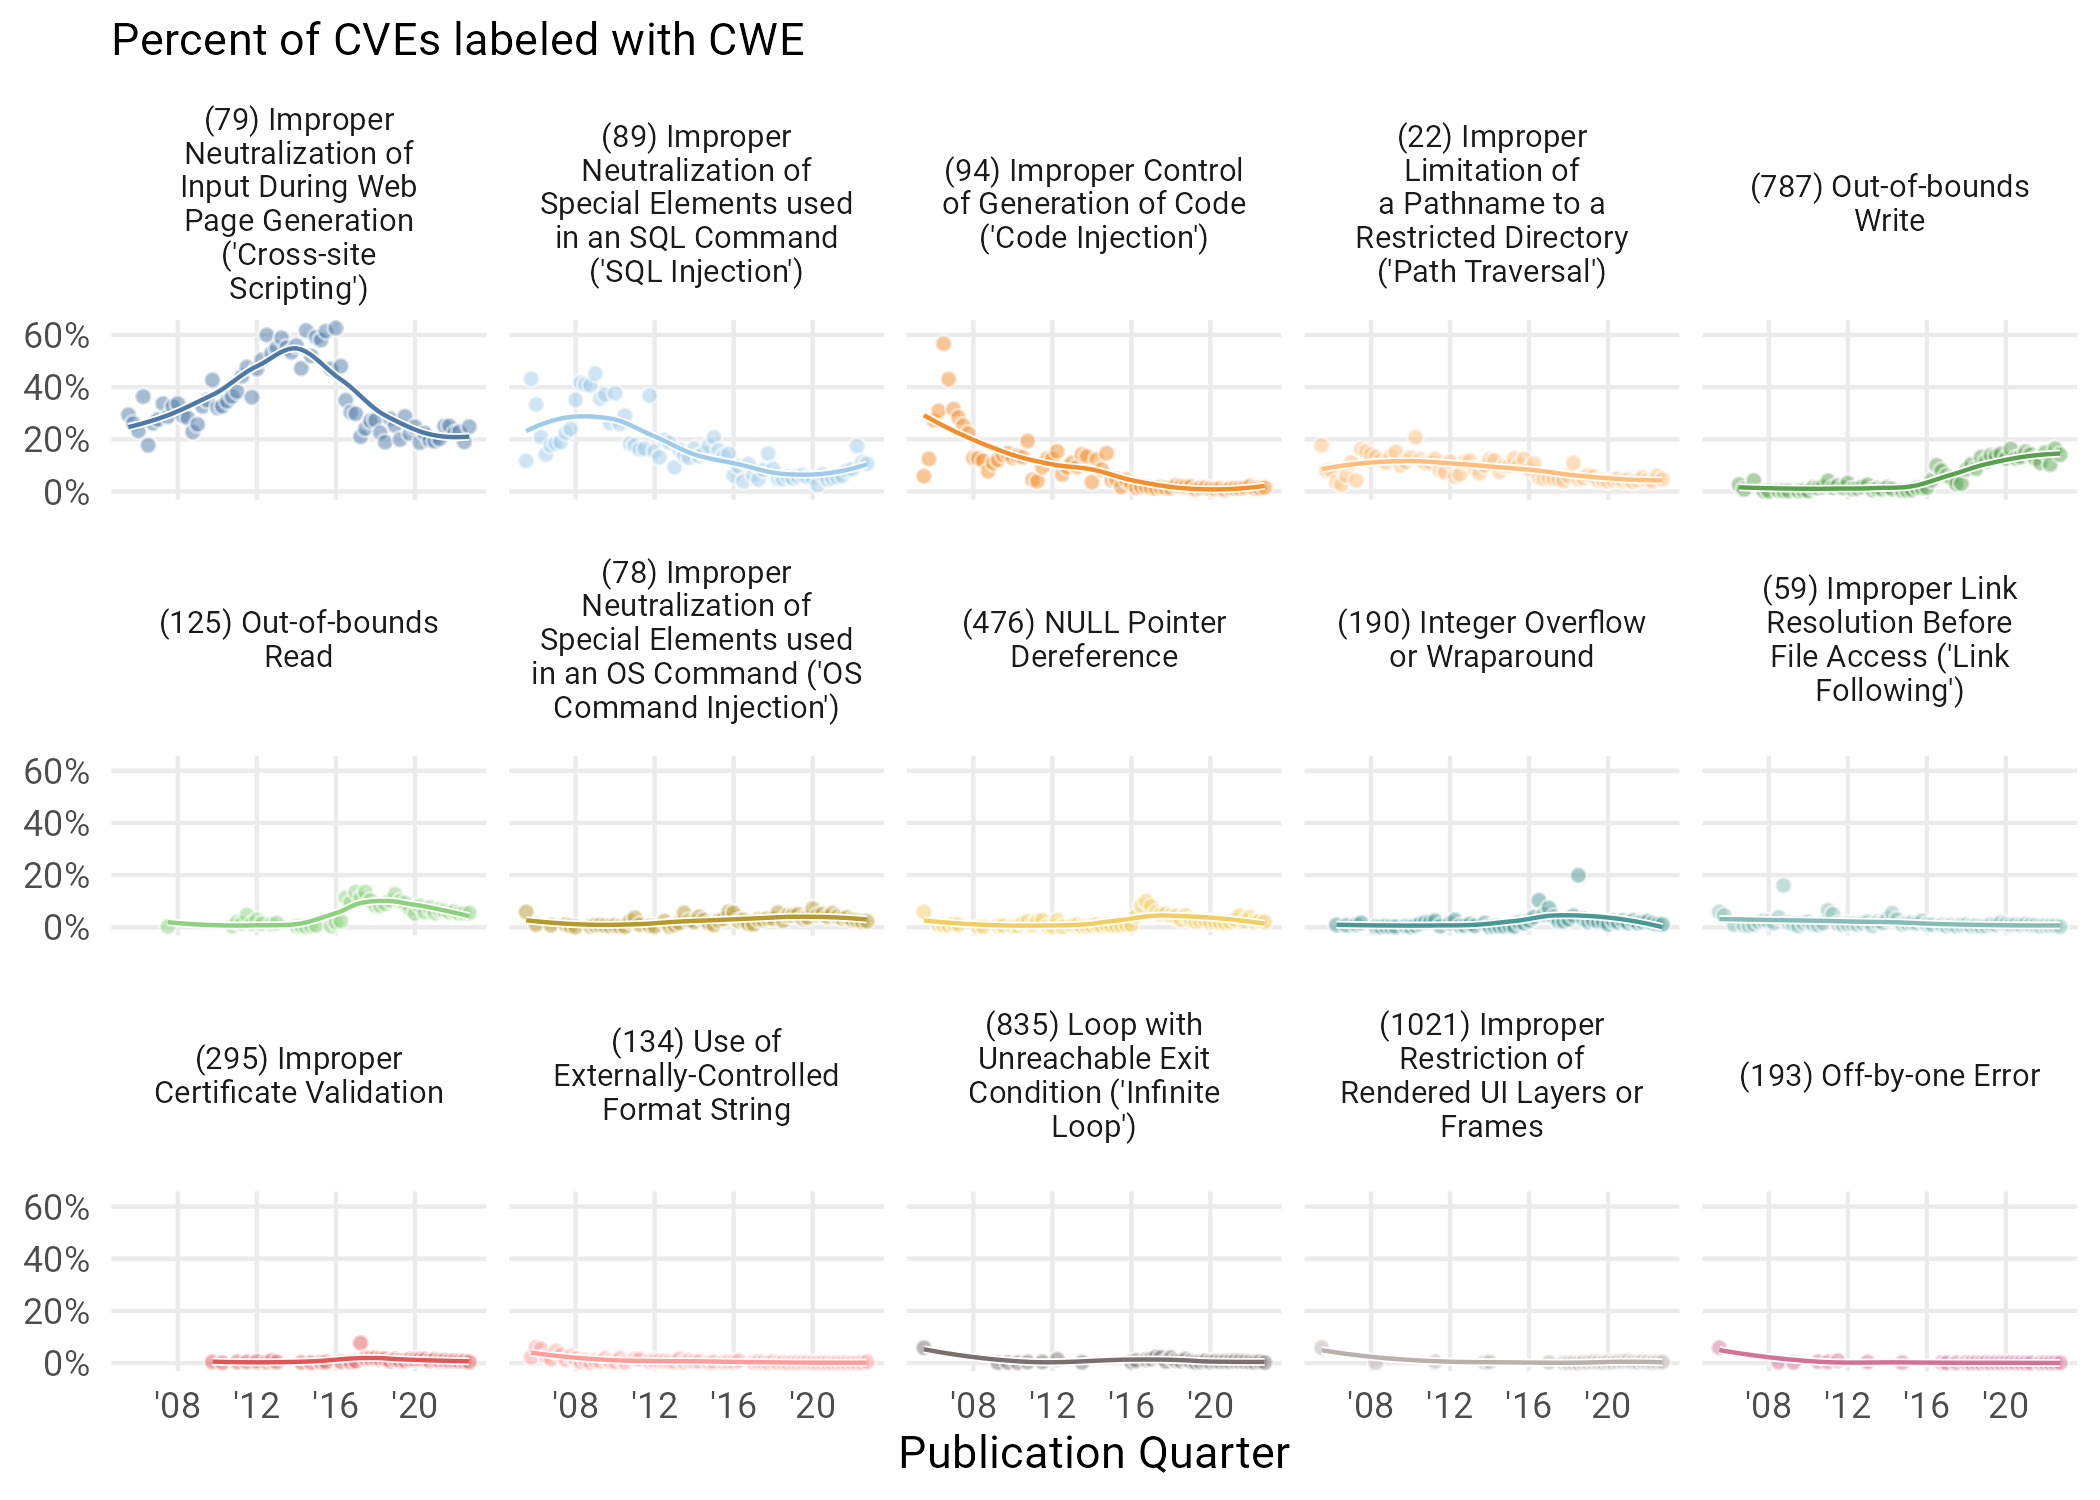
Figure 10: Percentage of vulnerabilities published each quarter corresponding to different CWEs. Only CWEs that reached the top 5 in particular are shown.
What’s perhaps most striking to us about Figure 10 is the relative flatness of most of the popular CWEs over time. Cross Site Scripting and Injection had their peaks but have declined steadily with almost nothing rising to replace them, perhaps with the exception of “Out-of-Bounds Write”. Rather, things have continued to just become more uniform, with CWEs spread out to a low level. In the next section, we dive a little deeper into this shift.
Unique CWEs
The obvious next question to ask as a follow up is whether CVEs are sticking to some finite set of CWEs and things are just “evening out”, or if there are never before used and unique CWEs. If we examine the number of unique CWEs assigned to CVEs on a monthly basis (Figure 11), we can see strong evidence that more CWEs are irrupting onto the landscape than 10 years ago.
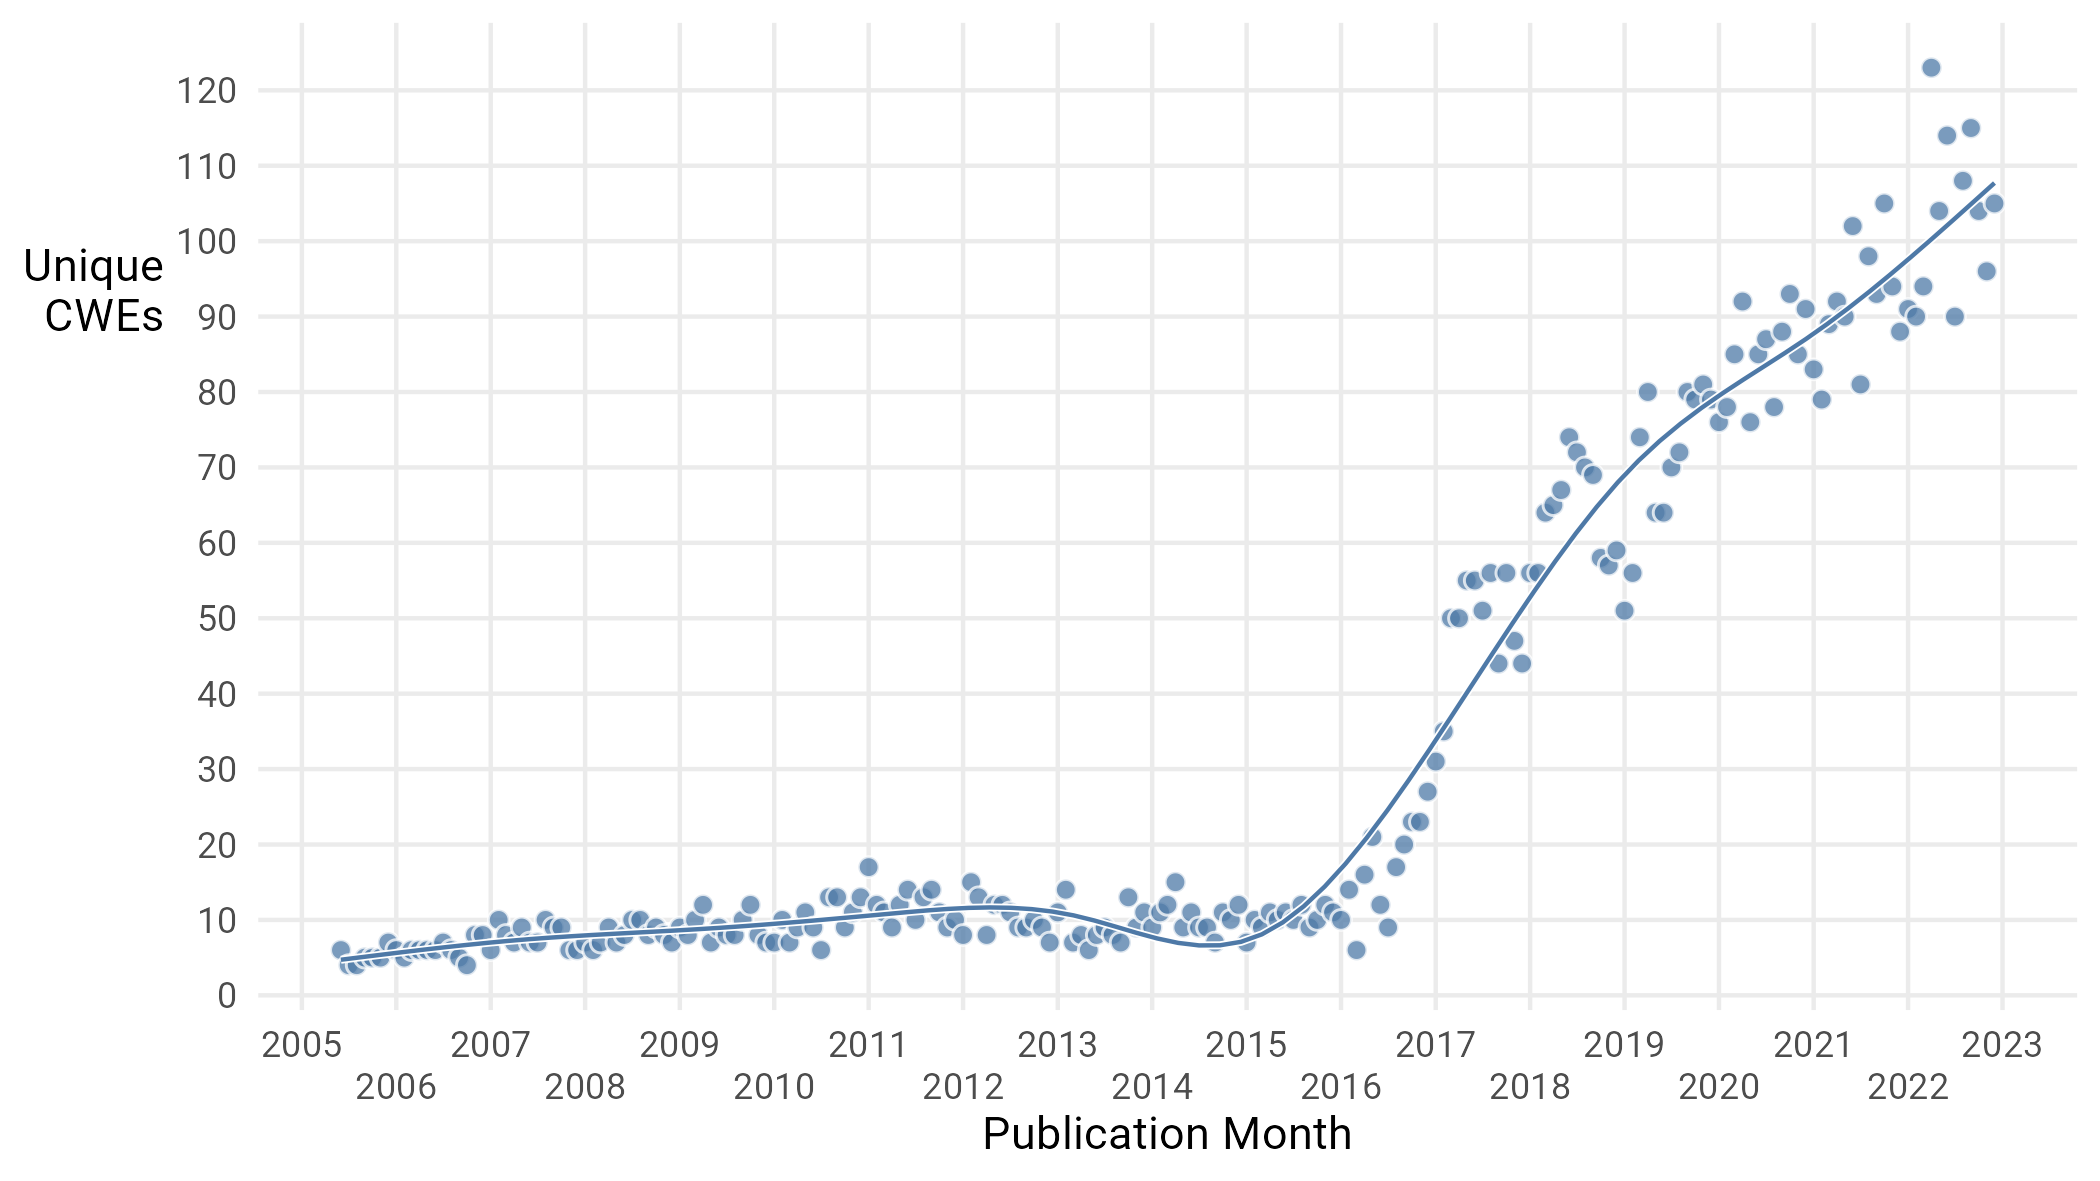
Figure 11: Unique CWEs used per month.
So what cause can we attribute to this explosion? Is this a real shift in the data or something to do with how vulns are categorized? The answer is probably the latter. In 2016, a new CWE “view”15 (CWE-1003) was created which dramatically increased the number of weaknesses that could be associated with a CVE. This is the most likely explanation for the proliferation of CWEs in published CVEs.
Let’s look at this in a little more detail. Consider Figure 12.
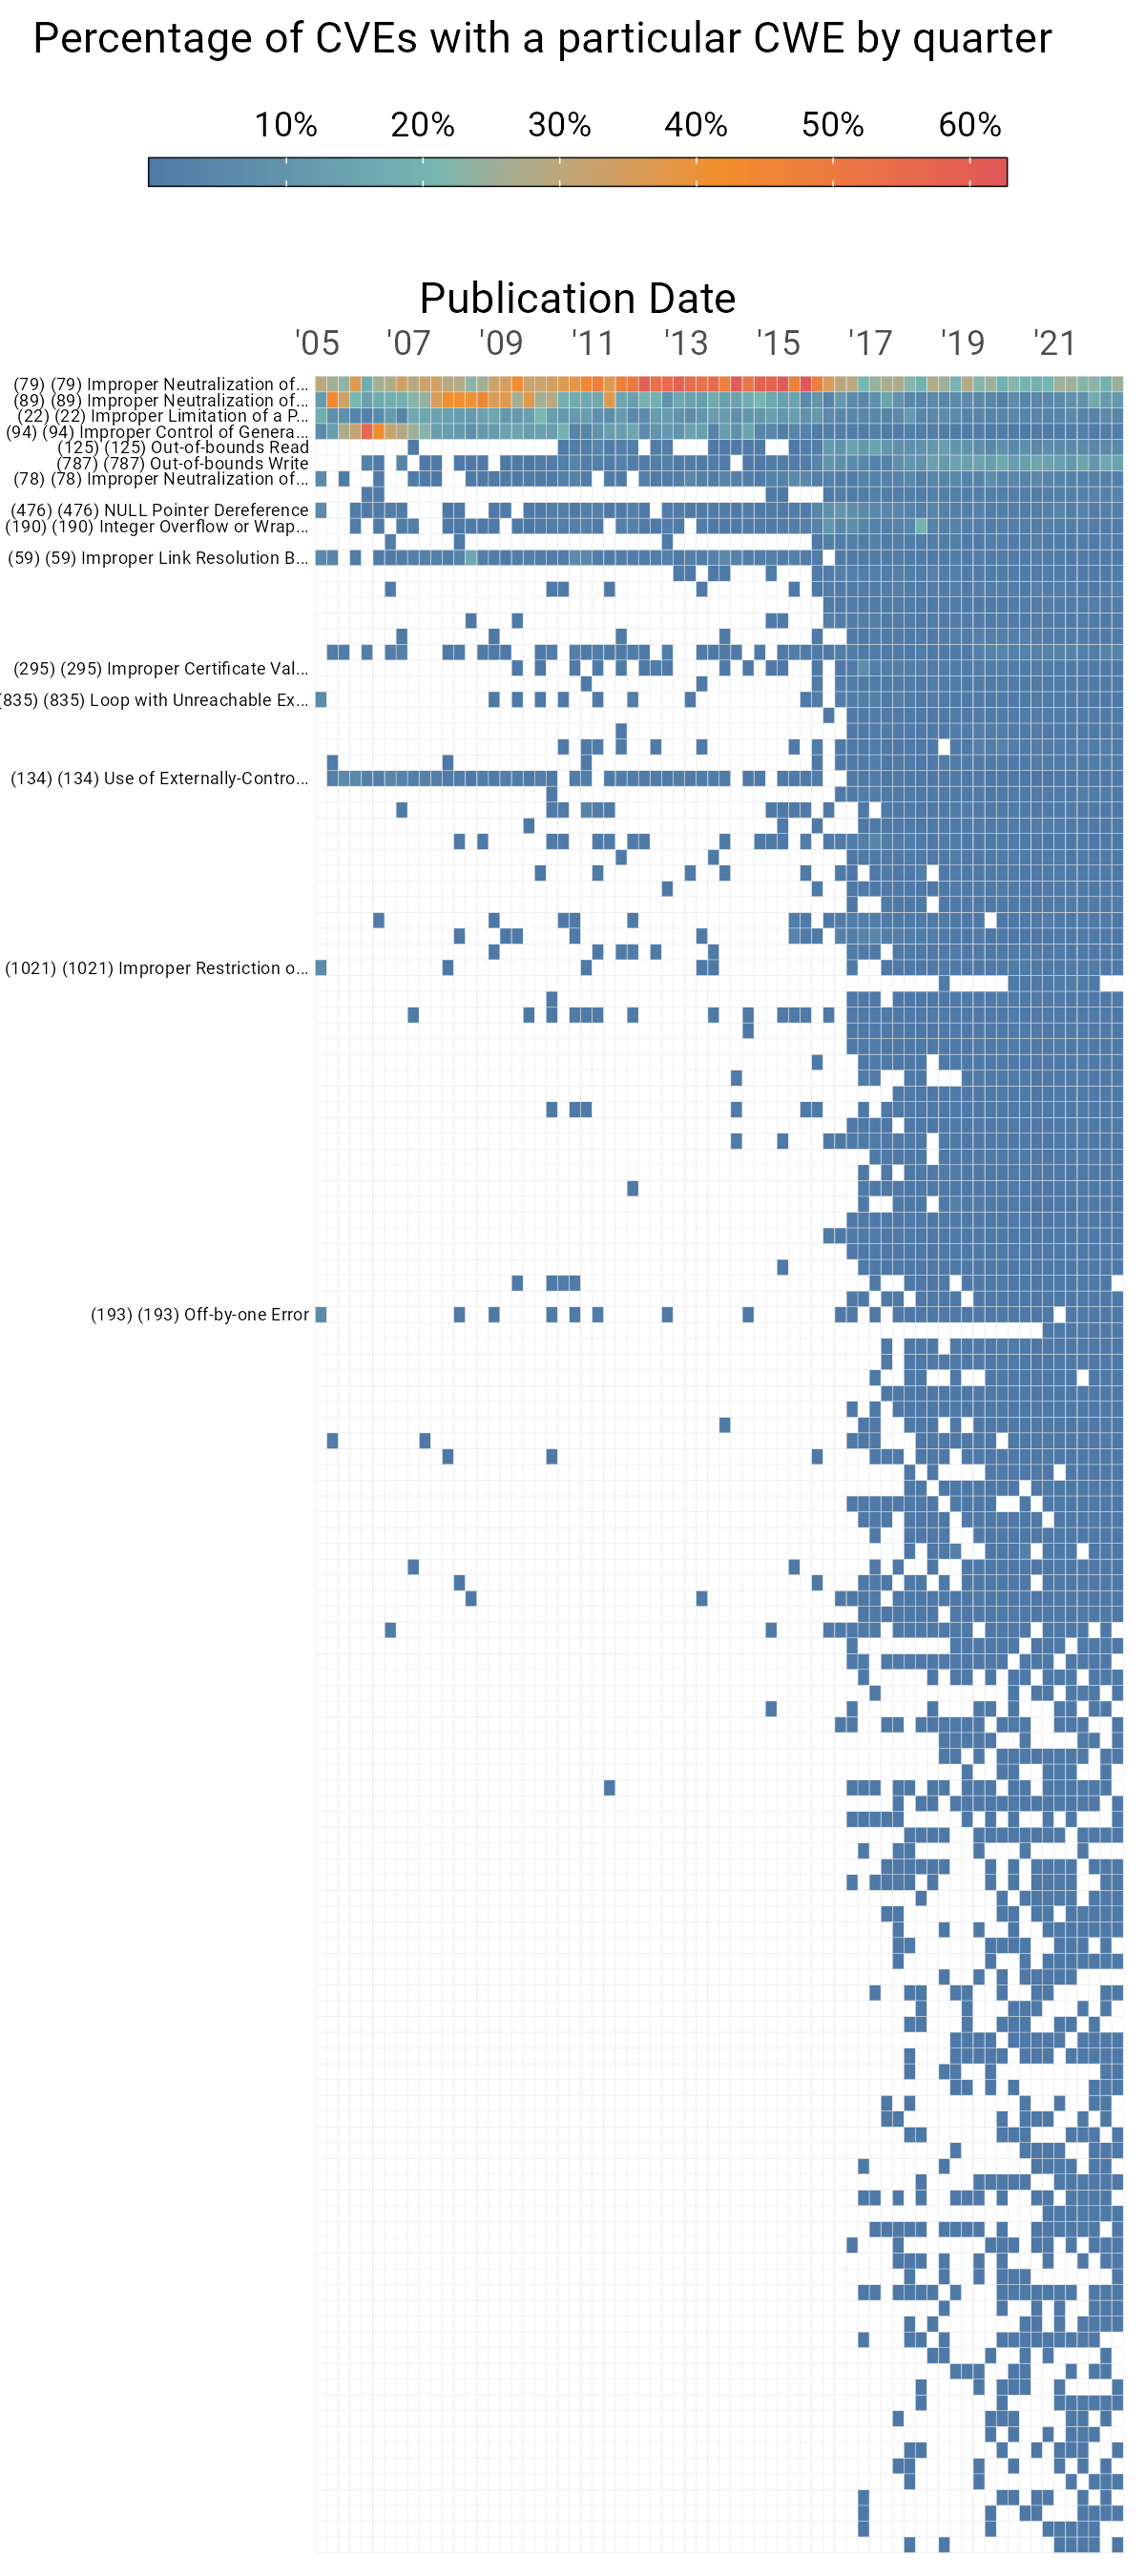
Figure 12: CWEs by percentage of CVEs published per quarter.
Each row in Figure A represents a CWE, and its color represents its relative prevalence among CVEs published each quarter (the horizontal axis). Because of the relatively large number of CWEs in the data, we only include those that appear in four distinct quarters throughout our data sample. We’ve annotated a handful of CWEs; in particular, the ones included in Figure 10.
What is striking here is that we can see the proliferation of CWEs around 2015 in Figure 11, but we also see a “flattening” of the distribution of those CWEs. Prior to the proliferation, most CVEs were concentrated in a few top weaknesses (deep red). After that, however, there is a much flatter distribution with the largest portion only making up around 20–25% as opposed to some previous quarters where it was nearing 2/3rds of CVEs.
To give a more mathematical approach to this perceived “flattening”, we reach into our statistical toolkit and pull out a measure from ecology. That measure is “Shannon Diversity”, and it gauges how evenly spread out an ecosystem is among various species16. A more mathematical explanation is how close a set of categories are to being uniformly distributed. The value scales between 0 and 1, with 1 being “most diverse” and 0 being “no diversity”, i.e., every object in a single category. We calculate this over time in Figure 13.
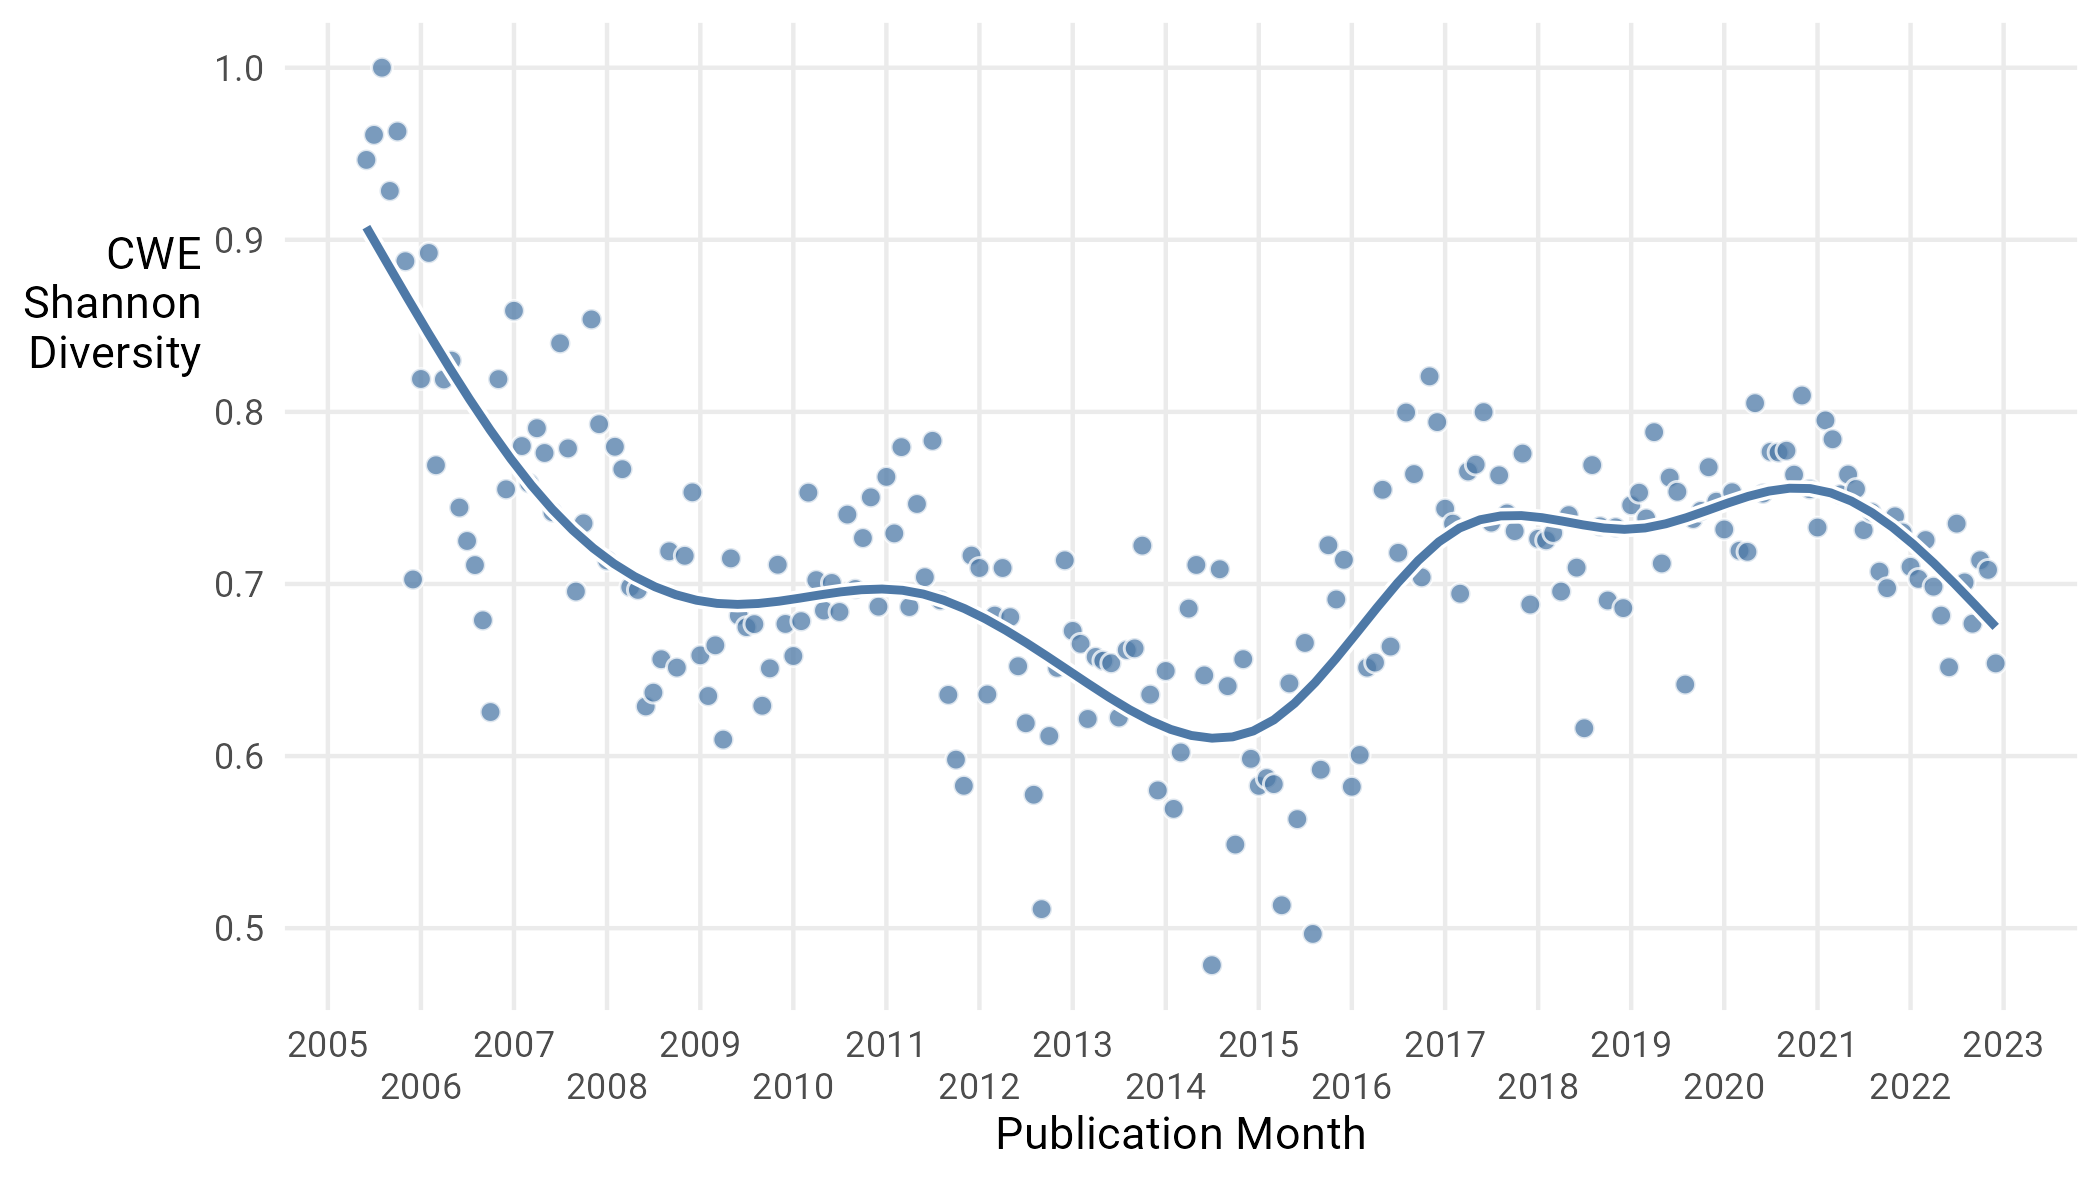
Figure 13: CWE Diversity over time. Each dot represents a month.
What we can see here is a steady decline in CWE diversity17 from 2005 up until the publication of CWE View 1003 in 2015, where we see moderate increase but then a somewhat steady state. Figure 13 confirms what Figure 12 indicates: no subgroup of CWEs has emerged to dominate the CVE landscape to the degree that XSS did from 2011 to 2015. It is also interesting to note that the Shannon Diversity, which dipped from 2011 to mid-2014, began to rebound with the new CWE view in 2015, only to level out in 2017—at roughly the same time that we entered the current period of increasing CVE publication rates. The lack of a handful of era-defining vulnerability types in the present reflects the growing list of responsibilities facing security practitioners.
Weird Thing 6: OWASP All Over the Place
While we are talking about CWE views, a concise and popular one is the OWASP Top 10, published by the Open Web Application Security Project (OWASP), which is another online community taking on the Sisyphean task of categorizing vulns. First published in 2003, with updates published approximately every three years, the OWASP Top 10 attempts to categorize and organize CWEs by their impact on web applications at any given point in time. Ten broad categories were picked for each iteration, with a large number of CWEs filed under each of the ten.
The exact methodology for determining the top 10 is a combination of data analysis, expert interviews and good old-fashioned sitting around a table and making decisions. Given the shifting landscape and general terminology used in the security community, tracking how different classes of vulnerabilities have shifted through the OWASP top 10 over the years has been… challenging, but we take a shot at in Figure 14.
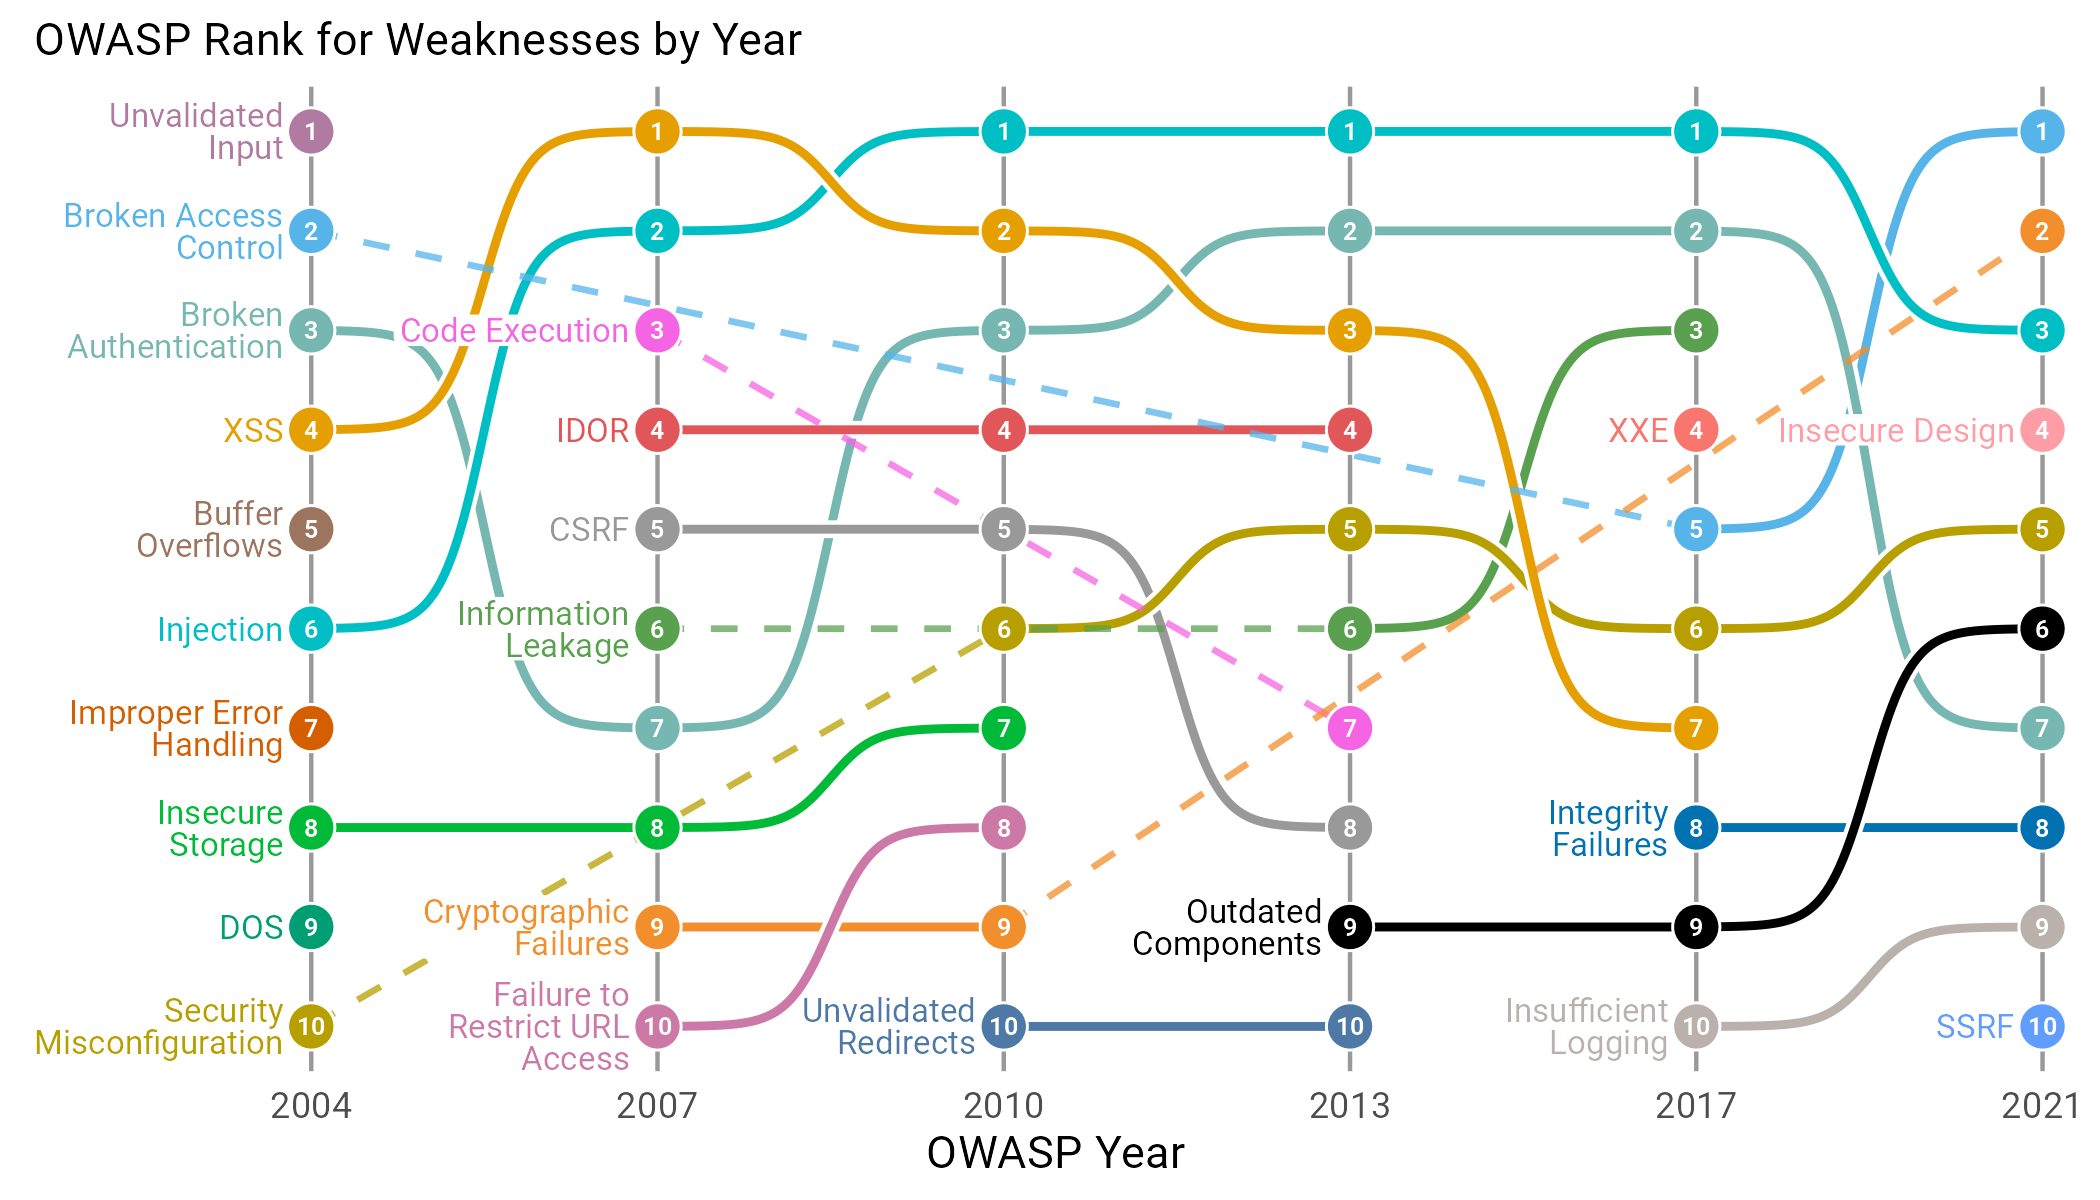
Figure 14: OWASP top 10 over different years of categorization. Color indicates weakness, with labels placed on the first OWASP year the weakness category occurred. Solid, curved lines indicate year by year rank changes, while dashed lines show continuity when a weakness does not persist year over year.
The first thing that should jump out at you in Figure 14 is that many of the categories only appear in a couple of OWASP versions. Only “Injection” and “Broken Authentication” survive through all six iterations. Meanwhile, things like “XXE”, “Unvalidated Input”, “SSRF”, “Insecure Design”, “Improper Error Handling”, “DOS”, and “Buffer Overflows” are one and done. The names themselves are not the only thing that’s inconsistent—exactly how many CWEs fall under each category is as well, as we see in Figure 15.
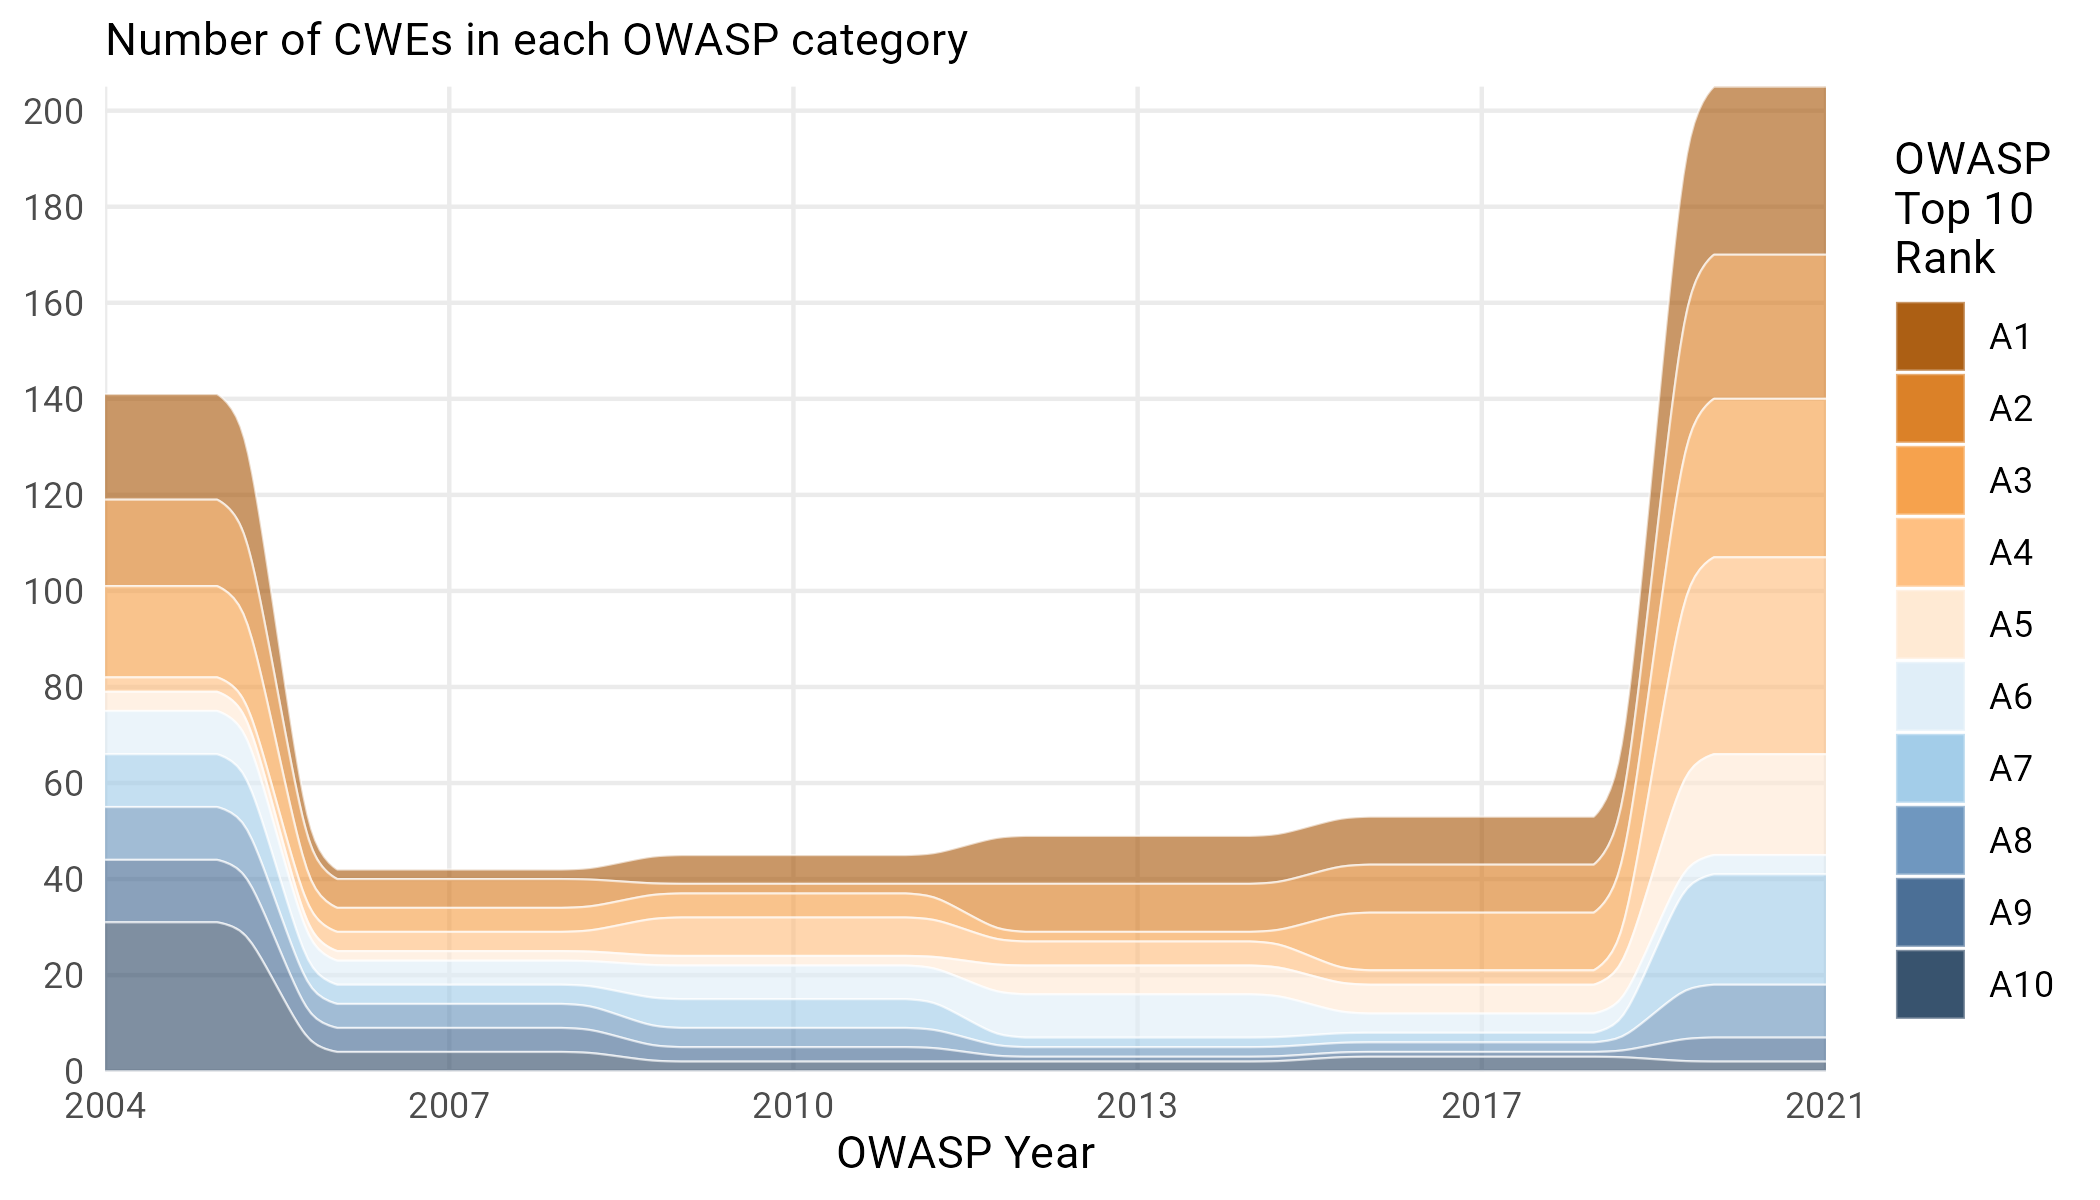
Figure 15: Number of CWEs associated with each OWASP top 10 category. We eschew the actual names here and color things by the OWASP rank precisely because of the inconsistency in Figure 13.
The first year (200418) encompassed a little over 140 different CWEs, a strange choice given that, at the time, only about 5–10 were used per month. This lowered substantially to around 50 for the next four iterations, expanding dramatically again in the most recent 2021 version. There is some correlation here with the expanded CWE 1003 view, which allowed for more categories to be encompassed within OWASP, but the jump to 200 is dramatic.
So far, this has been divorced from actual CVEs. We’ve just talked about the weirdness that encompasses the views themselves. Figure 16 examines what percentage of CVES, during a specific OWASP generation, were associated with any category.
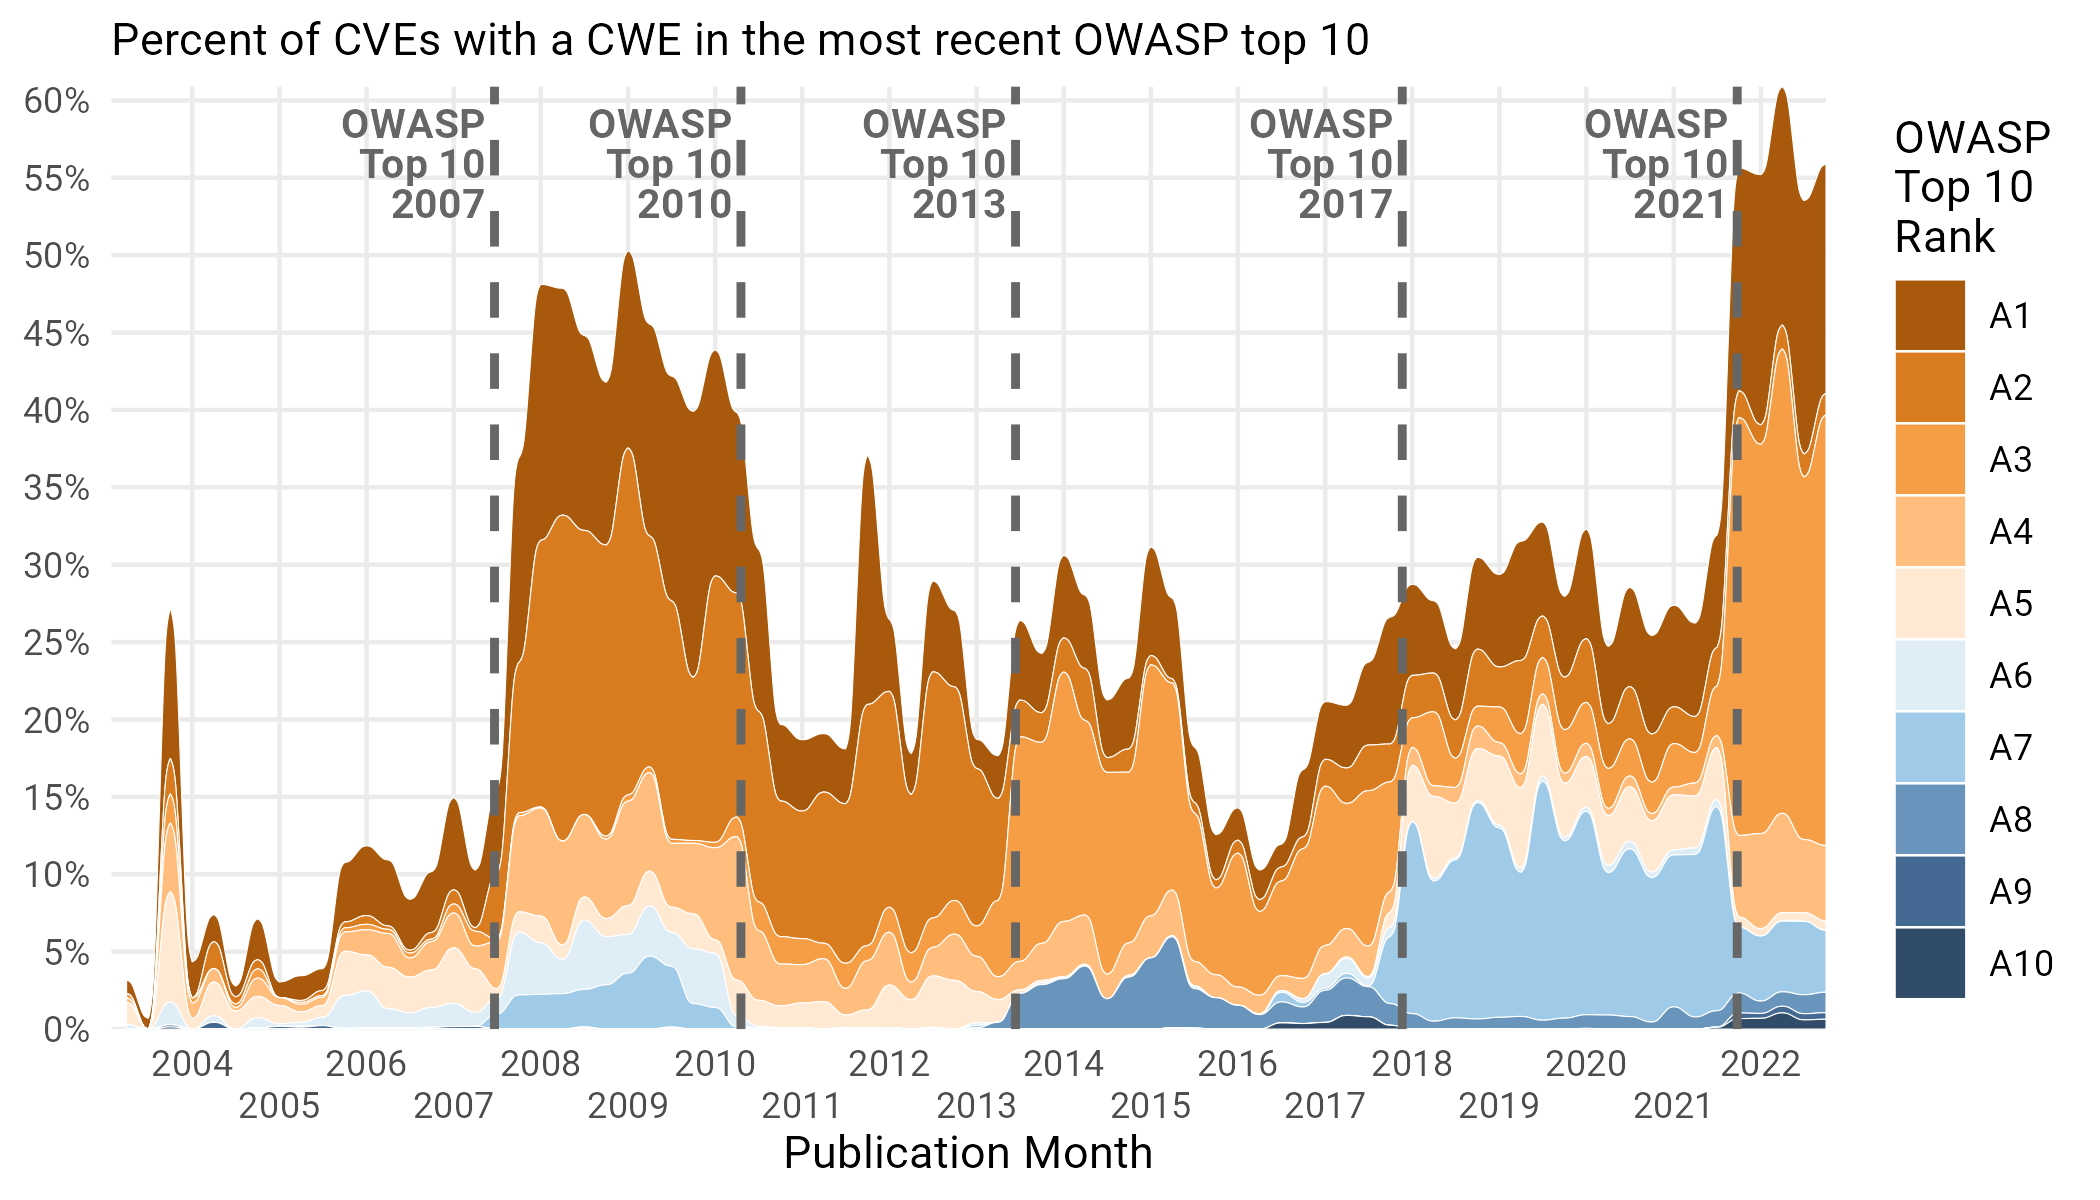
Figure 16: Percentage of CVEs associated with each OWASP top 10 Category
Interestingly, there is less of a correlation between the number of CWEs associated with the OWASP top 10 and the percentage of CVEs falling into OWASP categories than we might expect. In particular, despite covering a massive number of unique CWEs, the large majority of CVEs during the 2004 era weren’t OWASP CWEs. Contrast that with the jump in 2007, which corresponded to a decline in the unique CWEs associated with OWASP. Things get more intuitive with the latest edition, with the large expansion associated with nearly 60% of all recent CVEs falling into an OWASP top 10 category.
Interestingly, it’s A3 that composes the highest number of CVEs in this most recent era, namely because the relatively high prevalence XSS category was recategorized in 2021 under “Injection” (A3 in 2021).
Vulnerability Descriptions
One last area worth surveying in the landscape is CVE descriptions. This is also one of the hardest things to analyze since language is generally not all that amenable to data analysis (though there is a long history of this practice). But we were undeterred, and used fancy AI to do something called “Named Entity Recognition” to extract seven different entities that are important to a vulnerability. They are:
- Outcome (e.g. “denial of service”, “code execution”)
- Actor (“remote attacker”, “authenticated user”)
- Component (product or module/function/part that is vulnerable)
- Attack Vector
- Attack Pattern (CAPEC-like, blurs a bit with “weakness”)29
- Weakness (CWE-like description of problem in component)
Then, we track what percentage of CVE descriptions contain these entities over time in Figure 17.
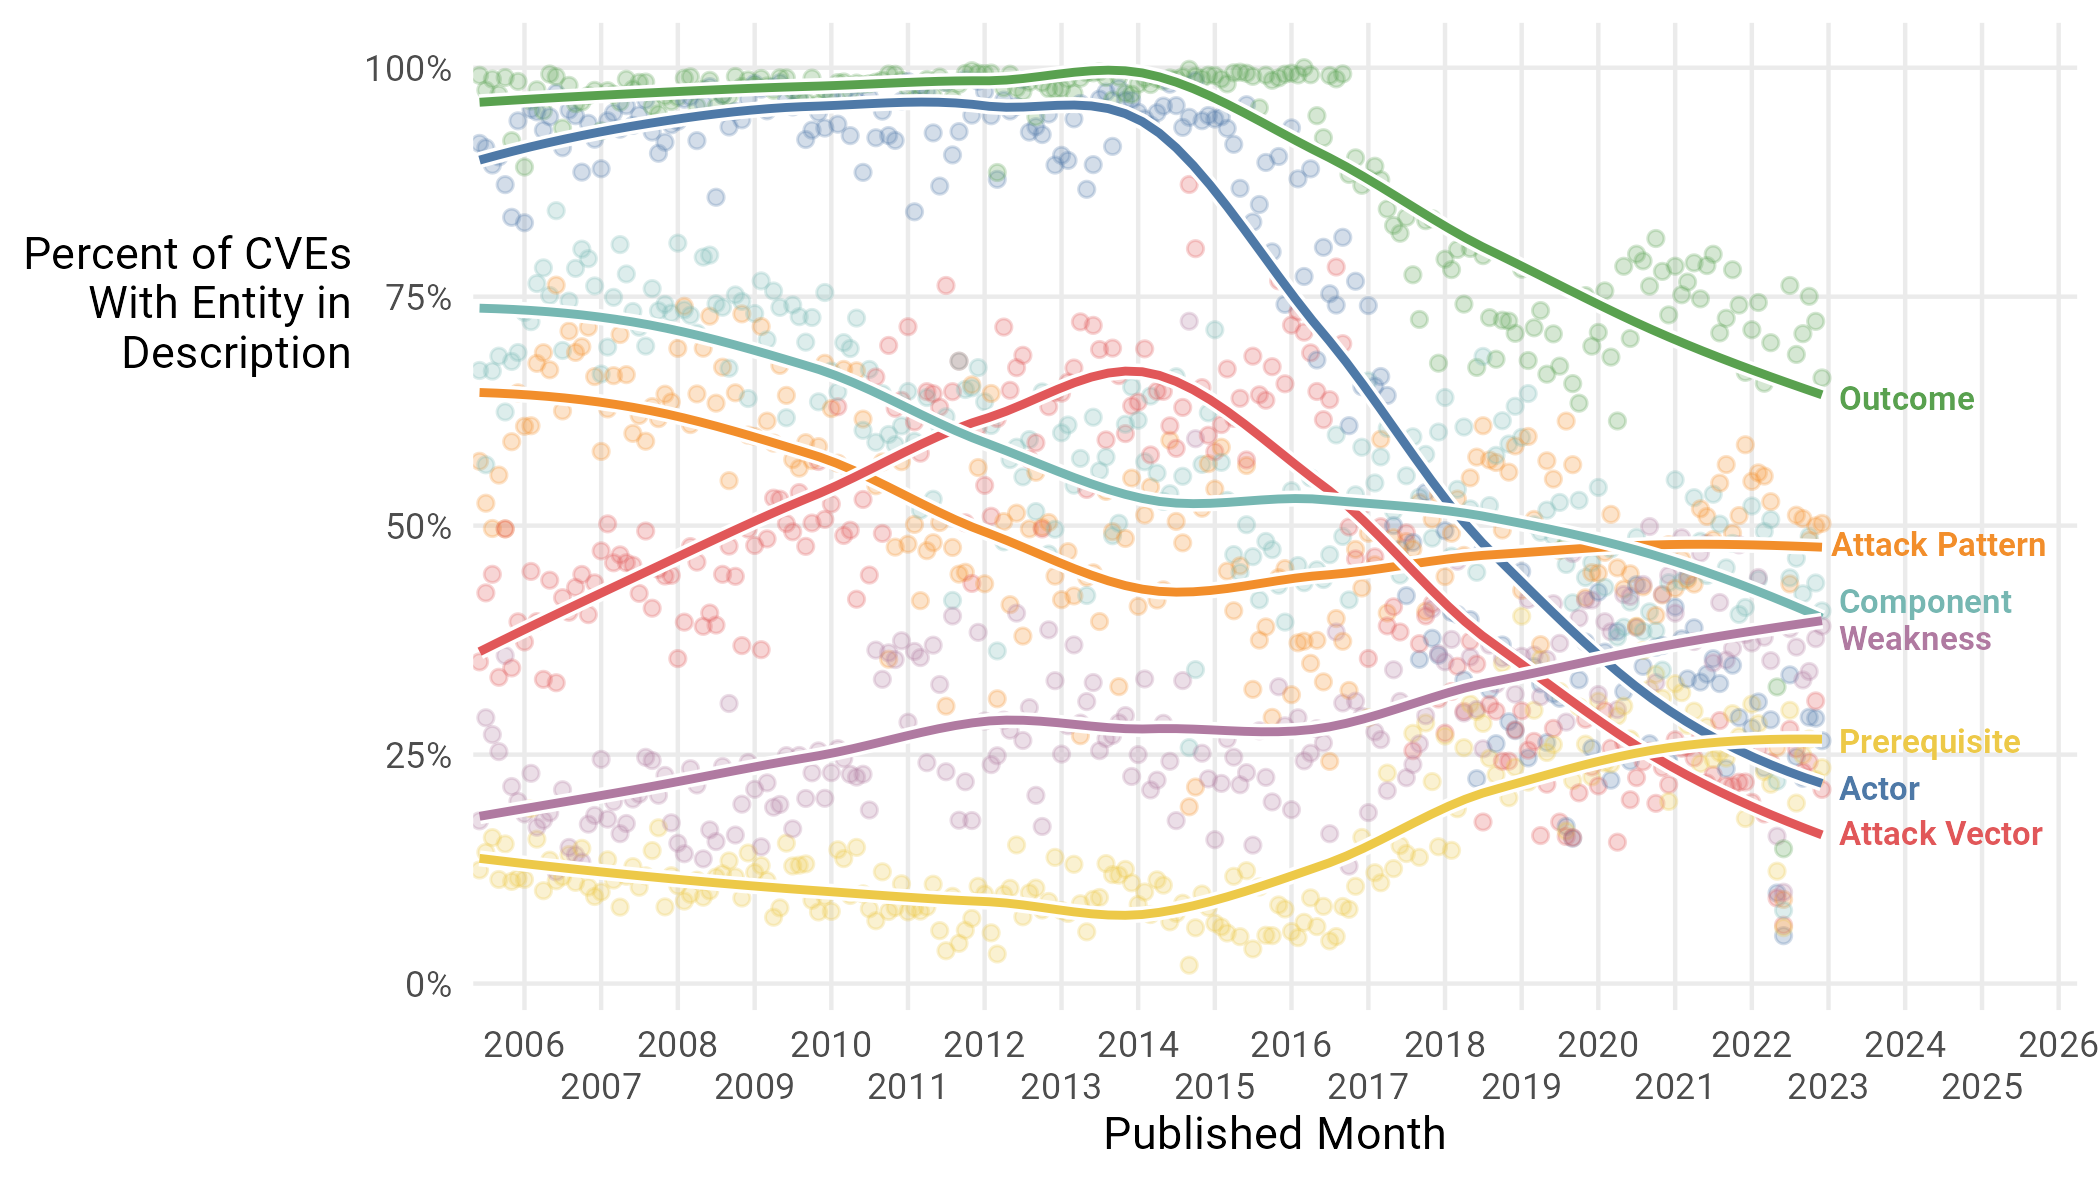
Figure 17: Named Entities mentioned in CVE descriptions over time
We note the sharp decline in things like “Outcome” and “Actor”, perhaps indicating that descriptions are getting less keen on disclosing “who could use this” and “what could happen if you do”, and are focusing more on the actual nitty gritty of the vuln—in particular, the increase in Prerequisites and Weaknesses. Smaller declines in the “Component” entity may be due to that information residing in the CPE framework. The decline in “Attack Vector” is interesting, and may be related to the development and spread of the ATT&CK framework, obviating the need to see it in the description. We note that ATT&CK was first developed in 2013, and first publicly released in May of 201519. Perhaps, this caused CVE description to start being a little less concerned about including these “ATT&CK”-y things in their prose, but we are speculating pretty hard right now.
The Dark Corners of the Landscape
We have possibly saved the most interesting questions for last, namely, exactly how bad a particular vulnerability is. We must start by pointing out that this is a hard thing to measure, and one that has spawned many different approaches to give a good answer (see CVSS,20 EPSS,21 VPR,22 and SSVC,23 among others). Each of these measures strives to capture how easy or hard a vulnerability is to write an exploit for and whether anyone does, how widespread the software it affects is, and the criticality of the machines on which that software runs. Nobody has a perfect answer, so let’s take a look at a couple of those and see how things have changed.
“Severity:” The Common Vulnerability Scoring System
The Common Vulnerability Scoring System (CVSS) is the most prominent and widely used measure of how scary a particular vulnerability is. Created by another US 4-letter agency, this time the National Infrastructure Advisory Council24, the goal of CVSS is to give a measure of “severity” of a vulnerability without having to rely on what software it affects or the explicit weakness that is the root cause.
CVSS has gone through 4 versions: 1, 2, 3, and 3.125. Each operates by creating a set of “metrics”26 that take on a handful of ordinal values. Each vulnerability is assessed on the metrics to produce a CVSS vector string. That string is then further reduced into a score using a formula. Ranges of these scores are further categorized into qualitative values of Low/Medium/High/Critical. See Figure 18 to see what proportion of vulns over time that are scored by each generation have each type of score.
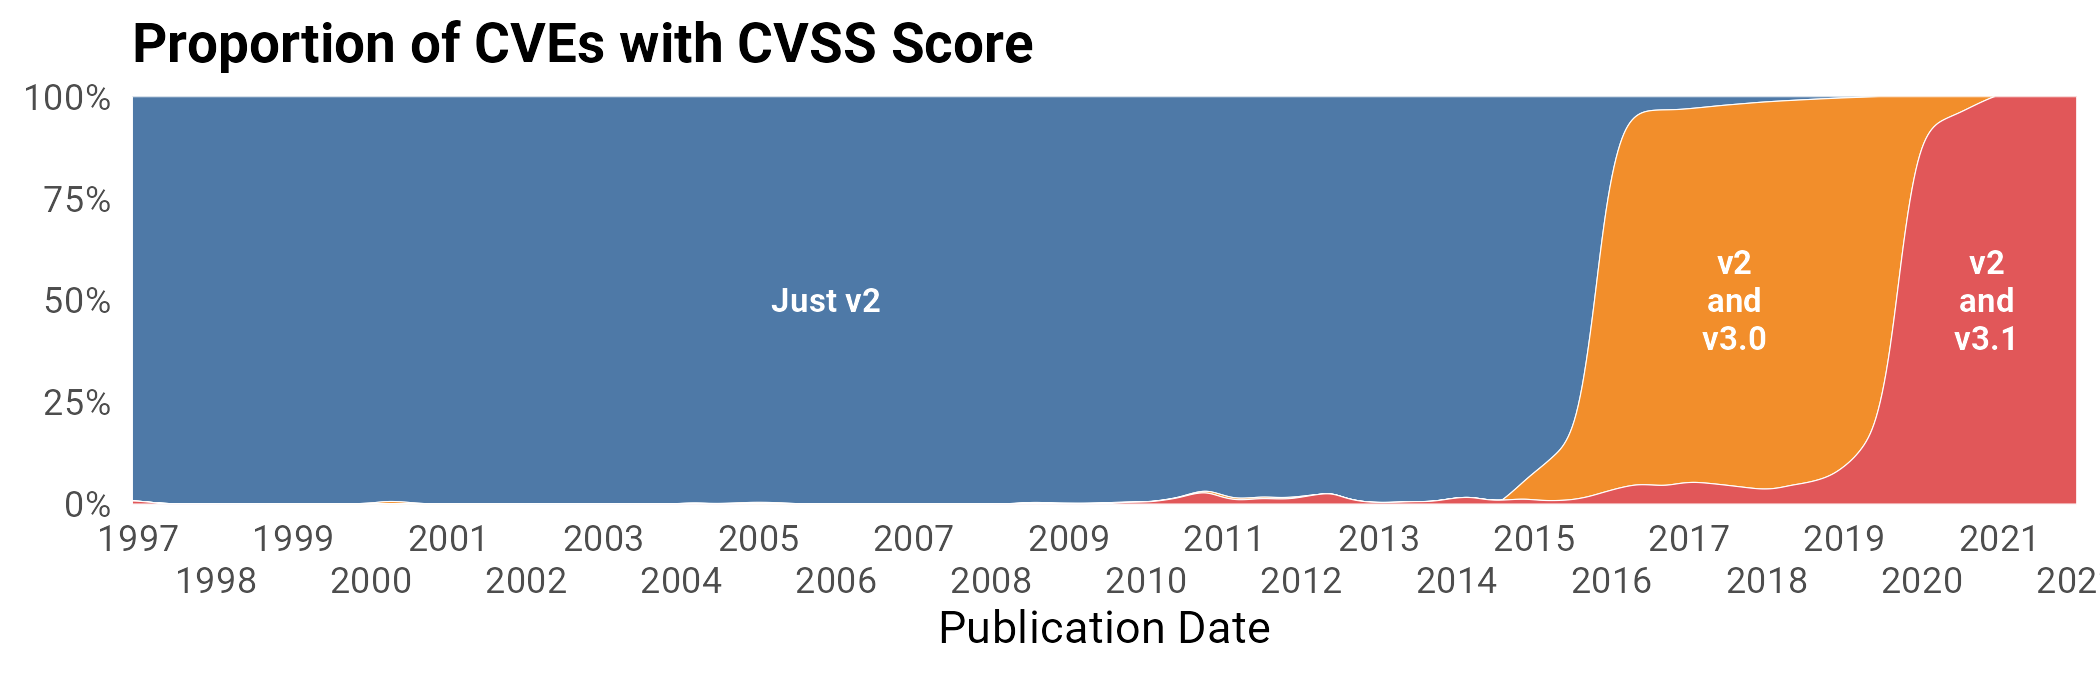
Figure 18: Distribution of CVEs with each version of CVSS scores.
Over time, other scores have been added that try to capture other aspects of severity. For example, version 3 includes definitions for “temporal scores” which track whether exploit code and patches are available, as well as “environmental” scores that track how exploitation of a vulnerability might affect the wider network the vulnerable computer resides on. In practice, the focus is on the base score, with NVD not publishing information on temporal and environmental scores. We’ll try to explore exploit code in a different way in the next subsection.
The first question we might ask of CVSS is “are vulnerabilities getting more severe?” Figure 19 takes a look at this.
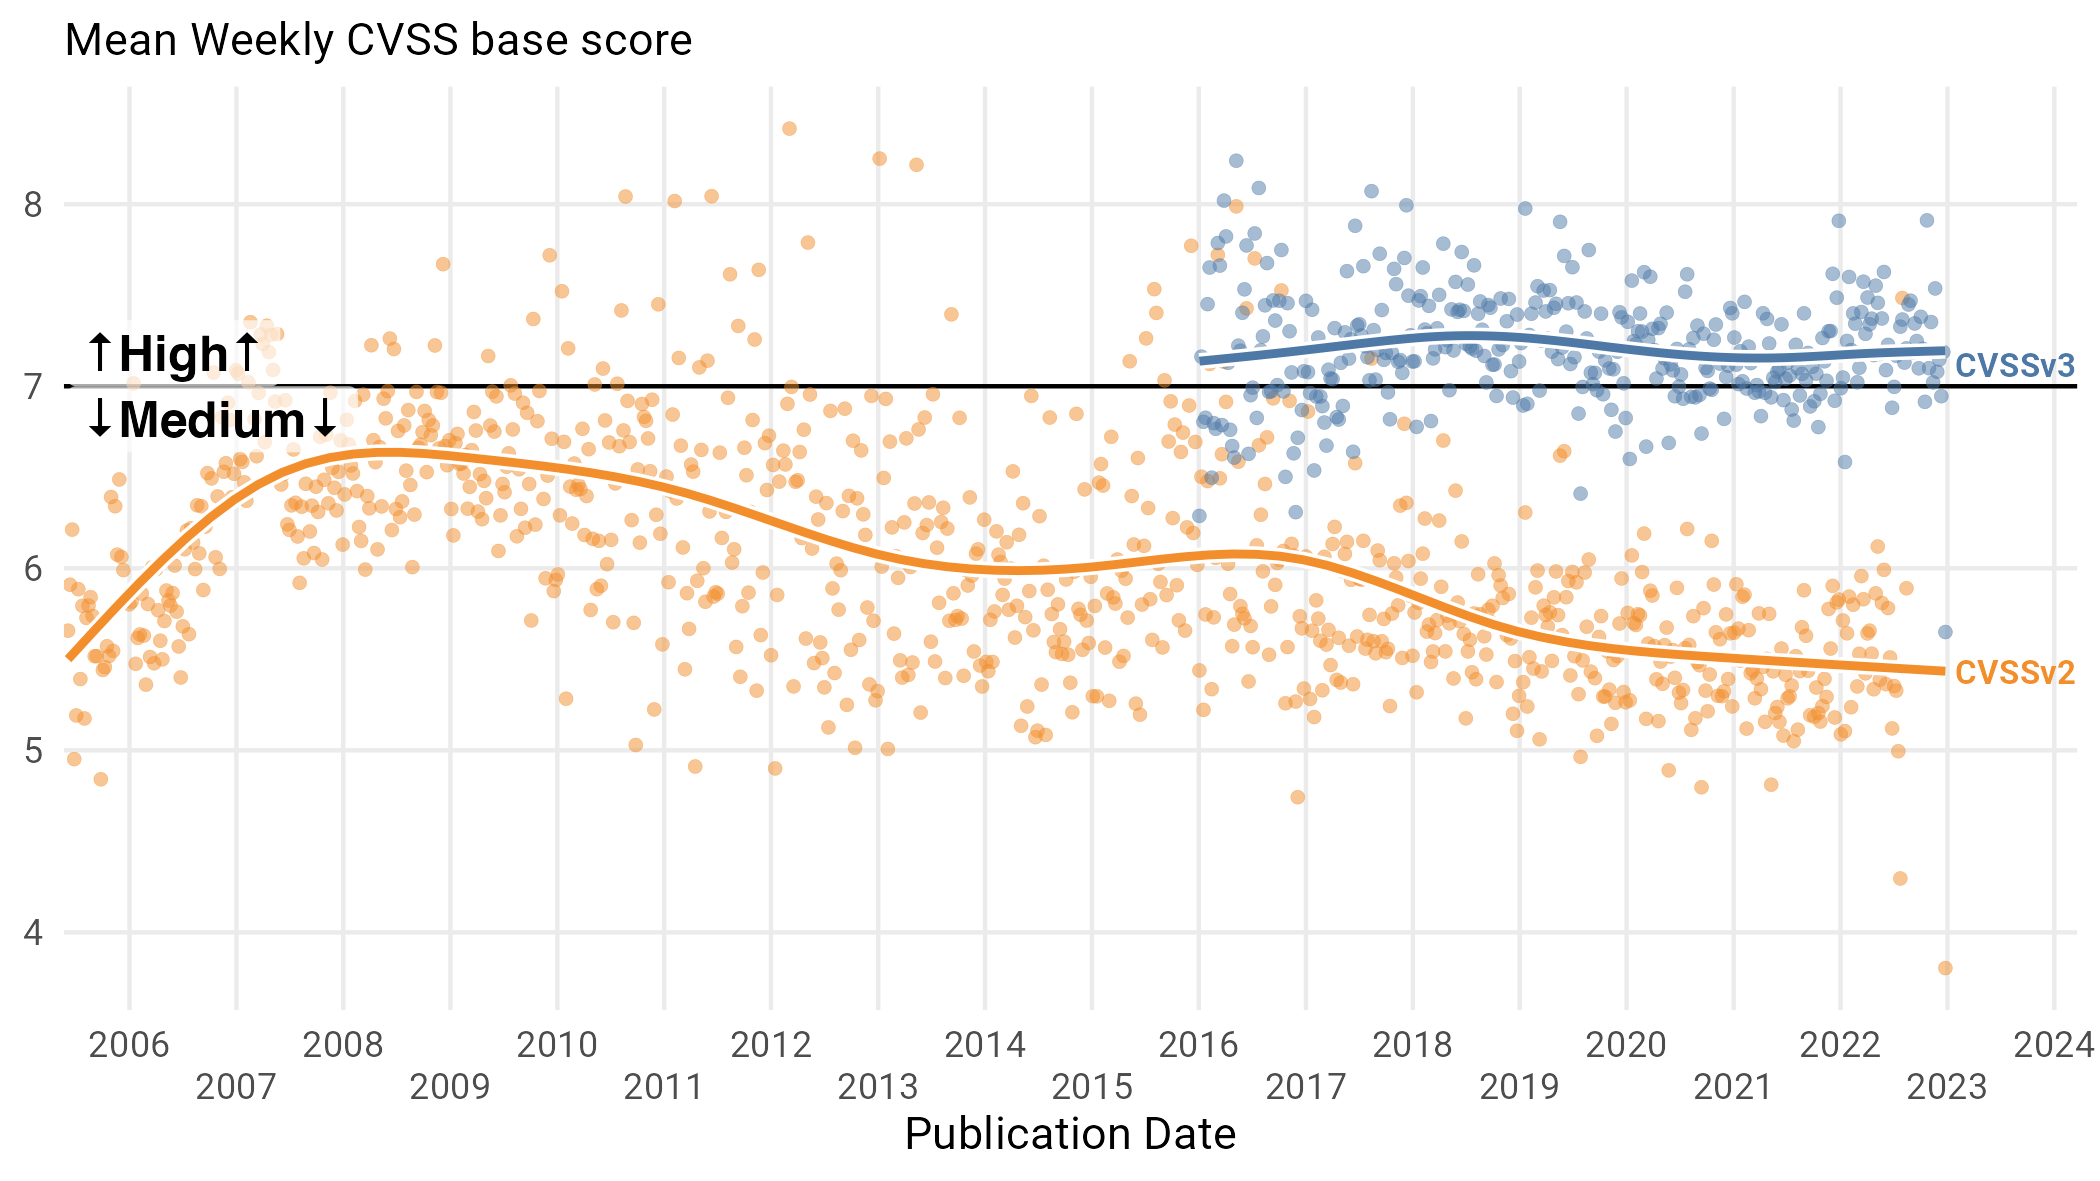
Figure 19: Mean CVSS severity over time for CVSSv3 and CVSSv2.
If we look at the average score over time, things aren’t getting worse, no matter whether we measure it with version 2 or version 327. What’s interesting here is that the decisions that lead to the creation of CVSSv3 make vulnerabilities, on average, more severe, jumping from averaging “Medium” to “High”. This is another data collection decision that might make one jump to the conclusion that vulnerabilities are more severe now (average of high!) when it was really just a bureaucratic change.
Weird Thing 7: When We Can’t Agree on a CVSS Score
Both CNAs and NVD score vulnerabilities, and they don’t always agree with one another. We won’t highlight quibbles about a tenth of a point in the base score, but there are often (see Figure 20) disagreements on the qualitative measures (Critical/High/Medium/Low/None) of severity.
Perhaps most interesting is the handful of vulns that the CNA thinks are not vulns at all, including four that NVD thinks are critical. In other words, CNA has insisted that these vulnerabilities don’t affect any of the Confidentiality, Integrity, and Availability triad.
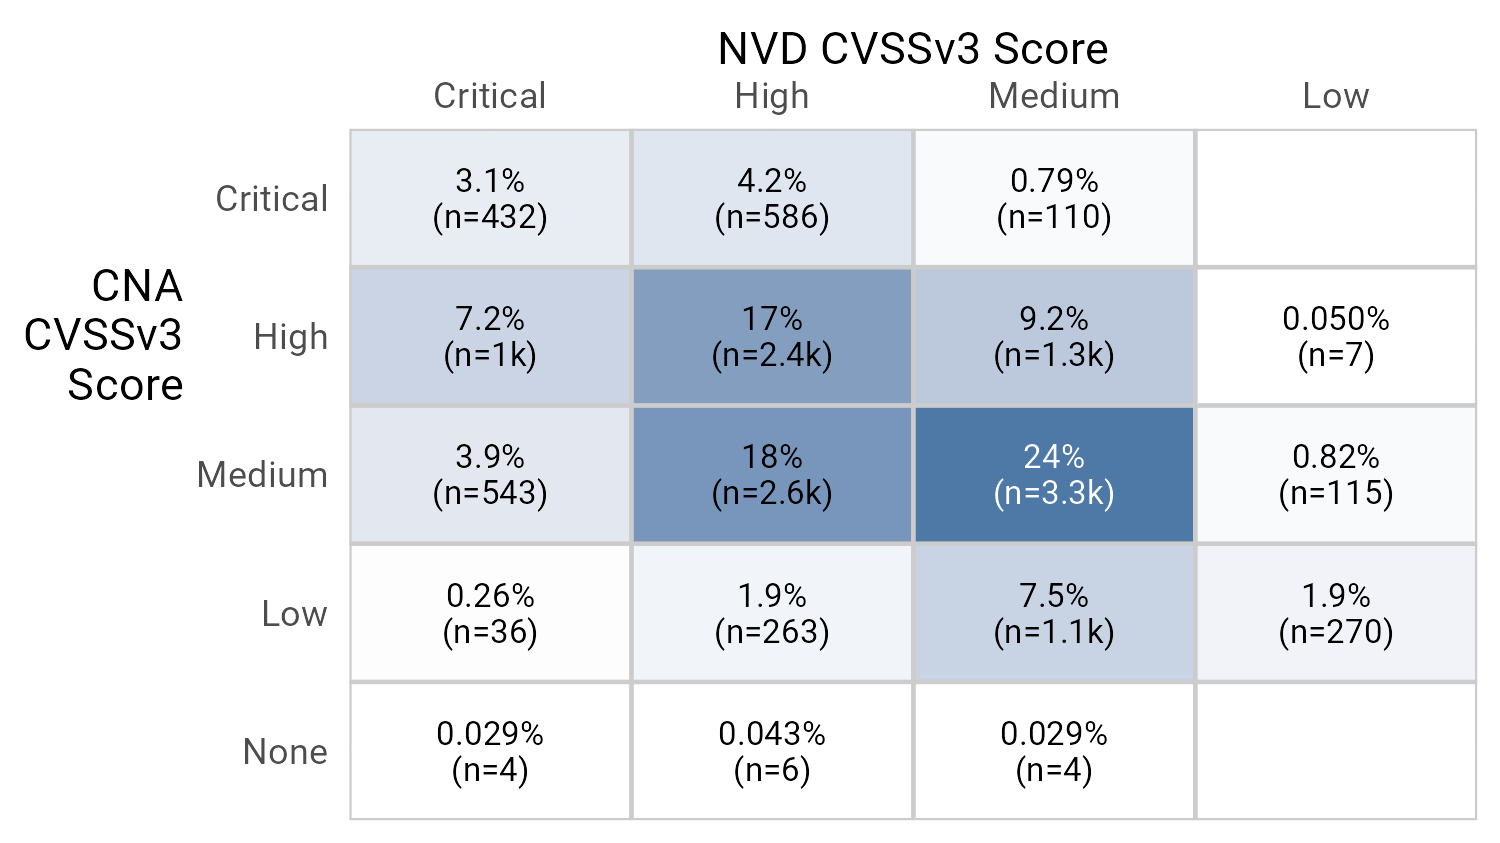
Figure 20: Disagreement about CVSSv3 Score.
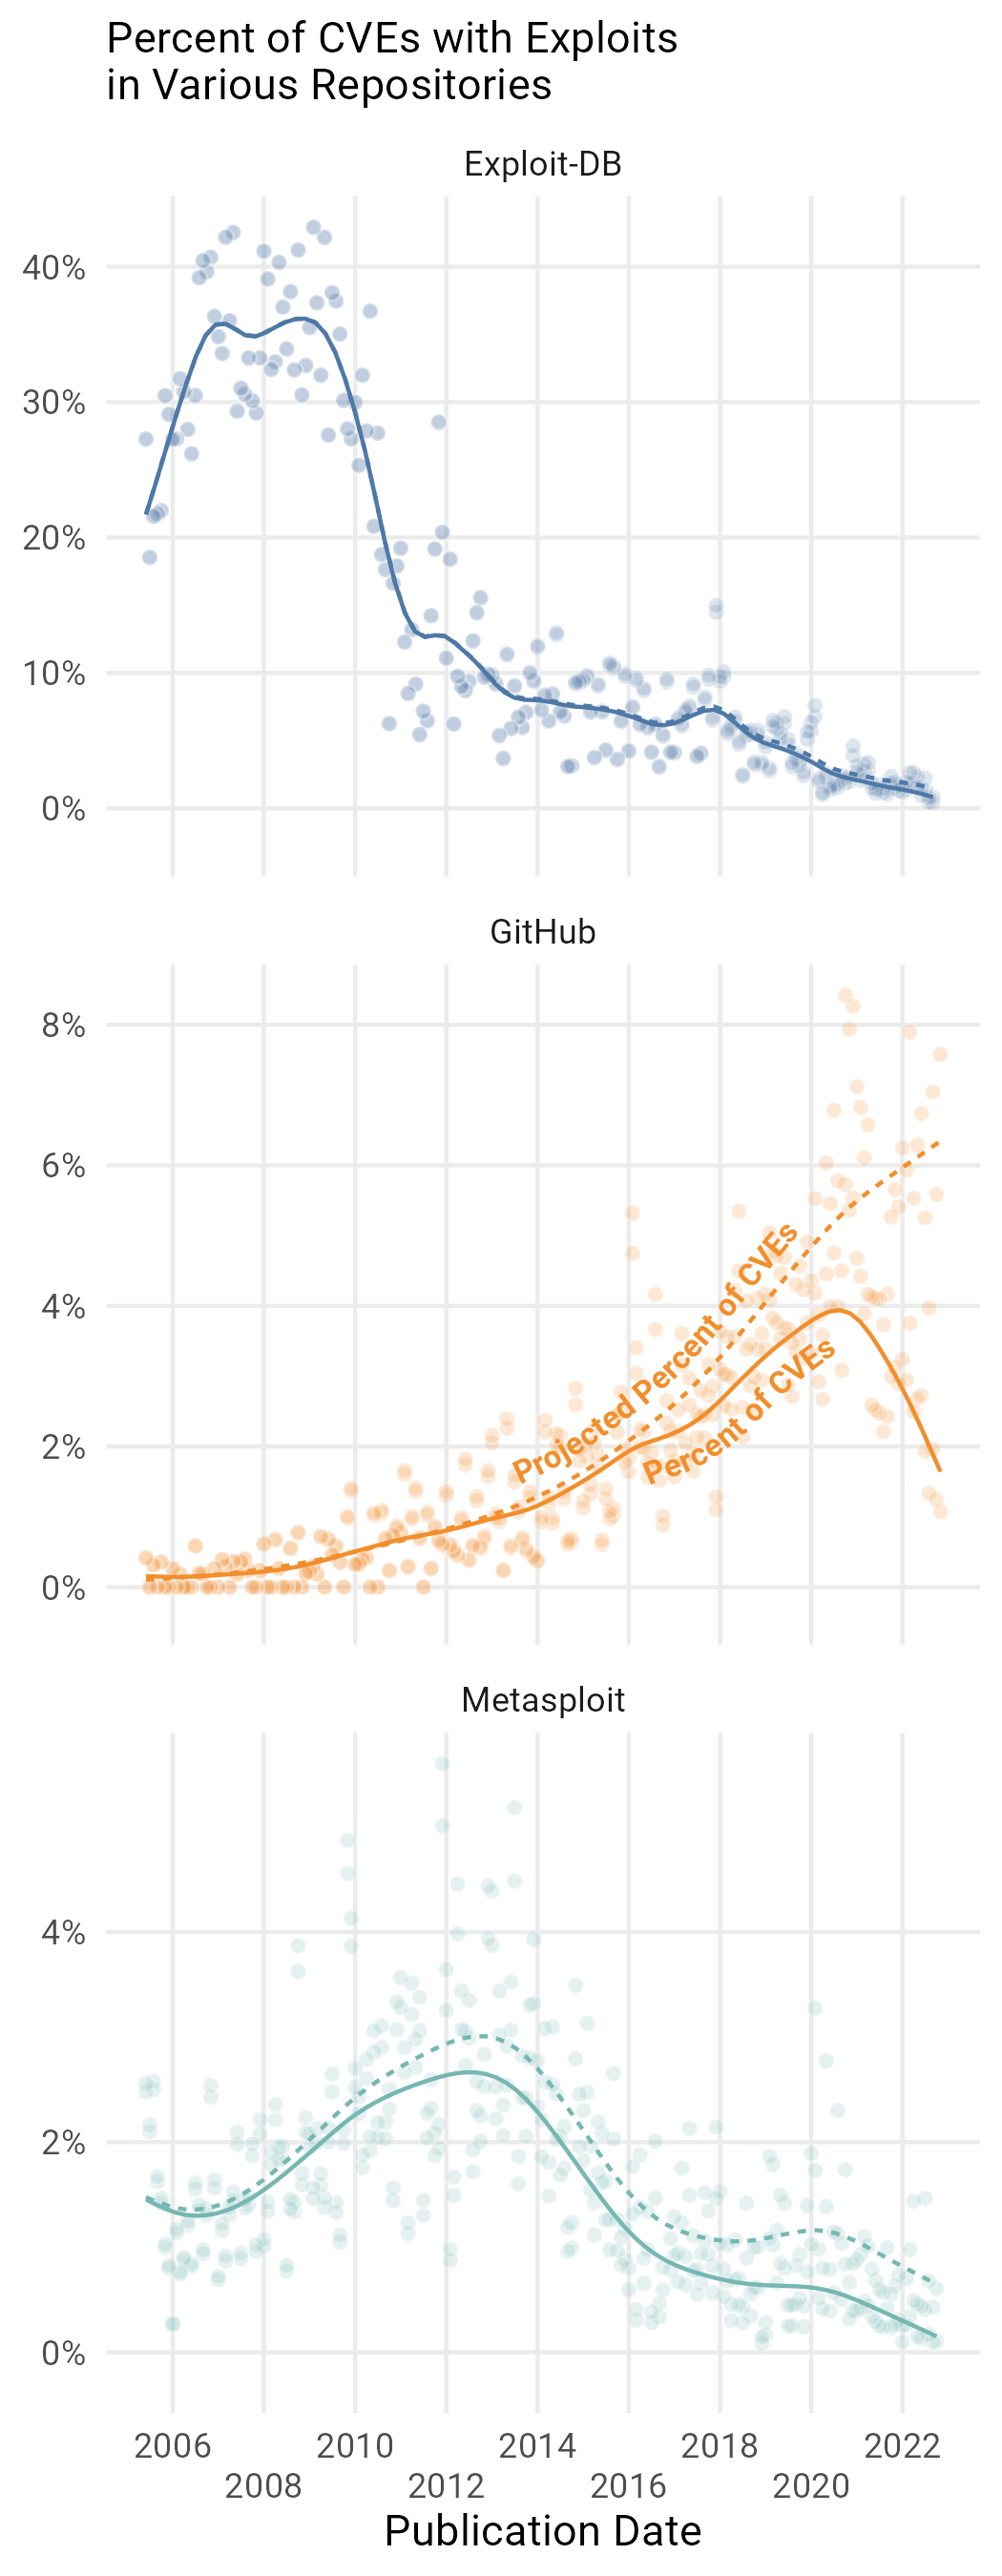
Figure 21: Percent of CVEs published in a particular month in each exploit data source. Note the vertical axis changes for each source.
Exploit Code
We shouldn't fear things just based on CVSS, but also understand whether attackers can leverage them using code found in the wild. We scraped three different sources to see how likely it is that an exploit has code in the wild. In particular, we examined two large repositories of exploit code (ExploitDB and Metasploit) and one major repository of source code (GitHub).
There is more than a little bit we could say about scraping these sources. GitHub, in particular, is challenging as we can’t just look for a mere mention of a CVE to indicate that a repository contains exploit code. We’ve built some more fancy machine learning models to try to determine this, and we hope Cyentia has built up enough clout in the community for you to trust us. If you want more info, though, you can read this blogpost28. On top of that, we tried to do our best to account for the lag between when a vulnerability is published and when it shows up in each of the below repositories to try to project how many vulnerabilities published on a particular date are eventually going to show up with source code in a given repository. We try to capture the results in Figure 21.
ExploitDB used to be the place, with as many as 40% of vulns appearing in the DB around 2008, but has seen a steady decline in use. Metasploit similarly peaked in 2012, though at a much lower rate of at most 6%. GitHub is the only source currently increasing. Things are a little messier, but we see GitHub as a continued source of PoC for vulnerabilities.


