We are excited to announce that F5 Labs has become a data partner of the Exploit Prediction Scoring System (EPSS).1 The Internet-wide scanning and attempted exploitation activity that makes up our Sensor Intel Series also happens to be good training data for the machine learning system under EPSS’ hood.
F5 Labs wrote about EPSS in early 2020, a few months after it was unveiled at Black Hat 2019.2 In that article, we explored the vulnerability characteristics that the system was collecting for analysis at runtime, and used a specific example and the weightings for the most significant parameters in the model to calculate an EPSS score by hand.
Since then, however, EPSS has grown in prominence and adoption, the ML model is on its third iteration, and the performance is improved. We recently shipped our first batch of CVE-focused attack data to the EPSS team, so now seems like a good time to review what EPSS is, why we think it’s important, and how we fit into the picture.
What Is EPSS and What Problem Is It Solving?
The Exploit Prediction Scoring System is designed to help security teams prioritize vulnerability mitigation by calculating the 30-day likelihood that any given vulnerability will be exploited by an attacker. The need for this stems from two observations that security researchers have made in the last decade: the first is the observation that there are simply too many vulnerabilities in enterprise tech footprints to patch them all. A joint study by Kenna and Cyentia in 2019 found that across all enterprise sizes, organizations tend to mitigate about 10% of the open vulnerabilities in their systems.3
The other observation is that a surprisingly small subset of vulnerabilities is exploited in the wild by attackers—around 5-6%.4 This means that patching 100% of open vulnerabilities is not only impossible in the long term, it is unnecessary. Patching all vulnerabilities would result in a lot of arguably unnecessary work since ~95% of those vulnerabilities represent minimal risk.
The problem, therefore, is to come up with a system to triage vulnerabilities so that we can use our limited remediation time to greatest effect. In theory the Common Vulnerability Scoring System (CVSS) should suffice, but this system has some limitations, most of which stem from the way that people use and interpret the scores.5 EPSS was specifically designed to outperform CVSS at the problem of ongoing vulnerability triage, and it does this through machine learning.
EPSS’ Machine Learning Model
At their most abstract, all machine learning systems require two kinds of inputs: training inputs and runtime inputs. The training inputs are used to determine optimum parameter weights for the model, and the runtime inputs are what the model then processes to produce its output. For EPSS the runtime inputs are a collection of roughly 1,500 vulnerability characteristics that are collected and updated daily. These are variables such as the existence of publicly available exploit code, the vendor of the affected system, and the technical impact of the vulnerability (such as remote code execution or directory traversal). Over the course of training the model will determine the relative importance of each of these variables to each vulnerability.
The daily update of these variables is one of the things that makes EPSS so useful. While CVSS has a temporal dimension, many organizations omit it and use CVSS as a static score. Since the true likelihood of exploitation is dynamic and ebbs and flows as these variables change, so does the EPSS score, which is why it is recalculated daily.
In addition to the runtime data, the ML system requires training data that it can use to determine the parameter weights. For this it needs many examples of attacker exploits in the wild. F5 Labs has just started contributing our own observations (more on this below) but EPSS also collects exploitation data from Cisco, AlienVault, Fortinet, GreyNoise, and others. Since this is a supervised learning model, these exploit attempts serve as annotations or data labels that provide feedback to the model as it determines weights. Perhaps the best way to understand this is to take an example and work backwards. If the “code execution” parameter is one of the most highly weighted in the EPSS system (Figure 1), we can reasonably infer that this characteristic showed up more often among the exploited CVEs in the training data irrespective of other characteristics like affected platform or natural language descriptions.
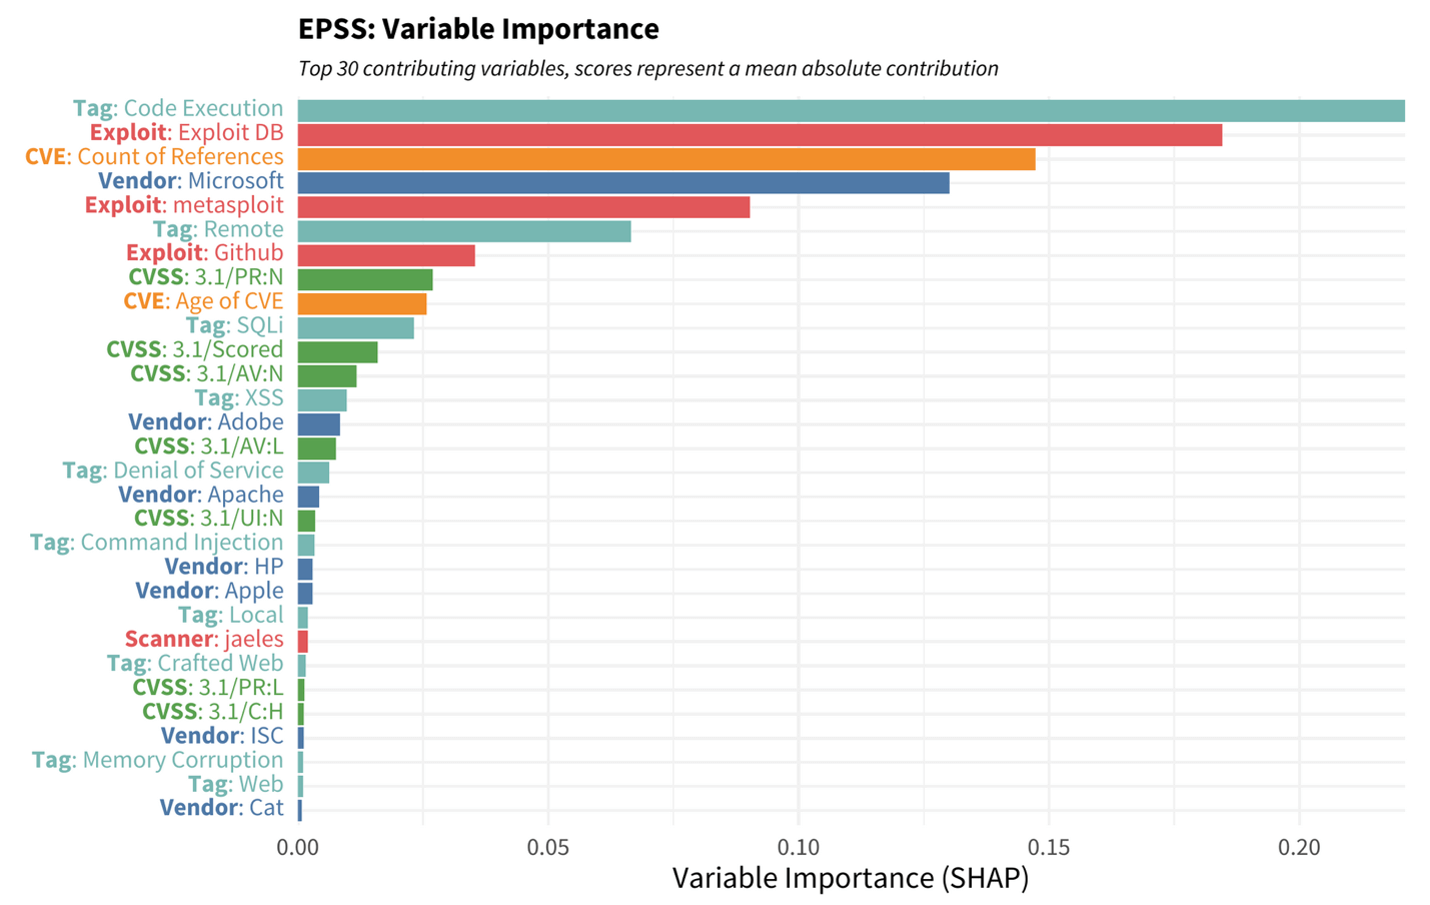
Figure 1. EPSS parameter importance as calculated by Shapley Additive Explanations (SHAP). Higher values indicate a parameter that has a greater effect (positive or negative) on the exploitation outcome. Note that in this model parameter weights vary by CVE. Image credit FIRST https://www.first.org/epss/model
The first design of EPSS used logistic regression, but subsequent models (v2022.01.01 and v2023.03.07) have used Boosted Gradient decision trees (XGBoost). This is an ensemble model, which means that it creates many different decision trees with slight variations and takes an aggregate output from all of them. In the case of XGBoost, the model progressively adds only those trees that are helpful to the model, until further additions fail to improve its predictive capacity.6
The subsequent generations of EPSS using XGBoost perform significantly better than the first version using logistic regression, but in order to really understand the performance gains, we need to first understand how errors manifest in a system like this.7 To evaluate the predictions against subsequent exploitation observations, we need to choose a score threshold above which we would patch. The threshold (e.g. patching all CVEs with an EPSS score of 0.5 or higher) would in turn allow us to identify two kinds of errors: false positives and false negatives.
In the context of exploit prediction, a false positive at any given score threshold would be a vulnerability whose EPSS score exceeded the threshold and was therefore patched, but was in fact not exploited in the 30-day timeframe. Patching this vulnerability would represent poor prioritization and a “premature remediation.” A false negative would be a vulnerability that was not patched because its EPSS score was below the given threshold, but was actually exploited. Not patching this vulnerability would constitute additional risk to the organization.
With the understanding that each EPSS patching threshold will produce different rates of false positives and false negatives when compared with true exploitation activity, it is possible to plot these error rates for all thresholds in a Recall/Precision plot (Figure 2). Recall (also termed Coverage in this case) is the proportion of exploited vulnerabilities that were patched at a given threshold. This can be thought of as a measurement of how much “true” risk was mitigated. Precision (also termed Efficiency here) is the proportion of patched vulnerabilities that were actually exploited. This can be thought of a measure of how much work was on mistakenly prioritized risks that did not materialize. This kind of analysis allows us to visualize the tradeoffs of different thresholds (and therefore different mitigation strategies) across the different generations of models.
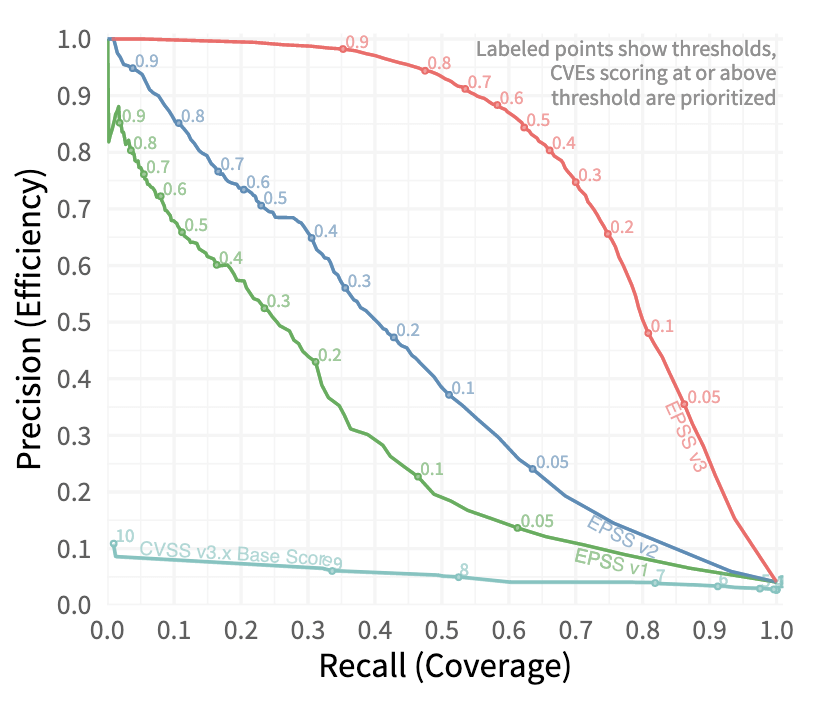
Figure 2. Recall-precision graph for EPSS and CVSSv3. This plot shows the tradeoffs in coverage (% of exploited vulnerabilities remediated) and precision (% of remediated vulnerabilities exploited) for different thresholds and management strategies. Note that all three EPSS versions shown here dramatically outperform CVSS as a triage tool. Image credit https://arxiv.org/pdf/2302.14172.pdf.
For instance, an extreme strategy intended to minimize false negatives by patching every single exploited vulnerability (100% Recall/Coverage) would only have an Precision/Efficiency of ~4%, even for the latest v3 model. In other words, this strategy would catch all of the exploited vulnerabilities, but 96% of the patched vulns would be mis-prioritized and prematurely remediated. At the other extreme, a strategy intended to minimize false negatives by mitigating only exploited vulnerabilities (100% Efficiency/Precision) would have a coverage of only 2% or so, meaning that 98% of exploited vulnerabilities would go unpatched.
The progressively greater areas under the curves for EPSSv2 and particularly v3 indicate that they outperform their predecessors at all levels of effort or thresholds of risk, and dramatically outperform CVSSv3. The convexity of the curve for v3 is particularly notable since it means the tradeoffs are much smaller—note that the Efficiency/Precision does not begin to suffer significantly until Recall/Coverage goes past 50% (at a threshold of roughly 0.75), indicating that using v3 thresholds for action would result in significantly better prioritization than v2 at any risk appetite.
Where Does F5 Labs Come In?
In June 2022 F5 Labs debuted the Sensor Intelligence Series (SIS), which analyzes sensor logs to produce vulnerability targeting intelligence. The raw data comes from our long-standing data partner Efflux, who maintain a globally distributed network of passive sensors to log reconnaissance and opportunistic attack traffic (as well as a good deal of benign scanning traffic).8 Once we get the data, we transform it and match it against CVE signatures to better understand which vulnerabilities are highest priority for attackers at any given time.
On the surface SIS and EPSS have a few things in common, but they differ in several significant respects: most notably, SIS isn’t an ML system (though this might change, stay tuned), and relies on relatively simple signatures to identify vulnerabilities from HTTP request parameters. The differences in terms of input variables are also subtle but important. In EPSS, exploitation likelihood is treated as a dependent variable which varies according to the characteristics of a vulnerability. In the SIS, the exploitation volume is used as an independent variable which we use to try to forecast rapid changes in attacker attention. In short, EPSS is forecasting based on vulnerability characteristics and the SIS is forecasting based on traffic characteristics and volume.
The confusing bit is that the exploitation volume is still consumed by EPSS as a label (i.e. as a ‘y-value’) during training (as opposed to runtime). However, this is also what makes SIS useful to EPSS. Our output is one of their inputs.
The Importance of Vulnerability Intelligence
In February 2023 F5 Labs published a report in collaboration with the Cyentia Institute which examined the evolving CVE landscape. The conclusions of this report were varied and complex, but two stood out. The first was the observation that the rate of vulnerability publication is increasing steadily, so that the magnitude of the triage task facing security teams is growing inexorably larger. Another way to put this is that even leaving aside the question of successful triage, just maintaining that 10% mitigation rate will take an expansion in mitigation capacity. This means that vulnerability intelligence in any form—whether it is focused on vulnerability characteristics, attack observations, or both—will become more valuable to defenders.
The second was that all of the subjectivity and uncertainty surrounding the CVE system are not symptoms of poor design nor execution, but reflective of the messy process of communicating between humans with dramatically varied needs and priorities. Furthermore, it became clear that the CVE system itself is the foundation and primary component in all vulnerability intelligence. We should celebrate CVE publications from organizations even when they mess up our weekends, both because the alternative would be a zero-day exploit, and because without the CVE system, tracking, analyzing, and communicating about vulnerabilities at scale would become practically impossible. As for the fuzziness in the CVE system, well, that’s what EPSS and similar efforts are for.


