The F5 Security Incident Response Team (F5 SIRT) helps customers tackle security incidents in real time. In 2020, we wrote about what happened in the beginning of the pandemic based on F5 SIRT cases. Now we're looking back at all F5 SIRT cases from the beginning of 2018 to the end of 2020. We’re going to break down what changed and what didn’t in the cyberthreat landscape because of the pandemic. To protect customer confidentiality, we do not mention specific organizations. We won’t divulge specific numbers, but instead compare increase levels in incident reports. But first, a quick summary of our findings before we dig deeper:
- In an average year, password login attacks made up 32% of all reported security incidents.
- U.S. and Canadian organizations had the highest percentage (45%) of reported password login attack incidents.
- Organizations based in Asia, the Pacific, People's Republic of China, and Japan (APCJ) had the highest percentage (57%) of reported denial-of-service (DoS) attack incidents, followed by organizations based in Europe, the Middle East, and Africa (EMEA) at 45%.
- Financial service organizations had the highest percentage (46%) of reported password login attack incidents, followed by public sector organizations at 39%.
- Service providers and educational organizations had the highest percentage (59%) of reported DoS attack incidents.
- Four percent of all reported security incidents were API-related, with 75% of those incidents involving password login attacks—38% of the reported API security incidents were from financial service organizations and 13% were from service providers.
A Note on Classifications
When we talk about password login attacks, it means we combined incident data on brute force attacks with credential stuffing attacks. Both attack types involve automated attempts to log in that usually overwhelm a victim’s authentication system. Denial-of-service (DoS) attacks encompass the entire gamut of distributed DoS attacks (/content/f5-labs-v2/en/archive-pages/education/what-is-a-distributed-denial-of-service-attack-.html), including direct denial attacks on DNS systems. We discuss these nuances in more detail below.
Trends and Leaders
The F5 SIRT takes calls from customers around the world in all major industry sectors. But before we discuss the details, let’s make sure we’re not comparing apples to kumquats. Since our data set is from F5 customer reports, and we know that our customer base is not perfectly distributed across all regions and industry sectors, we don’t want our analysis to be skewed or one region or sector to be overrepresented in the data. So, we need to resolve this before comparing.
What we’ve done is compare the percentages of the reported incidents within a category. For example, if we see a hundred security incidents from the elven shoe manufacturing sector and 30 of them are DoS attacks, we’ll report that as “30% of elven shoemakers reported DoS attacks.” Then, we can compare this percentage against others, such as, “But we also see that only 10% of goblin sock knitters reported DoS attacks.”
Regional Differences
For this report, we break out regions. Specifically, U.S./Canada, EMEA, Latin America (LatAm), and APCJ. Some regions see more of some types of attacks than others. Password login attacks are the most reported type of incident in the United States and Canada, at 45% of all their reported incidents (see Figure 1).
DoS attacks were the highest reported calls for APCJ (57%) and second highest for EMEA (47%), as shown in Figure 2.
Why is APCJ so much higher than U.S./Canada? We suspected there was something more to the story there, so we took a closer look at how DoS changed regionally over time (see Figure 3).
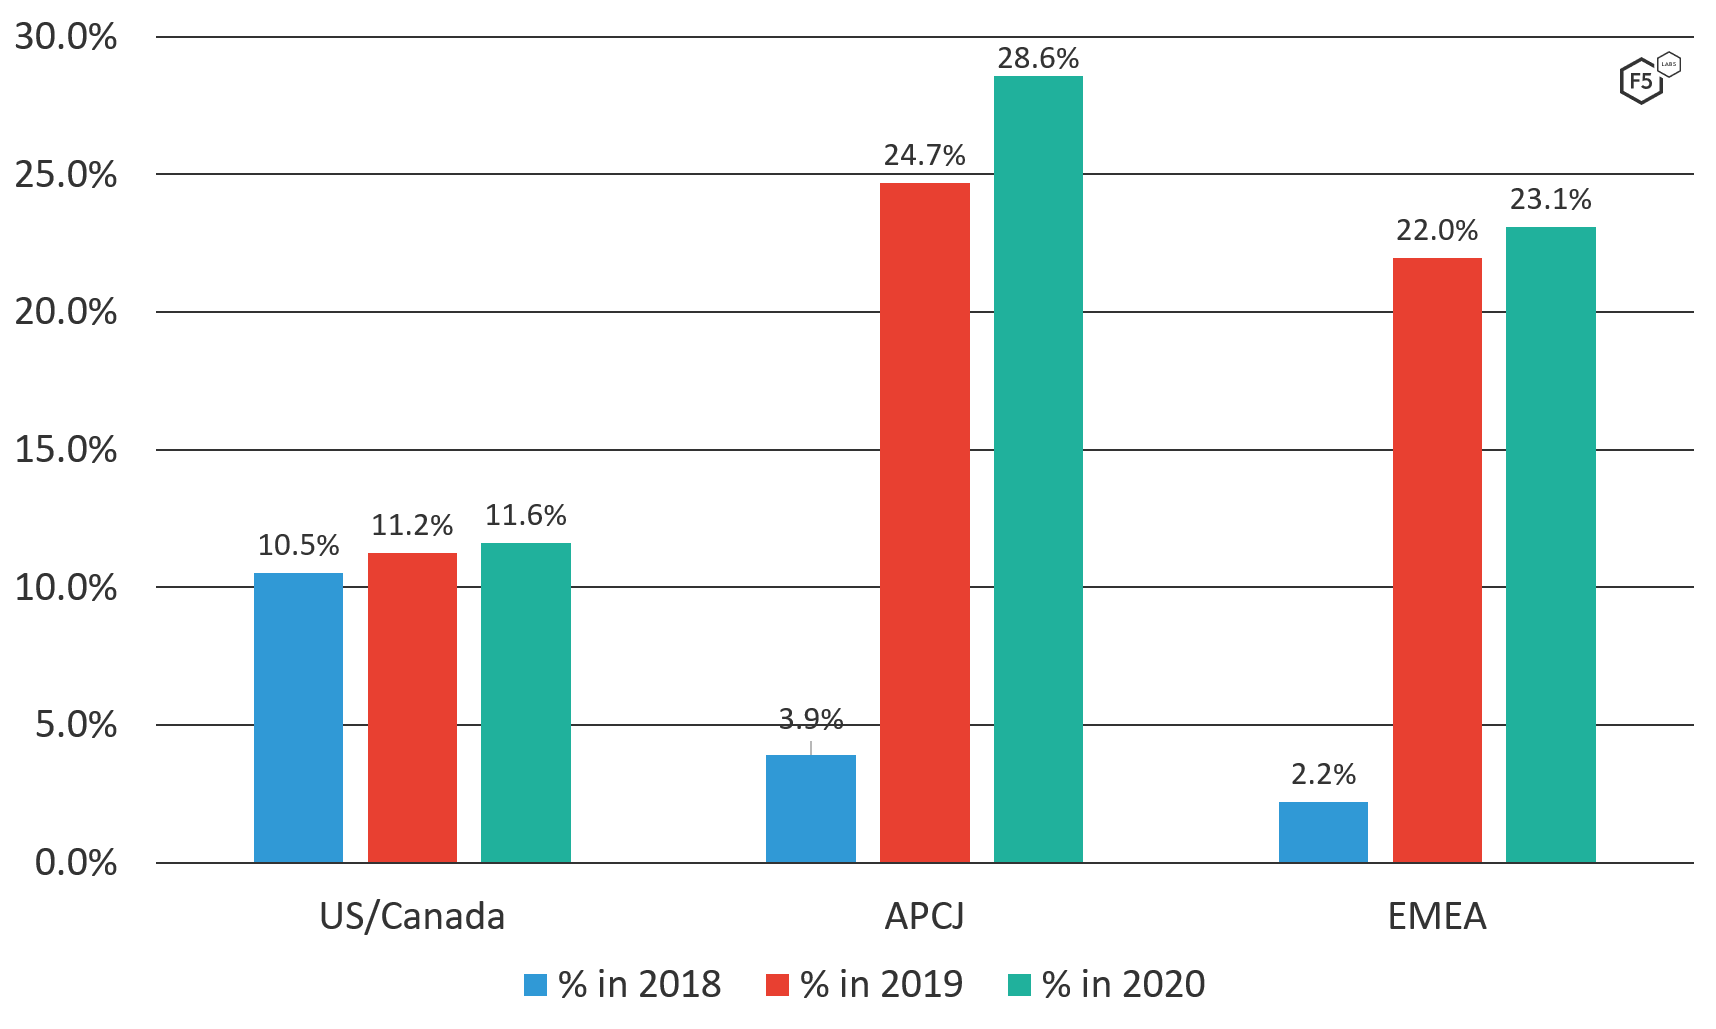
Figure 3. DoS attacks as a percentage of reported F5 SIRT incidents by region (2018-2020).
We clearly see tremendous growth in reported incidents in APCJ and EMEA, while U.S./Canada only grew slowly. LatAm dodged the bullet and did not suffer enough DoS attacks to calculate a significant trend line.
F5 SIRT Incidents by Industry Sector
Breaking this data out by industry sector reveals some interesting differences. Looking first at password login attacks (Figure 4) shows banking and financial services organizations reported the highest proportion of password login attacks (46%), with public sector organizations reporting the second highest proportion (39%).
On the DoS side, service providers (SP) and education institutions are tied for the highest proportion of DoS attacks (59% of reported security incidents), as shown in Figure 5.
Finance and public sector organizations are next highest proportions at 36% and 28%, respectively.
Digging Deeper into Password Login Attacks
Attacks on password logins are a scourge of the Internet. In fact, F5 Labs and Shape Security recently published the 2021 Credential Stuffing Report, in which we looked at the huge volume of stolen login credentials. Overall, attacks on password logins are growing year by year, as shown in Figure 6.
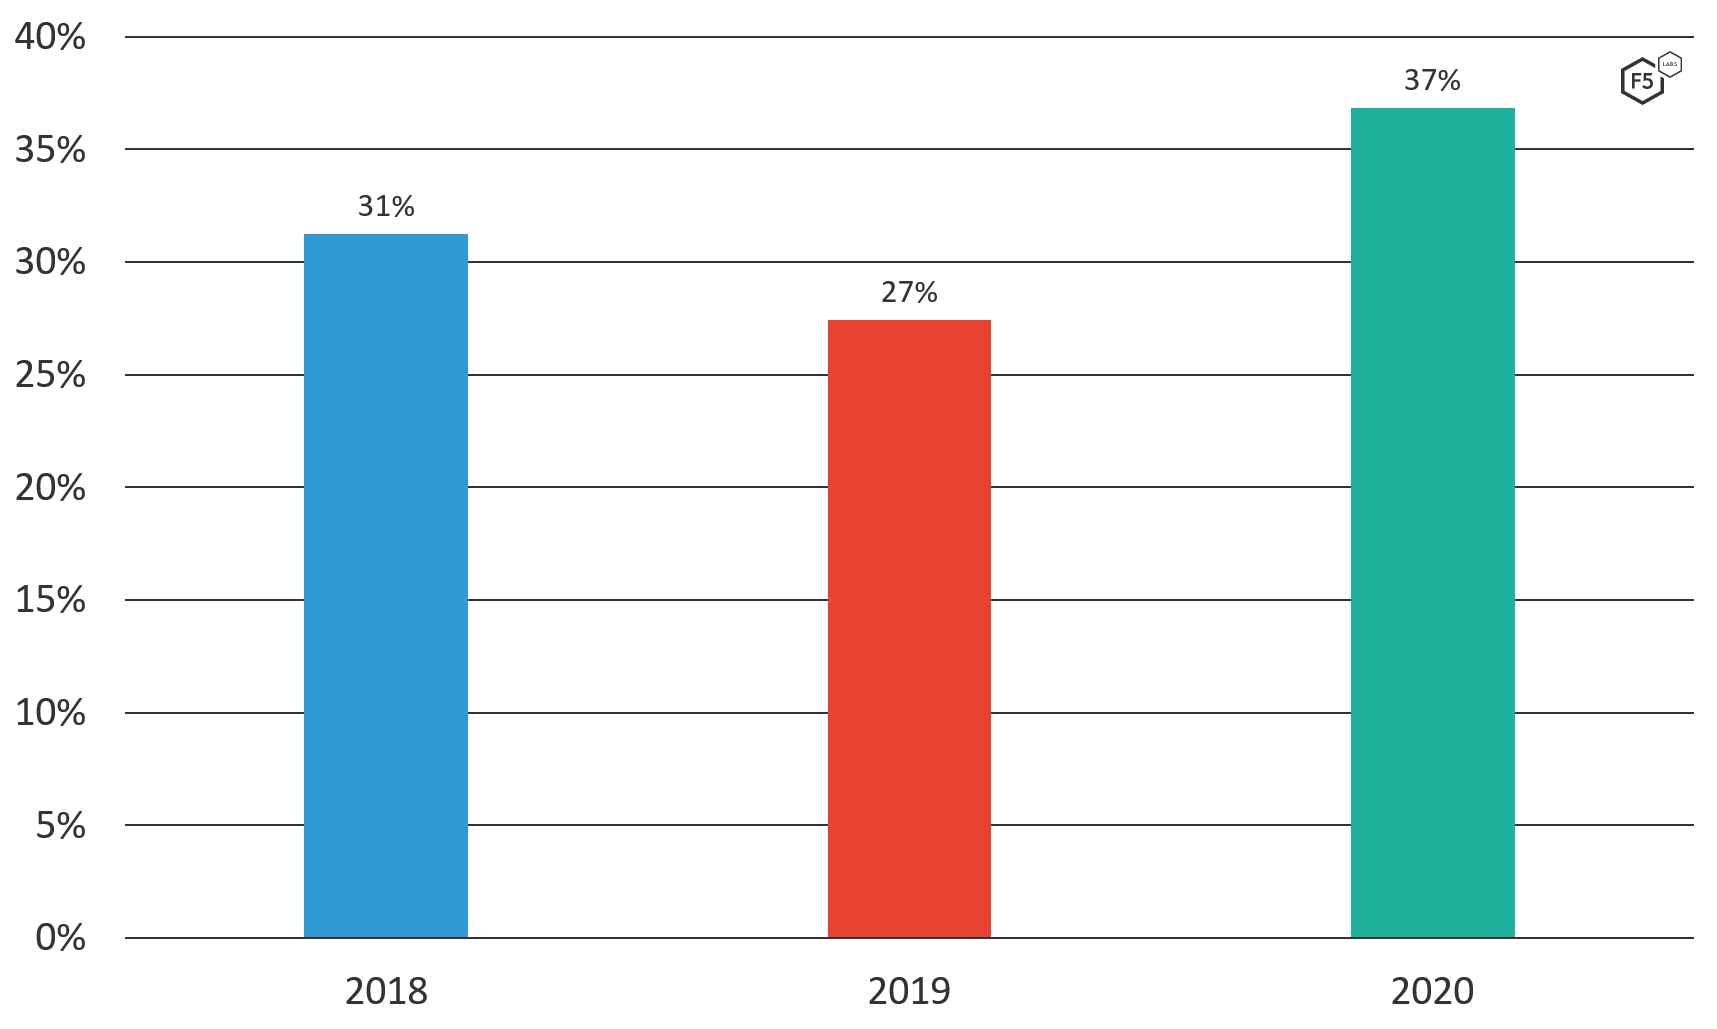
Figure 6. Password login attacks as a percentage of all reported F5 SIRT incidents (2018-2020).
Accounting for the slight dip in 2019, password login attacks account for 32% of all reported SIRT incidents over the past three years. We also saw how they jumped in 2020, so we did a deeper dive into how these kinds of cyberattacks ramped up during the pandemic.
Credential Stuffing Attacks at Financial Services Organizations
Financial services organizations experienced the highest proportion of credential stuffing security incidents, at 46%. This aligns with FBI warnings that 41% of all financial sector attacks between 2017 and 2020 were due to credential stuffing.1 An attacker can pull off a lot of lucrative fraud once they get into someone's bank account, such as check fraud, money transfers, bill payments, and even stealing credit card reward points. However, financial institutions have also gotten particularly good at defending their systems. So attackers are going after the weakest link: the customers. It’s hard for a financial services organization to know if a consumer is reusing their password somewhere else, especially somewhere with weaker security. What we’re seeing is attackers concentrating their efforts on seeking out the weakest link.
New York Puts Organizations on Notice About Credential Stuffing
Credential stuffing and brute force attacks exploit a security weakness of the user, or customer in this case, not necessarily a direct vulnerability in the organization. Therefore, what obligation do organizations have to protect their customers in this situation? If the customer reuses a password and that password is stolen at another site, is the place where the fraud was committed compelled to detect and block that fraud? The New York attorney general (NY-AG) says yes, they are. Specifically:
Credential stuffing has quickly become one of the most common forms of online attack. To comply with New York’s data security laws, businesses that maintain New Yorkers’ private information must take steps to address this growing threat.2
With this statement came a $650,000 judgement against Dunkin′ Donuts for failing to protect consumers from credential stuffing fraud. Why a food service organization? The attackers weren’t after tasty fried dough but stored-value gift cards, which are fungible instruments easily sold on darknet markets. This made Dunkin′ Donuts look a lot more like a financial organization to attackers than a restaurant or retailer, and therefore attracted a more determined attacker. In this same judgement, the NY-AG put organizations on notice to "implement reasonable safeguards to address credential stuffing attacks" as well as "develop appropriate incident response procedures for credential stuffing attacks."
Digging Deeper into DoS Attacks
DoS attacks mean critical systems are unavailable for hours, sometimes days on end. For any organization that depends on the Internet, which nowadays is pretty much all organizations, the cost of this rings up pretty quickly. Most DoS attacks are distributed denial-of-service (DDoS) attacks, leveraging large bot armies to flood the victim with bad traffic. Nearly a third (32%) of all F5 SIRT reported incidents annually are DoS attacks. However, the frequency is creeping up, as shown in Figure 7, with 36% of incidents reported in 2020.
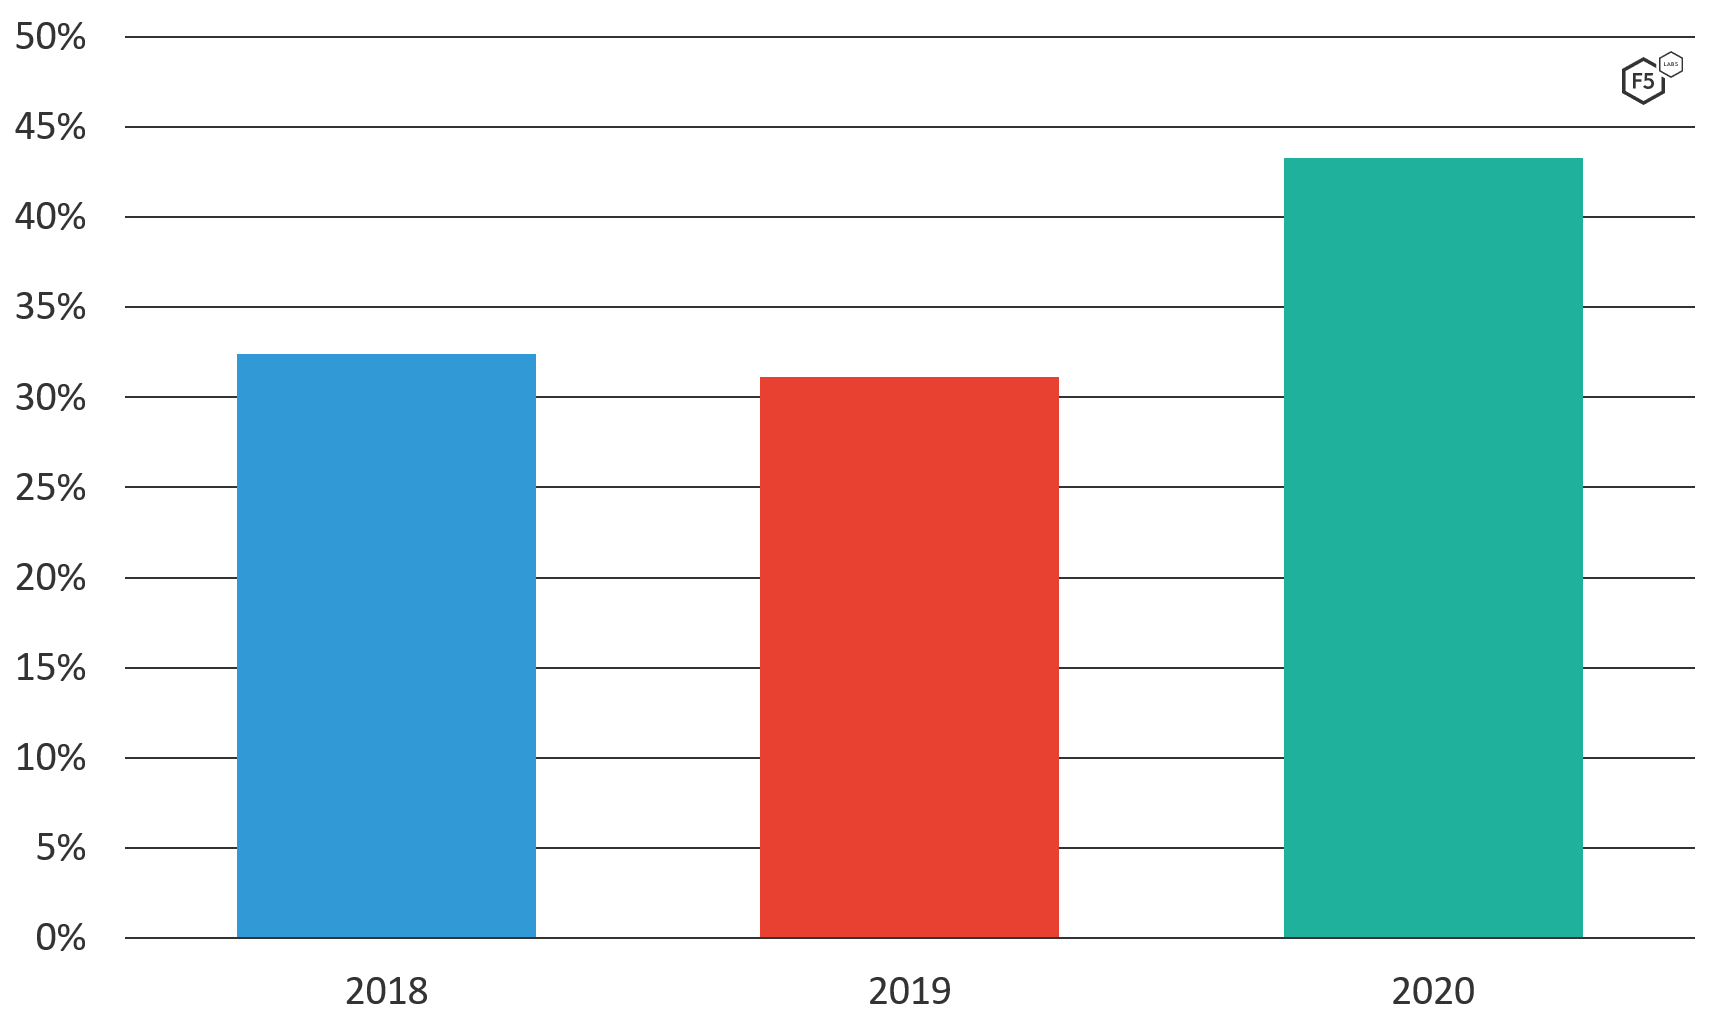
Figure 7. DoS attacks as a percentage of all reported F5 SIRT incidents (2018-2020).
Most DoS attacks are network volumetric floods, which are commonly TCP SYN or UDP floods. F5 SIRT also receives reports of “Slow POST/Slowloris” attacks, which are attacks designed to initiate and keep open as many connections on a victim as possible.3 This has the effect of exhausting the victimized system’s memory and processor resources, causing it to degrade in performance. Sometimes these attacks are in the dozens or hundreds of gigabytes, which also saturate the victim’s Internet connectivity.
DoS Attacks Against DNS Are Still Popular
DoS attacks against DNS still happen with unfortunate regularity. Nineteen percent of DoS incidents reported to F5 SIRT involved attacks on DNS. We’ve talked before about how attackers are well aware that disabling DNS services can cripple an organization’s Internet presence. Disrupt the DNS service and an organization can become unreachable to customers via web, email, or any Internet service. On top of that, since DNS is UDP-based, the network packets are easy to counterfeit and hard to trace.
API Attacks Just Keep Growing
Attacks against APIs are still the apples of attacker’s eyes. Why? Because APIs are used extensively in the cloud, for mobile apps, in software-as-a-service offerings, and in containers. Of all reported F5 SIRT incidents, 4% were API-related, and of those, 75% of them were password login attacks.
As APIs are essentially web logins, often password logins grant elevated access to critical applications. What is troubling is that attackers are using password login attacks, such as brute force, knowing full well that 69% of API breaches in 2019 were attributable to poor access control.4 Finance and service providers are the top industries reporting API attacks to F5 SIRT.
Conclusion
So far, the same trends continue, and attackers, as always, choose the most efficient ways to turn a profit. Our weaknesses are their opportunities. Expect more password login attacks, more DoS against critical systems, and more API attacks.
Security Controls
To mitigate these types of attacks, consider implementing the following security controls based on your specific circumstances:
Recommendations
- Monitor typical use and compare with variations.
- Define high-water marks for specific resources.
- Implement IP address blocking based on content or traffic rate.
- Enforce strong password policies that ban well-known, weak, and reused passwords.
- Implement multifactor authentication.
- Implement bot detection and scraping.
- Monitor overall number of failed logins to detect password attacks.


