Distributed Denial-of-service (DDoS) is a persistent threat facing businesses of all types, regardless of geographic location or target market. The tools used to launch distributed DoS (DDoS) are becoming easier to use, while the attacks themselves are becoming more complex—frequently combining many different DDoS methods in one larger assault. This article combines attack data from the F5 Silverline Security Operations Center (SOC) and incidents logged by the F5 Security Incident Response Team (SIRT) to determine how DDoS attacks are changing and their impact on organizations. Before we dive into the details, here’s a summary of our findings:
- Between January 2020 and March 2021, DDoS attacks increased by 55% and are becoming more complex, with 54% of incidents using multiple attack vectors.
- The biggest attack over the past 15 months measured 500 Gbps and used no fewer than five different attack vectors.
- The technology sector was the most targeted, receiving 27% of all DDoS attacks over the past 15 months.
- Volumetric DDoS accounted for 73% of all incidents. Specifically, 53% of attacks took advantage of some kind of reflection attack, which leverages other people’s vulnerable systems.
- Application DDoS jumped to an impressive 16% of all DDoS incidents and accounted for more than 50% of all DDoS-related support cases to the F5 SIRT.
What Do Today’s DDoS Attacks Look Like?
Our article on distributed denial-of-service attacks (/content/f5-labs-v2/en/archive-pages/education/what-is-a-distributed-denial-of-service-attack-.html) provides a great overview of DDoS attacks and the varying methods and tactics that threat actors employ against their targets. For a brief reminder, Figure 1 shows the three primary methods of performing a DDoS attack: volumetric, protocol, and application.
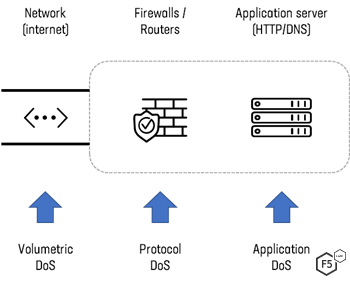
Figure 1. Diagram showing volumetric, protocol, and application DDoS attacks.
Volumetric DDoS is the most common form of DDoS attack, and the one that most frequently hits the headlines due to ever-increasing sizes. These attacks flood the network with attacker-generated traffic in an attempt to consume all available network bandwidth to the application. The largest attack the F5 SOC team saw and mitigated over the past 15 months peaked at an impressive 500 Gbps.
Protocol DDoS attacks work by filling up connection tables within firewalls or routers so that, while the network itself may not be fully consumed, networking products cannot efficiently handle the number of packets being sent to them.
Application DDoS attacks aim to consume the resources of the “origin” server, whether that be web, DNS, or some other kind of application. Forcing the application to deal with illegitimate requests from the attacker prevents them from dealing with legitimate requests from genuine visitors.
Figure 2 shows the frequency of each type of DDoS attack encountered between January 2020 and March 2021. Over the past 15 months, over 73% of all attacks used volumetric DDoS, while protocol DDoS accounted for 23%. Application attacks saw a sharp increase compared to previous years and are now used in 16% of DDoS attacks. (Note: since the majority of attacks use multiple vectors, percentages will always add up to more than 100%.)
Each DDoS category includes many different attack types, as threat actors look to exploit different layers of the network and application stack. For example, application DDoS includes HTTP, HTTPS, and DNS requests to a server. Volumetric DDoS includes standard UDP flooding, along with many different types of reflection attacks, including NTP and DNS.
Figure 3 shows the distribution of DDoS attack methods the SOC team saw for the 15-month period. At a glance, it’s clear that volumetric DDoS attacks are the most common by far. What is not clear from this graph, however, is the actual impact to the application or network.
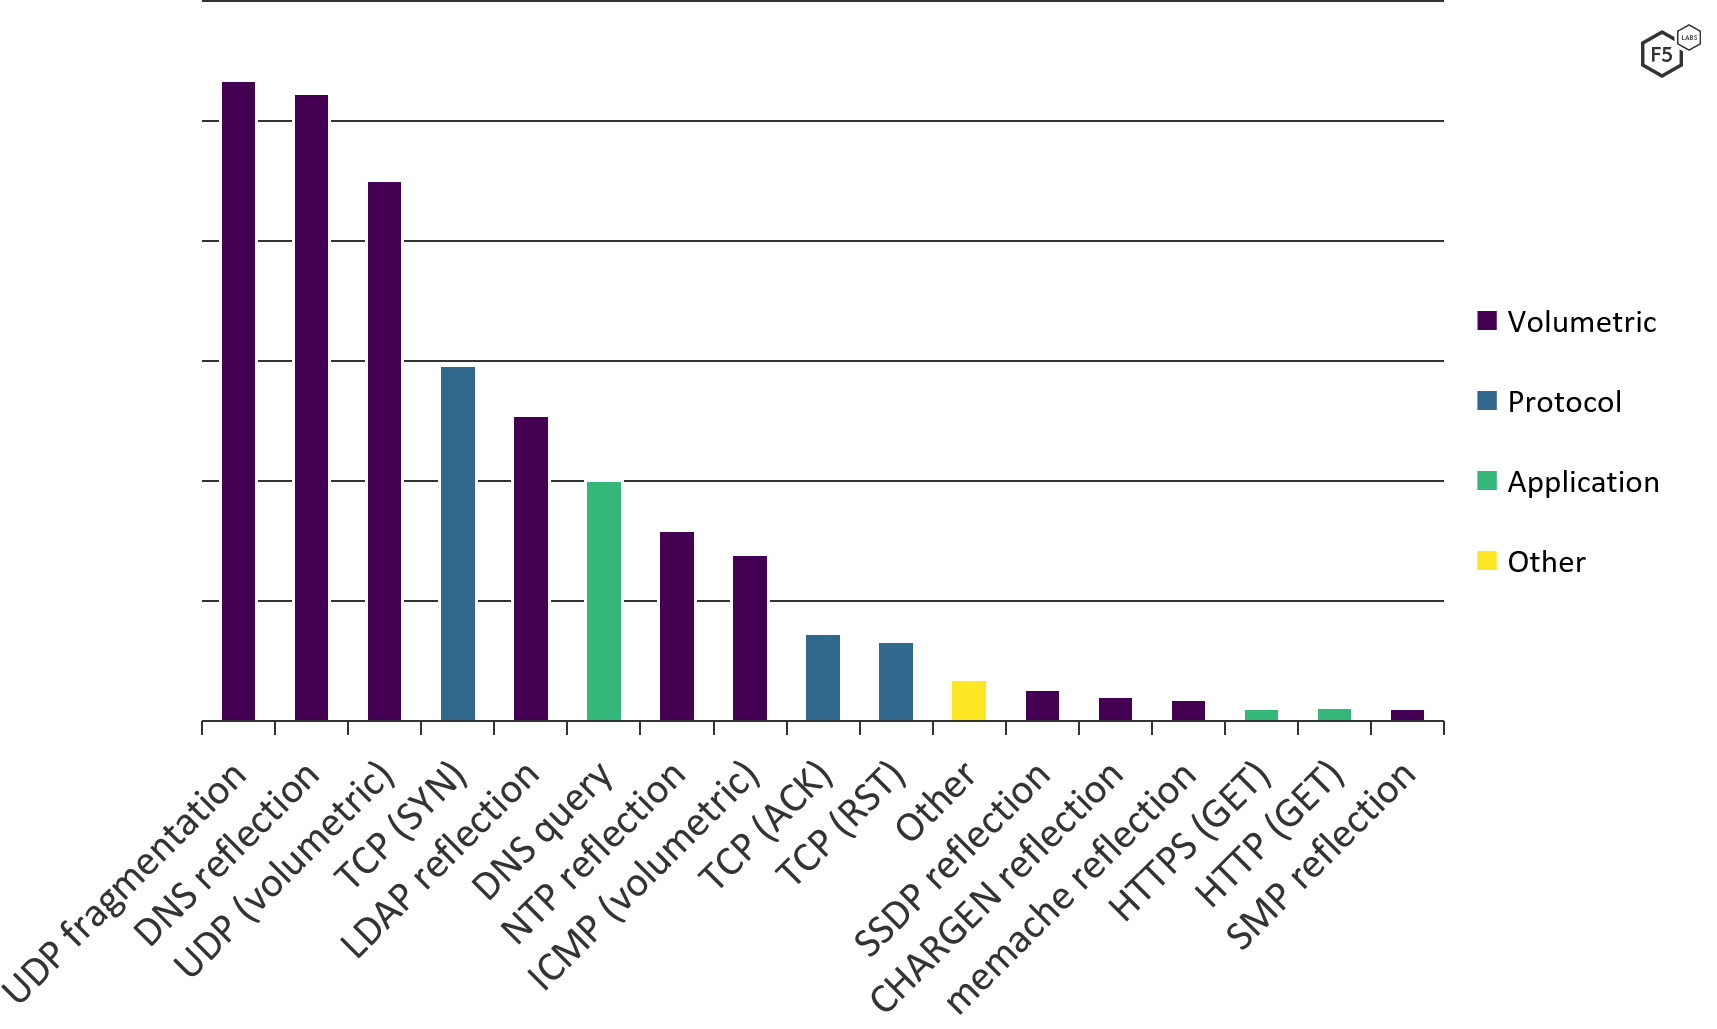
Figure 3. Frequency of different DDoS attack tactics, January 2020 through March 2021.
Volumetric DDoS Attacks
The majority of volumetric DDoS attacks take advantage of reflection and amplification techniques made possible by the UDP protocol. If you’re unfamiliar with these concepts, our guide to DDoS DNS amplification attacks (/content/f5-labs-v2/en/archive-pages/education/what-is-a-dns-amplification-attack-.html) explains them in detail. UDP is connectionless, so it’s easy to spoof source and destination IP addresses. For this reason, UDP-based DDoS accounts for 83% of all DDoS attacks. Despite this, the SOC analysts still frequently see large-scale TCP-based attacks. In fact, the sixth- and seventh-largest attacks of the past 15 months used TCP ACK packets solely in attempts to overwhelm the victims’ networks.
Figure 4 compares the number of DDoS attacks observed each month (purple bars) with the largest attack that month (yellow line). The number of attacks remains largely consistent, though we observe a gradual but persistent increase month to month. In fact, between January 2020 and March 2021, we saw a 62% increase in the number of monthly attacks.
Of interest is the large spike in DDoS activity in June 2020. Our recent 2020 Phishing and Fraud Report also highlighted a large increase in phishing incidents during this time. While the SOC team was aware of a large number of DDoS ransom demands that hit the financial sector during this period, the DDoS attack data shows that, in fact, all industries saw a similar increase. Attack methods were also largely consistent during this spike. June 2020 was, for many, a period of lockdowns or stay-at-home orders to help contain the spread of COVID-19. It seems that threat actors seized upon this opportunity to attack both remote workers and businesses that had begun to rely more on their online services.
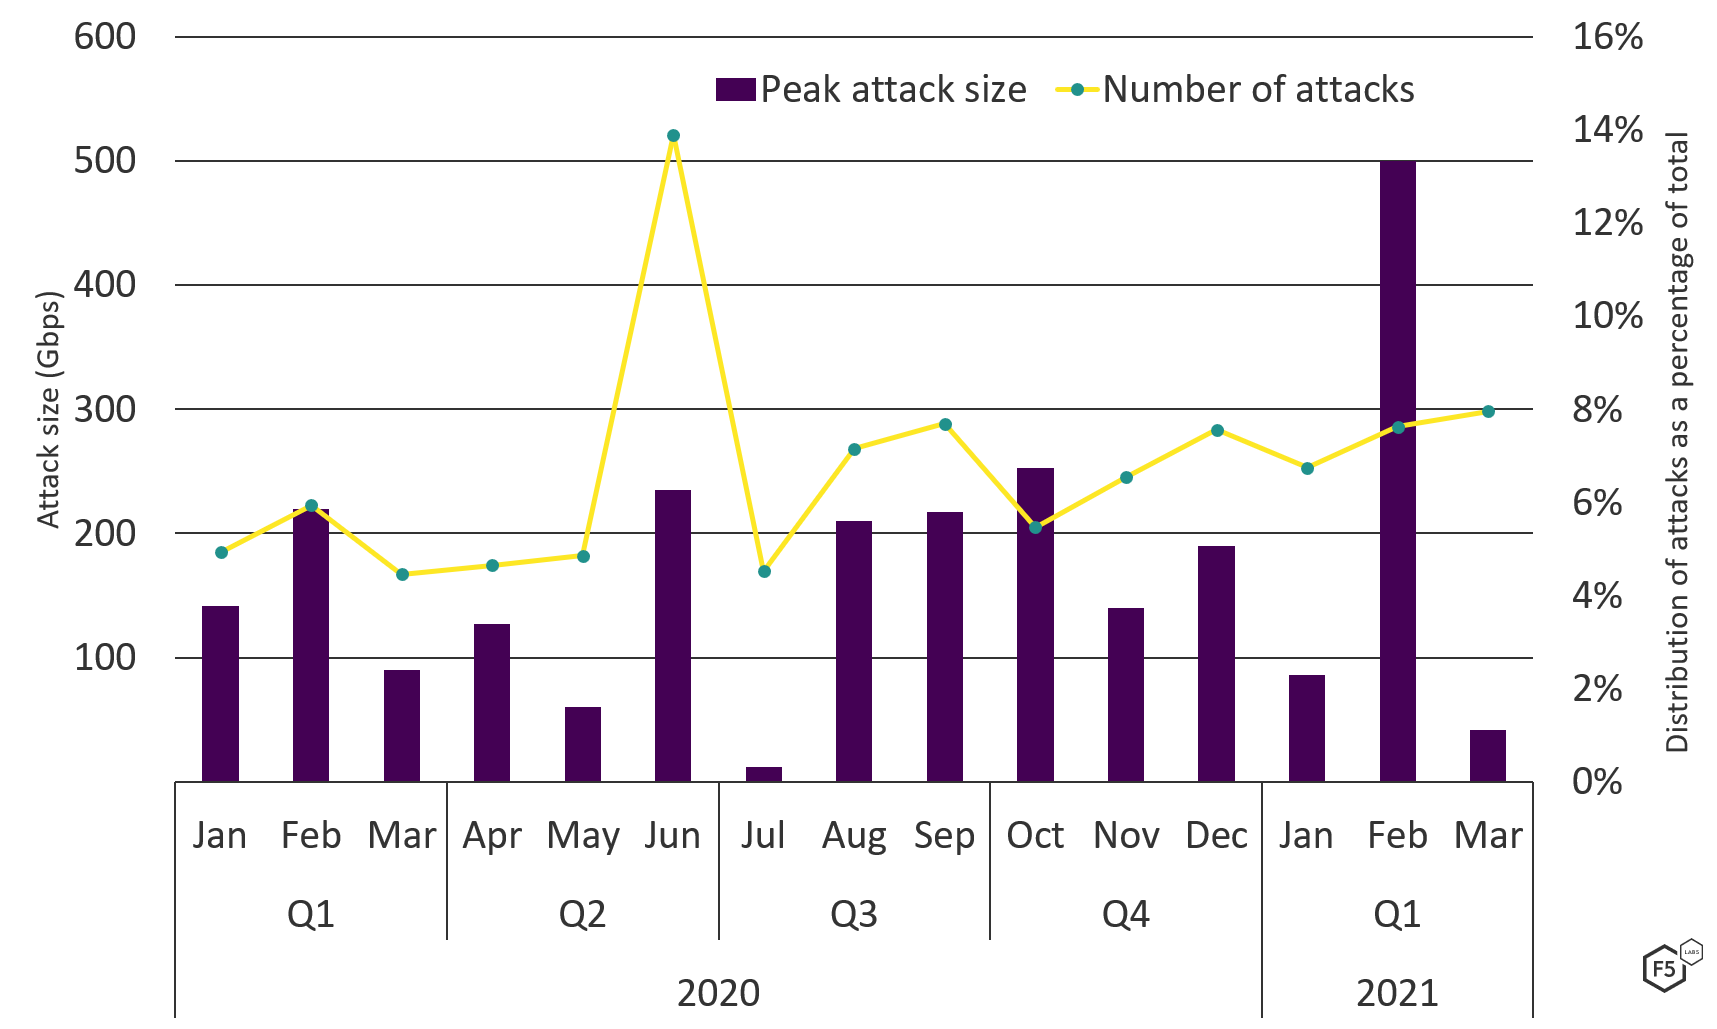
Figure 4. DDoS attack frequency compared with peak DDoS attack sizes, January 2020 through March 2021.
It may seem like common sense to claim that the larger the attack the less frequently we would expect to see it. However, a useful tool to predict and confirm this theory is the principle of Zipf’s law, which observes that the frequency of an event is often the inverse of its rank. For example, the second most common word in the English language is used half as often as the first. The third most common word is used one-third as often as the first, and so on. We see Zipfian distributions around the world, from natural disasters and solar flare intensities to frequency of passwords appearing in breached data sets.
In Figure 5, the yellow line denotes a standard Zipfian distribution and the purple line indicates the DDoS attack sizes over the past 15 months. The attacks the SOC team observed and mitigated broadly follow a Zipfian distribution, with a few notable exceptions:
- There were a greater than expected number of small attacks, ranging from 1 Gbps to 5-6 Gbps.
- We saw an abnormally large number of attacks around 10-30 Gbps. This suggests the frequent reuse of a number of botnets that can only generate traffic in this range.
- A similar spike in 100-200 Gbps attacks, again, possibly due to reuse of a small number of more capable botnets.
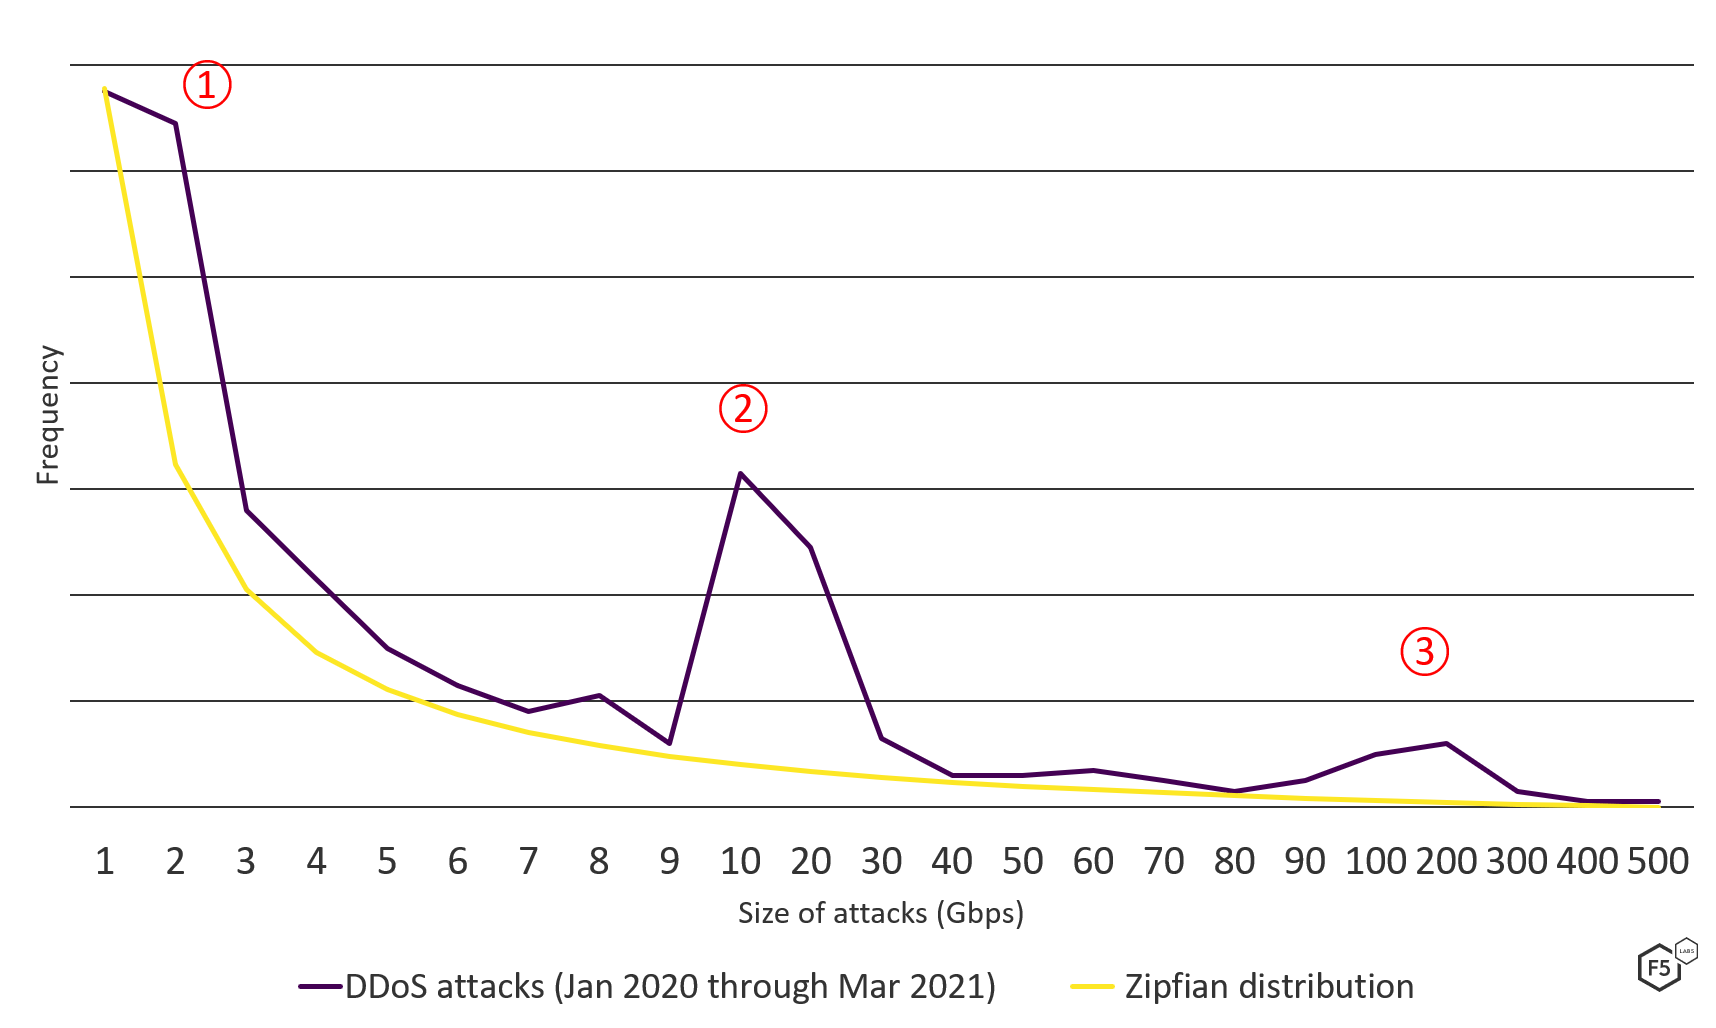
Figure 5. DDoS attack size distribution compared with Zipfian distribution, January 2020 through March 2021.
The Largest DDoS Attack of 2021 So Far
The largest attack the SOC team encountered over the past 15 months came in February 2021 and targeted a technology company that provides information security services for gaming and gambling organizations. The onslaught peaked at 500 Gbps, or half a terabit per second.
Threat actors, possibly disgruntled customers, threatened the victim with an imminent attack via text message. They claimed that if the victim did not pay a ransom, they would launch a DDoS campaign. While some threats and ransom demands are nothing more than a ruse, it is common for cybercriminals to demand payment in order to obviate the DDoS attack. In this case, the threat was real, and the attackers immediately launched a 4 Gbps SYN flood attack as a warning shot; within five days of this, the siege began. Beginning early February and lasting almost the entire month, attack after attack kept coming, with the threat actors adding more and more vectors. Eventually, the attacks peaked at 500 Gbps and included a multivectored barrage of volumetric UDP, LDAP reflection, DNS reflection, NTP reflection, and UDP fragmentation attacks.
Increasing DDoS Complexity
Web apps, served over HTTP and HTTPS, accounted for 17% of application attacks, though the majority, 83%, targeted DNS servers. Generally speaking, it can be extremely difficult to identify which requests to an application are genuine and which are malicious, since many organizations cannot identify which web requests come from genuine users and which come from malicious automated bots. It is no surprise, therefore, that we see more support calls placed to the F5 SIRT seeking assistance in dealing with application DDoS than any other DDoS type. Last year over 50% of all DDoS support cases were attributed to application DDoS (combining web, API, SSL/TLS, and DNS DDoS attacks). Thirty percent alone were for HTTP/HTTPS-based DDoS attacks (see Figure 6). When comparing this with the number of HTTP/HTTPS DDoS attacks shown in Figure 3, it is evident that detecting and blocking these attacks is disproportionately more difficult than blocking volumetric-based DDoS.
DDoS attacks also appear to be growing in complexity. In 54% of DDoS incidents, threat actors used multiple techniques to launch simultaneous attacks in an attempt to overwhelm the victim’s defenses—a trend that appears to be on the rise. The first quarter of 2021 saw an 80% increase in multivectored attacks compared with the same period in 2020 (see Figure 7). Simple single-vectored attacks appeared to be relatively flat from Q1 2020 to Q1 2021.
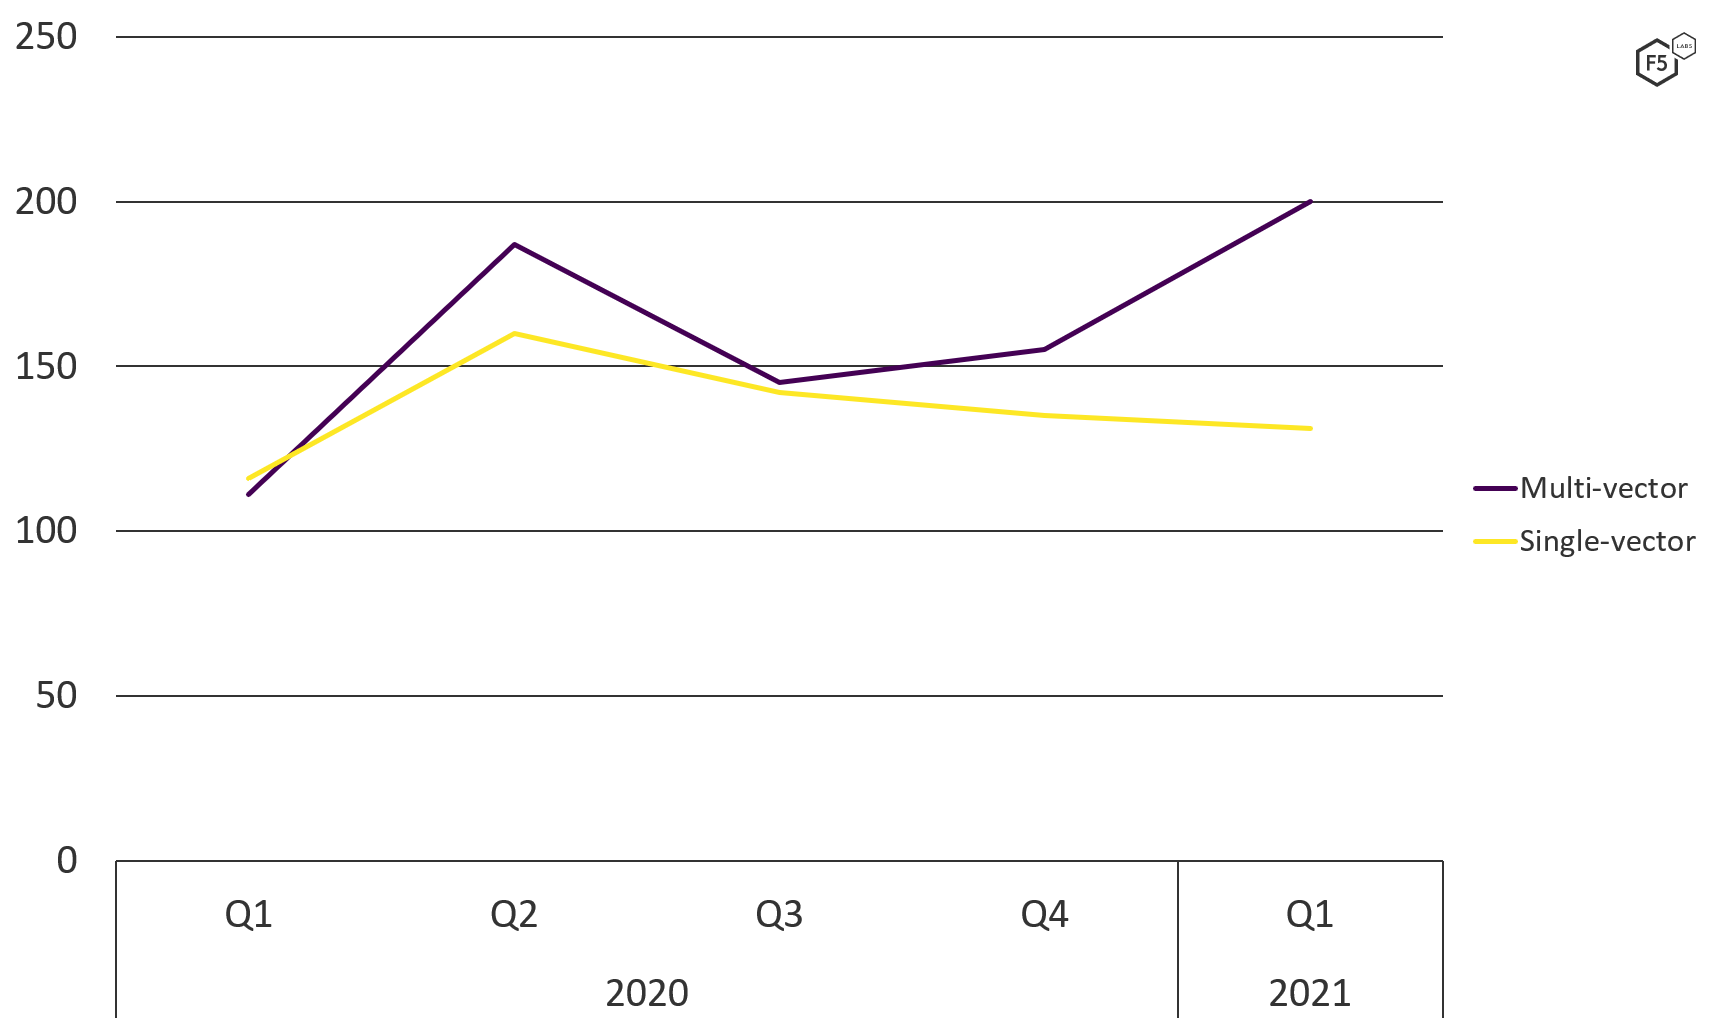
Figure 7. Comparison of multivector and single-vector DDoS attacks, Q1 2020 through Q1 2021.
Cybercriminals used an average of 2.7 attack types in their multivectored DDoS attacks, with some attacks using as many as eight different vectors. In these worst-case scenarios, the attackers used the following attacks simultaneously:
- Memcached reflection
- DNS reflection
- NTP reflection
- TCP RST
- TCP ACK
- TCP SYN
- ICMP
- DNS query
Using these attacks together allowed the threat actor to target the victim’s Internet bandwidth, networking stack, and application servers at the same time.
Who Is Being Targeted with DDoS?
Launching DDoS attacks has a very low barrier to entry for the would-be hacker. YouTube contains tutorials for creating new botnets, and DDoS-for-hire services offer cheap rates for those looking to launch an immediate attack with zero effort. Because of this, no industry is safe. Whether it be a determined attack from an organized crime group or a politically motivated form of protest, DDoS attacks are cheap and easy to launch.
Over the past few years, we have observed that the most attacked industries are education, finance, gaming, technology, and telecommunications, with the top spot changing in any given month. This time around, technology, which took 27% of all attacks, was the most targeted sector the past 15 months, as shown in Figure 8.
Simply looking at the number of attacks does not, however, tell us the whole story. Figure 9 compares the number of attacks over the 15-month period (yellow bars) with the average attack bandwidth (purple bars). Despite the health care sector being one of the least attacked industries since the start of 2020, they came under some of the largest attacks. Meanwhile, the average attack size against finance, technology, and telecommunications companies was low compared to the sheer number of attacks they faced.
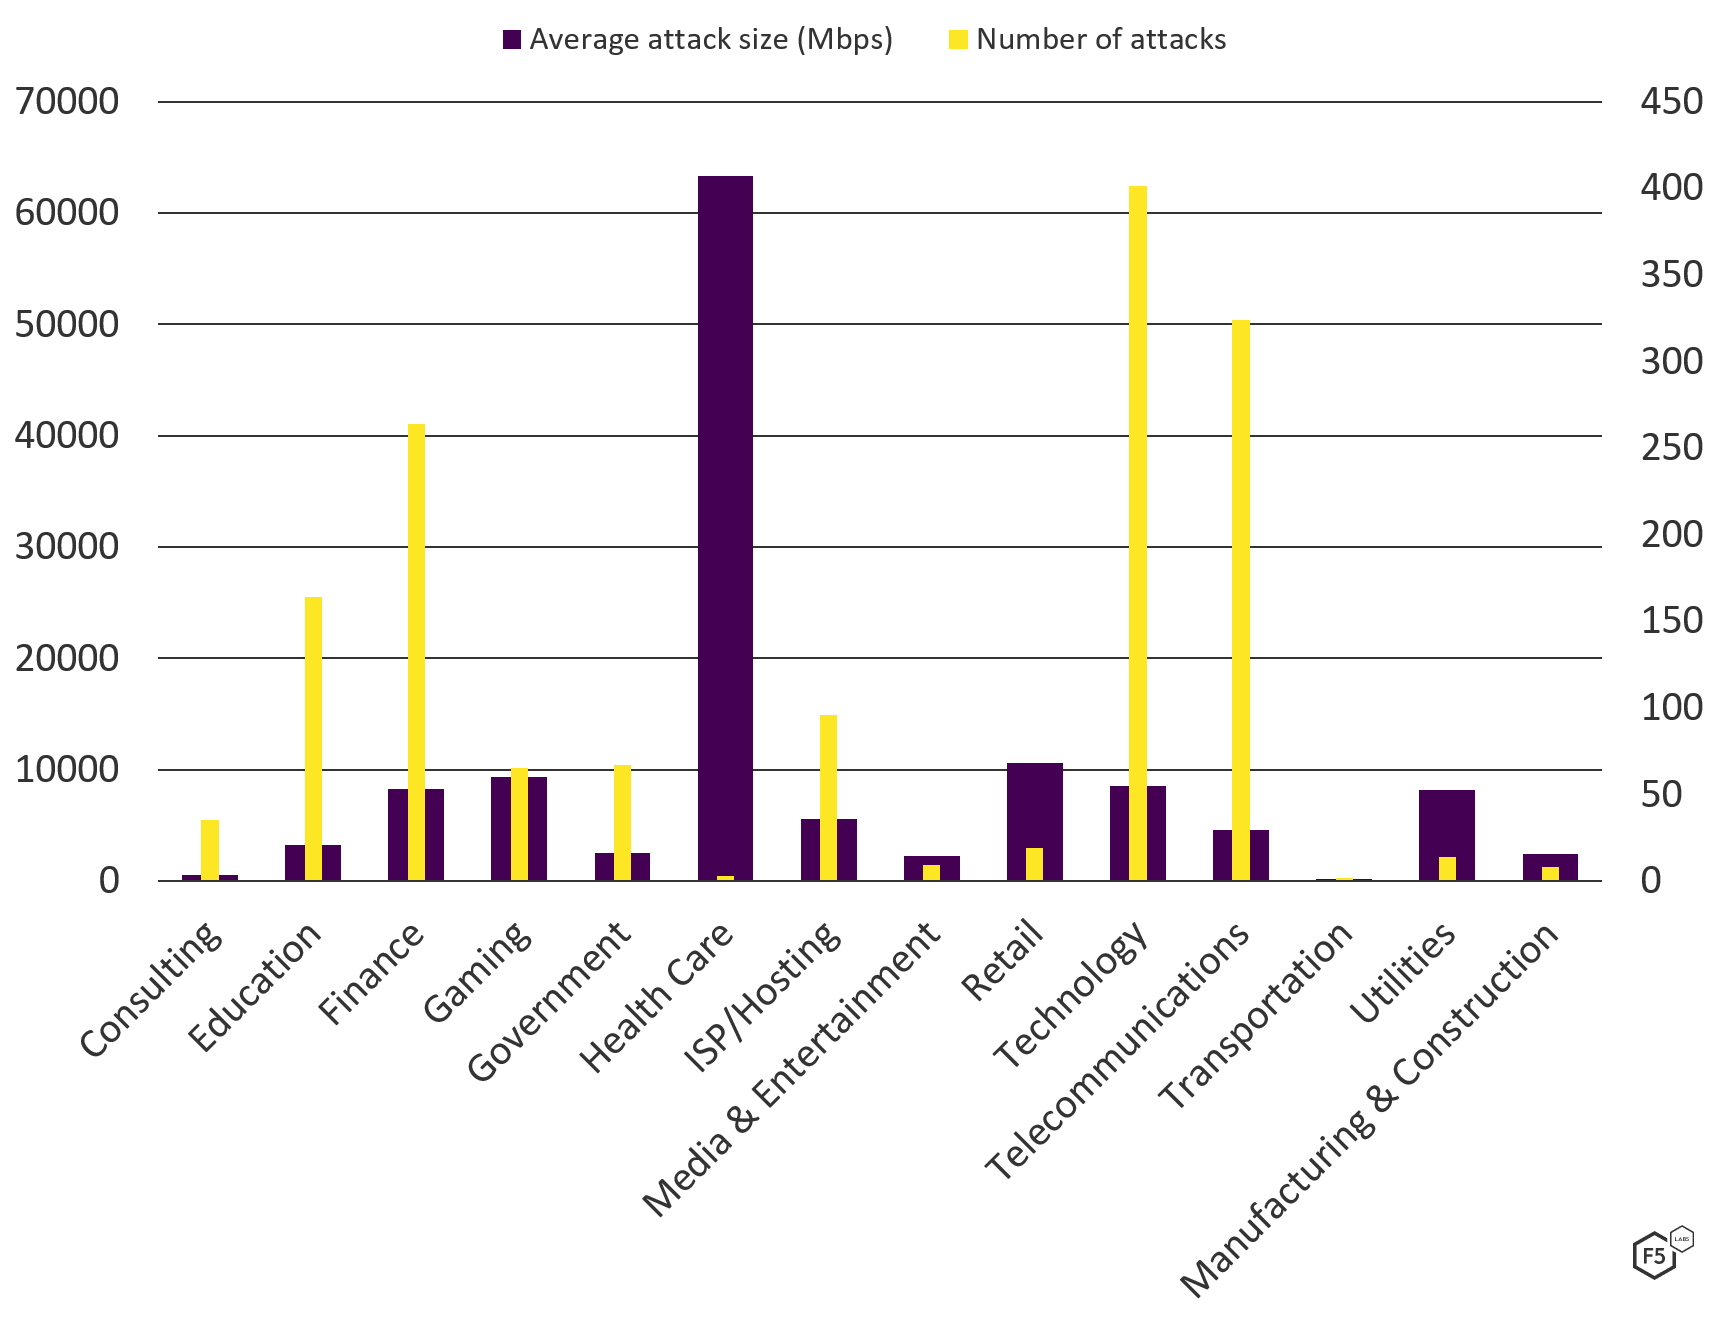
Figure 9. Comparing number of attacks in each sector with the sector's average attack size (Other category not shown).
Most industry sectors receive a variety of DDoS attack types, although the gaming, ISP/hosting, and telecommunications industries get an above-average amount of volumetric attacks (see Figure 10). This seems logical since the attack is rarely trying to take a specific application offline. Instead, attackers attempt to take down all applications a telecom or ISP provider hosts.
Comparing the quantity of attacks over time for each sector also revealed some interesting trends. The return to school in January 2021, following months of lockdown and home-schooling, seems to have been unpopular for some. The education sector saw a large increase in DDoS attacks in January 2021, with more than 56% of all education incidents for the past 15 months occurring in Q1 2021 (see Figure 11).
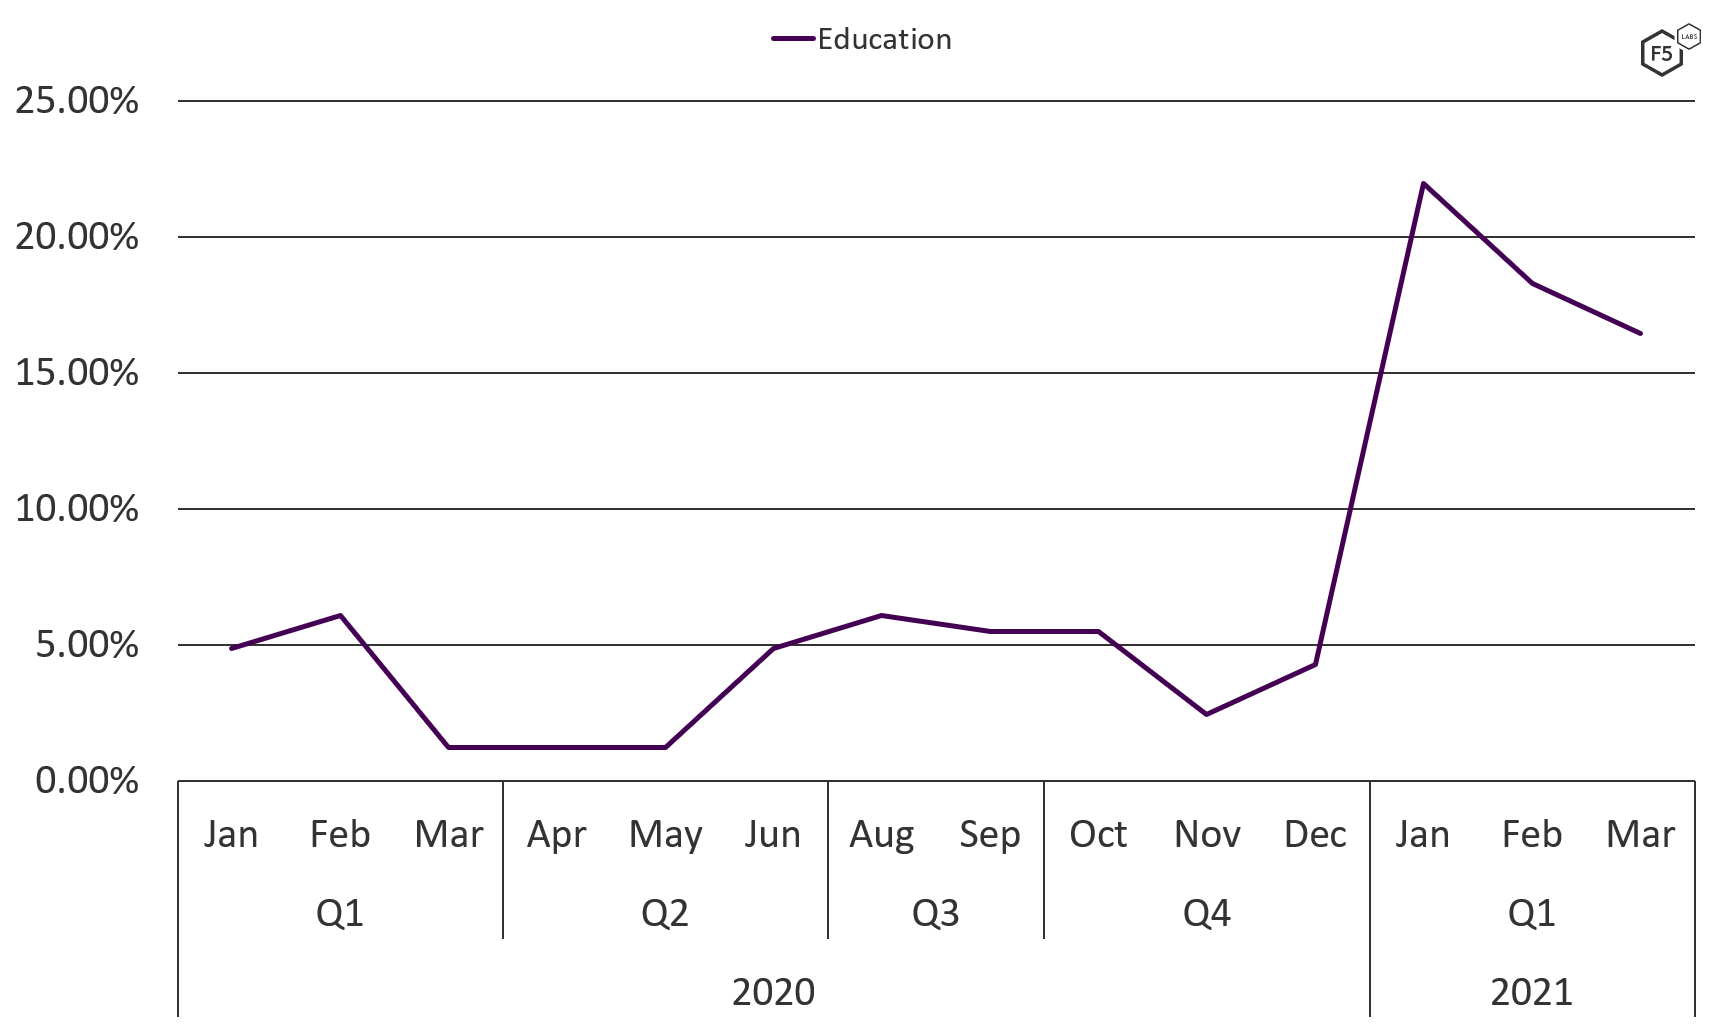
Figure 11. Number of DDoS attacks against the education sector, January 2020 through March 2021.
Conclusion
With a steady increase in both the quantity and complexity of DDoS attacks, it’s clear we need to do more to defend against them. As well as considering how to mitigate DDoS attacks once they are underway, perhaps more important is the ability to accurately detect them. As the number of application DDoS attacks increase, it is worth understanding if you can differentiate from a simple increase in user traffic, and a targeted and sustained attack from a botnet. As always, visibility and context are crucial.
Attackers are making good use of vulnerable or unsecured application servers to launch reflection attacks. This means that even if you are not the target of a DDoS attack, your systems may be used to launch one. Vulnerable DNS, NTP, memcached, and LDAP services, to name just a few, must be secured from unauthenticated access, particularly if they are Internet facing.
Countermeasures for Mitigating DDoS Attacks
The following technical/preventive security controls are recommended to protect against DDoS attacks.
For more information about DDoS attack tools, tactics, and procedures, see:
Recommendations
- Implement DDoS protection using an on-premises solution, DDoS scrubbing service, or hybrid.
- Use both network and web application firewalls.
- Use antivirus solutions to curb malware infections.
- Use a network-based intrusion-detection system.
- Apply patches promptly.
- Block traffic with spoofed source IP addresses.
- Use rate limiting to restrict the volume of incoming traffic.


