“Data driven” is the new catchphrase that is taking businesses and all types of industries by storm. In short, to be data driven is to be rad, and for good reason. Data has become the most important commodity in digital transformation efforts because it differentiates facts from opinions. It helps organizations and teams to be proactive, make confident decisions, and even be cost effective.
At the same time, this recent emphasis on data is built around the assumption that the data we use for decisions is trustworthy. As we become more dependent on it, the potential damage it can do grows in turn.
We at F5 Labs are a cool team and are definitely data driven. So, as I was winding up 2020, I decided to use our own data and metrics systems to run an experiment on our coolness apparatus and demonstrate the impact that data manipulation can have on modern business. To do this, I teamed with our in-house data magician, Kristen. Since it was a stealth project, we worked together to understand article elements to manipulate that would not skew the metrics too much to cause an uproar (we wanted to keep our jobs). In this episode of Cool Kids of F5 Labs Break Stuff, we manipulate our own web metrics to show both how easy and how impactful it would be to skew operations in data-driven enterprises.
Data is King at F5 Labs
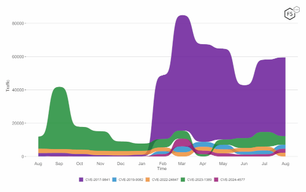
Like many other websites, we deploy sleuth technology to analyze every aspect of reader engagement. The data helps us measure content effectiveness, the readers’ engagement level, and analyze search queries to decide which trending topics to cover. Some of the data is used to grade authors, as well (my personal reason to get onboard this project). Kristen says, “Slicing the data in different ways gives us perspective and an edge to improve.” Figure 1 shows one such perspective: our reader distribution across geographic regions. These insights help us choose stories that cater to our audience and attract new readers.
So, the simple goal was to generate fake traffic and be able alter some of the insights and not get caught in the process. As soon as I started, I realized that simple command line tools with pull requests were not enough. Kristen and her tools quickly weeded out these attempts. For example, a bot running from my laptop managed to peak page views but raised suspicion with engagement rate for that segment, so she kicked it to the curb.
The Setup
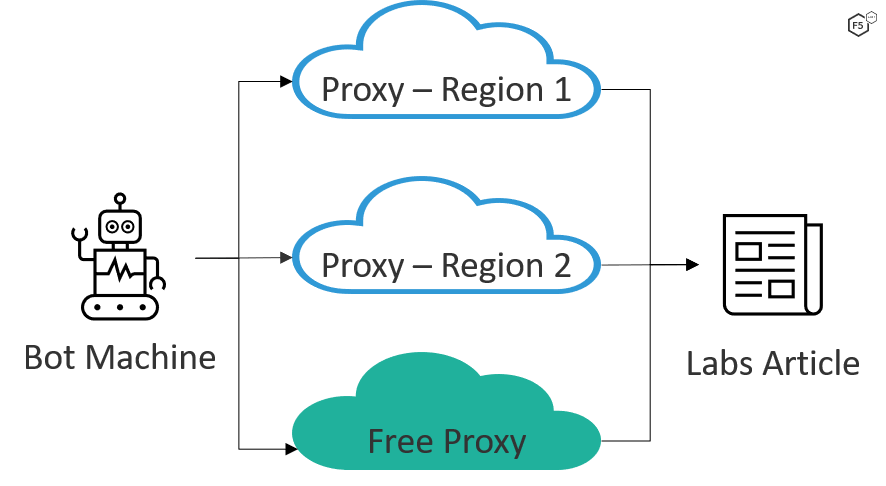
Back to the drawing board, and this time there was a plan. We decided to hide behind multiple proxies, emulate human behavior and avoid generating burst traffic.
The simple setup consisted of:
Bot machines to generate fake traffic. For this instance, we had a bot written in python leveraging Selenium.1
Proxy servers to distribute the traffic across different geographies. We used a combination of proxies available on the Internet and added a few of our own in two different AWS regions. The machines used were in the free tier of usage from a cloud provider and running instances of Tinyproxy.2
A target article selected to isolate the fake traffic and not interfere with the regular statistics.

Figure 2. Setup to generate fake traffic.
The Results
With the setup complete, we decided to take it for a spin and send fake requests for a single article, distributed over two days and the proxies located in different regions. This time the results were in our favor:
The proxy servers helped maintain the traffic distribution pattern. As shown in Figure 3, the traffic merged well and there were no major spikes from any region.
We managed to boost the viewership. Figure 4 shows the page view of an old article (in light blue) and how it takes a jump with fake traffic, shown in dark blue. The graph implies there is renewed interest in the content.

Figure 4. Page view comparison with and without fake bot traffic.
With some additional tweaks (like clicking on links, scrolling the page), we were able to keep statistics like page velocityA measure of how many additional page views the content drive. This is good for determining content that drives additional engagement. in normal range and engagement rateEngagement Rate = EEC Visits / total visits where EEC = A visit where the engagement level includes a certain amount average time on site, scroll depth, and clicks at 2.39%. Overall, the fake traffic merged well with genuine traffic. Had we continued pumping fake traffic, the old article would have ranked better in page views than a new report (take that Phishing and Fraud Report).

Figure 5. Metrics manipulation by bot-generated traffic
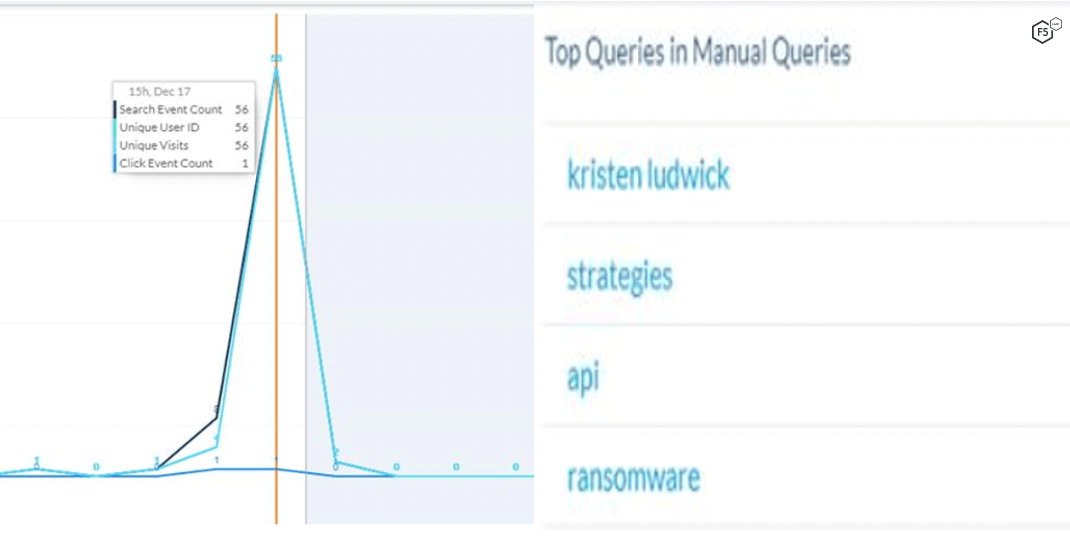
Next it was time to mess with other team members. There is a keen interest in the team to see what users search for, be it author, article topic or attack type. The bots decided to thank Kristen for all the help, so we made her name the most searched-for term for a short period of time (we didn’t want her to get in trouble).

Figure 6. Unique users search to manipulate the trending list
Conclusion
Data forms the basis of our trust, yet with a little bit of preparation and knowledge of freely available tools, we managed to manipulate it to our advantage. Our little experiment was programmed to be harmless, but the same tricks can be used to trick enterprises’ metrics of their sensitive digital assets, and at a much greater scale. For example, constant price scraping by bots can result in skewed analytics on popular routes for airlines; content scraping creates fake impressions for digital marketing teams. This fake traffic comes with a price tag as organizations these days scale up/down their assets and inventory based on the data insights. As a result, it could be time for some organizations to deploy mechanisms to protect the integrity of the data and deny ingestion of fake and fabricated traffic.
Recommendations
- Deploy an anti-bot, anti-abuse solution to block fake traffic
- Deploy a mechanism for detecting data anomalies


