Threat Stack is now F5 Distributed Cloud App Infrastructure Protection (AIP). Start using Distributed Cloud AIP with your team today.
Has this host been compromised? Did this host always do this?
Everyone who has worked in operations/engineering/security has at some time had a server or servers that are exhibiting unexpected behavior. It might be running weird processes, consuming more memory than expected, accepting requests, making connections out to GitHub, whatever.
The first step to triaging an event is knowing you have one. There are a number of data sources that can potentially point you to a particular host server:
- Monitoring tools that measure things like disk and memory space
- Security intrusion detection systems generating alerts
- Application logs showing failures reaching out to particular hosts
At this point, there is some server we want to go to and get more information about. Assuming that every piece of system data doesn’t necessarily fit into our SIEM, the next logical step is to connect to the host and start querying the operating system directly for what it’s doing. Depending on your level of familiarity with the environment, this can be as broad as tools like uname and vmstat to more specific items like ps and lsof. Either case, you will be shown what the host is currently doing. Here is the problem with this process: You don’t actually care about the current state; you want to know what changed. Much like getting a pull request in git, you don’t want to review the whole code base — just the parts that have been modified.
Data portability to Amazon S3
Here in the Threat Stack Cloud SecOps Program℠, the security analysts in our SOC have developed a solution to help us answer these types of questions for our customers. The Threat Stack Cloud Security Platform® has this nifty feature we call data portability. At a high level, this allows us to take the telemetry we gather from hosts, including things like executables running, users, command line arguments, connections, etc. and store them in S3 buckets.
What is great about S3 blobs is that they’re an inexpensive way to store lots and lots of data. What is a problem is leveraging lots and lots of non-indexed data. To that end, we ended up using Amazon EMR to create Jupyter PySpark notebooks to use Apache Spark DataFrames and Python pandas DataFrames to create a powerful tool for comparing the current state of a machine to any prior state we have in retention.
ETL (everyone’s favorite)
Here are a couple of notes before looking at our code examples. The tables and schema references are held in AWS Glue and match Threat Stack’s raw event format for Linux systems. You can append this data to your existing data lake. Then there is a setting defined for the Spark cluster that tells it to read from Glue to know what tables and columns are available. Then, when a cluster is created, you can reference the table within the JupyterLab notebook.
Note: The following code is totally real; the situation is contrived. A security analyst was asked to compromise a host with our agent running on it at some time on Valentine’s Day. The goal was to figure out what was done.
Let’s get into the code
The first things we need to create are our SparkSession and SparkContext. Happily, when using a PySpark notebook, those are automatically instantiated when we run our first cell.

Setting up our PySpark notebook.
We got an object spark which we will reference later, and we also got sc, which is our spark context. We can then use that to load in pandas and Matplotlib.

Installing packages.
In this next step, I am going to confirm the column names by creating a spark.table() based off the Glue tables, then display my inherited schema.
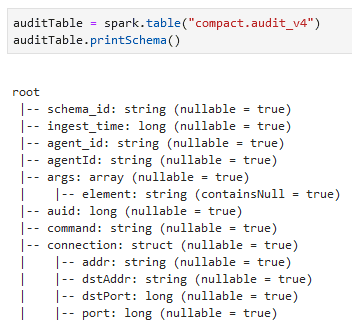
Reading the structure of our columns loaded in from AWS Glue.
Great, now I can see what columns and types I have available to start running my SQL queries against. I can now take any server, and any time range I want, and compare them. Here, I’m creating two Spark DataFrames, gathering the data I’ll need to do pre-incident investigation and post-incident forensics:
SELECT date_key, timestamp, tsEventType, syscall, connection, user, command, exe, args FROM compact.audit_v4 WHERE date_key >= '2020-02-05-00' AND date_key < '2020-02-14-00' AND organization_id = '5a8c4a54e11909bd290021ed' AND agent_id = 'b0f6bdb2-9904-11e9-b036-25972ec55a45' GROUP BY date_key, timestamp, tsEventType, syscall, connection, user, command, exe, args SELECT date_key, timestamp, tsEventType, syscall, connection, user, command, exe, args FROM compact.audit_v4 WHERE date_key >= '2020-02-14-00' AND date_key < '2020-02-17-00' AND organization_id = '5a8c4a54e11909bd290021ed' AND agent_id = 'b0f6bdb2-9904-11e9-b036-25972ec55a45' GROUP BY date_key, timestamp, tsEventType, syscall, connection, user, command, exe, args
Grouping the data around our compromise date of February 14. (Some notebook cells displayed here as GitHub Gists for readability.)
Now for a quick sanity check on how much data I have collected:
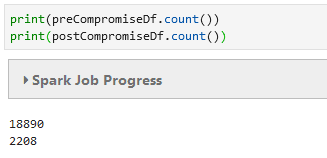
Counting the number of records in both Spark DataFrames to ensure a reasonable amount for investigation.
That seems right. I have a much larger time range for my preCompromiseDf versus my postCompromiseDf. (The “Df” is to help me remember that these are Spark DataFrame objects — simply a naming convention.)
Apache Spark DataFrames are nice because they store the entire DataFrame across the cluster. This is great for massive data sets, but in this case, I actually have a relatively small number of records I want to compare. To that end, I run toPandas() to move that data into my notebook machine’s memory, which will allow faster computation.
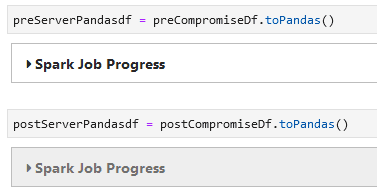
Since we’re not dealing with “big data,” in this case it’s faster to run the rest of our analysis locally.
Starting our analysis
Now I can start doing powerful things, like checking out what are the new executables running on this server since midnight of February 14.
/tmp/EXCITED_WHILE
/usr/bin/wget
/tmp/FRONT_RUN
/tmp/UNUSUAL_COMB
/tmp/SURROUNDING_LOCK
/tmp/nmap
/usr/bin/scp
/tmp/sliver
/tmp/sliver2
/tmp/PROUD_THUMB
A list of executables running on the server during the night in question.
Well hello there, some random capitalized executable names: nmap, scp, wget, and something called sliver. A little googling reveals that sliver is most likely associated with https://github.com/BishopFox/sliver and is an implant framework that supports command and control over multiple protocols.
I have the proof I need that my server has been compromised, but I want to do my due diligence and see what was actually done with these executables. Using my list as a filter against the same DataFrame, I can pull out other details and indicators of compromise (IoC):
exe args
80 /tmp/EXCITED_WHILE ./EXCITED_WHILE
162 /usr/bin/wget wget https://github.com/andrew-d/static-binari...
255 /tmp/EXCITED_WHILE ./EXCITED_WHILE
256 /tmp/FRONT_RUN ./FRONT_RUN
359 /tmp/UNUSUAL_COMB ./UNUSUAL_COMB
360 /tmp/SURROUNDING_LOCK ./SURROUNDING_LOCK
464 /tmp/nmap
494 /tmp/SURROUNDING_LOCK ./SURROUNDING_LOCK
533 /tmp/EXCITED_WHILE ./EXCITED_WHILE
589 /tmp/FRONT_RUN ./FRONT_RUN
603 /tmp/EXCITED_WHILE ./EXCITED_WHILE
658 /tmp/EXCITED_WHILE ./EXCITED_WHILE
660 /tmp/FRONT_RUN ./FRONT_RUN
671 /usr/bin/scp scp -t /tmp/
699 /tmp/SURROUNDING_LOCK ./SURROUNDING_LOCK
738 /tmp/UNUSUAL_COMB ./UNUSUAL_COMB
762 /tmp/sliver ./sliver
816 /tmp/SURROUNDING_LOCK ./SURROUNDING_LOCK
834 /tmp/sliver2 ./sliver2
878 /tmp/nmap /tmp/nmap
909 /tmp/EXCITED_WHILE ./EXCITED_WHILE
937 /tmp/FRONT_RUN ./FRONT_RUN
992 /tmp/FRONT_RUN ./FRONT_RUN
1023 /tmp/FRONT_RUN
1040 /usr/bin/scp scp -t /tmp/
...
Extracting any related arguments associated with my list of suspicious executables.
So scp was used for moving files, wget pulled down some code from GitHub (going to that row shows me that is how nmap got on the system), and the details of execution of those other files are contained inside the file itself, as they received no command line arguments. At this point it makes sense to take a host snapshot for evidence and terminate the instance.
The final step is to confirm that no other hosts in the environment have been compromised. For this we will take a few items from our previous IoC list and check that across all servers.
SELECT date_key, timestamp, tsEventType, syscall, connection, user, command, exe, args, agentId, tty, session, cwd FROM compact.audit_v4 WHERE date_key >= '2020-01-01' AND date_key <= '2020-02-29' AND organization_id = '5a8c4a54e11909bd290021ed' AND tsEventType = 'audit' AND syscall = 'execve' GROUP BY date_key, timestamp, tsEventType, syscall, connection, user, command, exe, args, agentId, tty, session, cwd
52
That query returns 52 results across the entire environment for suspicious nmap and sliver activity. We can further narrow down this view by moving into a pandas DataFrame and grouping the results by each server:

Getting started with your own Threat Stack analytics
Thank you for staying with me through this post. I am super excited about the possibilities this data provides and finding new ways to explore it. If you currently leverage the Threat Stack platform you can set up your own data portability using this documentation as a guide. The benefit is that you can decide the right level of data to retain for your own business needs.
For folks who leverage our Threat Stack Oversight℠ service, we have 30 days of event data and are happy to work with you to provide deeper forensics on your environment leveraging this toolset in the event you don’t have a data lake.
The next step for the Threat Stack Security Operations team is to start looking to incorporate more graphics and charts to help parse the data visually as part of our next analysis using data science notebooks. More to come on that, but here is a first pass at some IPs geolocated (the density of each circle indicates the number of connections).
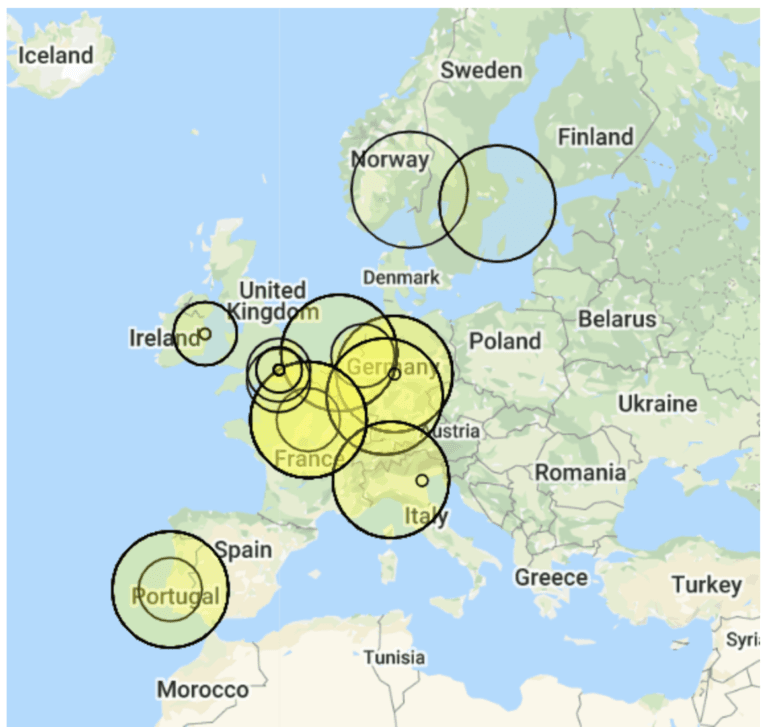
More analytics visualizations coming soon from the Threat Stack Security team!
Threat Stack is now F5 Distributed Cloud App Infrastructure Protection (AIP). Start using Distributed Cloud AIP with your team today.
About the Author
Related Blog Posts

Build a quantum-safe backbone for AI with F5 and NetApp
By deploying F5 and NetApp solutions, enterprises can meet the demands of AI workloads, while preparing for a quantum future.
F5 ADSP Partner Program streamlines adoption of F5 platform
The new F5 ADSP Partner Program creates a dynamic ecosystem that drives growth and success for our partners and customers.

Accelerate Kubernetes and AI workloads with F5 BIG-IP and AWS EKS
The F5 BIG-IP Next for Kubernetes software will soon be available in AWS Marketplace to accelerate managed Kubernetes performance on AWS EKS.
F5 NGINX Gateway Fabric is a certified solution for Red Hat OpenShift
F5 collaborates with Red Hat to deliver a solution that combines the high-performance app delivery of F5 NGINX with Red Hat OpenShift’s enterprise Kubernetes capabilities.
F5 Silverline Mitigates Record-Breaking DDoS Attacks
Malicious attacks are increasing in scale and complexity, threatening to overwhelm and breach the internal resources of businesses globally. Often, these attacks combine high-volume traffic with stealthy, low-and-slow, application-targeted attack techniques, powered by either automated botnets or human-driven tools.
Phishing Attacks Soar 220% During COVID-19 Peak as Cybercriminal Opportunism Intensifies
David Warburton, author of the F5 Labs 2020 Phishing and Fraud Report, describes how fraudsters are adapting to the pandemic and maps out the trends ahead in this video, with summary comments.