
Out of a hundred people, only five are managing to get the insights they need from the myriad monitoring tools they use to track the performance, availability, and security of their digital assets.
The other ninety-five? They might as well as be staring at cute but ineffective Venn diagrams.

One of the causes of missing insights is not a dearth of tools or even a lack of data; it’s the continuous bias in the data.
Continuous Data Bias
Data bias is caused by opinionated curation within a system. Opinionated curation is the result of decisions made regarding everything from what data is collected and from what systems, to how visualizations are displayed on dashboards.
One of the most significant sources of data bias is the legacy of agent-based systems, which require additional software to be deployed on any system from which you want to collect data. Agents are usually paired with an analytics platform, and in the past the pricing of these products often included the cost of agents. Discounted for large deployments, of course, but nonetheless a costly proposition.
The cost of deploying—and managing—agents introduced data bias because it limited the systems from which you could collect data. Opinions—experienced or not—regarding the worthiness of monitoring a given application or system often drove the deployment decision.
The volume of data generated, too, is a source of continuous bias because it led to decisions based on the opinion of the value of specific data points. Do you really need all those metrics, or can we just limit it to three or four? The opinionated curation of metrics means there’s no way to validate shifts or changes in the data overall. Those shifts or changes could be indicative of a potential problem—or risk—but are missed because the data was deemed insignificant.
Finally, dashboard decisions about visualization further bias interpretation and are often based on skills and experiences that may not be shared with others who use the dashboard. Even the choice of graph can introduce bias. This is particularly true for time-series based operational metrics like performance and uptime.
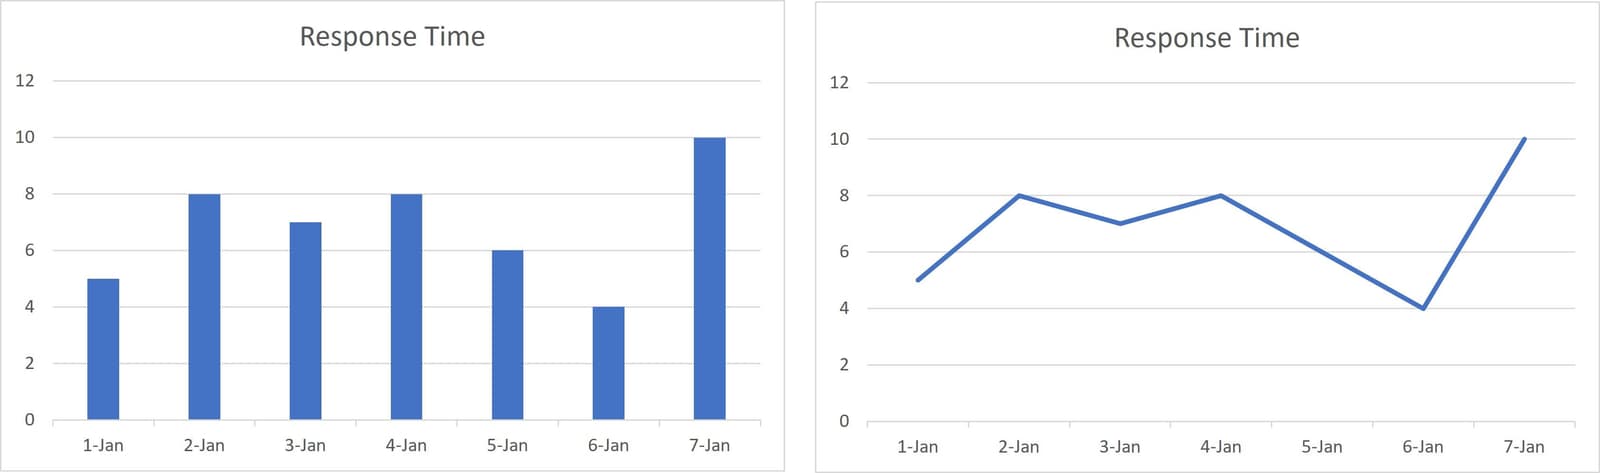
Bar charts are often used to chart time-series data but aren’t as impactful as line charts. A bar chart forces us to compare bar heights to understand shifts in response time rather than allowing the shape of the line show us what’s happening. These simple decisions can have a profound impact on operators who rely on visualization to offer insight into the operating state of a system.
All these decisions introduce bias, continually, into the data and impact our ability to interpret it—and thus gain insight into what it really means.
Eliminating Data Bias
If we want better decisions in a digital as default world, we’re going to need better data and that means eliminating as much data bias as we can.
This is one of the reasons OpenTelemetry is so promising. Standardizing the way telemetry is generated and ingested using open-source (and thus lower-to-no-cost) agents will go a long way toward eliminating one of the root causes of data bias: the IT budget. By ensuring you can collect telemetry from every system rather than just a few deemed "worthy," you eliminate a significant source of bias in your data. That’s why our vision of edge includes the notion of embedding telemetry generation into the platform itself, so it’s always available, everywhere.
Data lake as a service, too, can be an effective means of address the bias introduced by curation due to volume and cost to store over time. By outsourcing scale and capacity, organizations can more freely ingest more telemetry, making it easier to uncover anomalies and patterns that impact performance and more. Over the past five years we’ve seen a growing menu of such services, often rolled up as part of the XaaS category that continues to consume IT budget at an increasing rate. Deloitte noted in a report on XaaS this year that nearly half of organizations will allocate at least half of its IT spending to XaaS.
Finally, by migrating from visualizations to insights, the issue with bias in dashboard delivery of operational data can be addressed. Rather than just displaying snapshots of data points in time, insights deliver information based on patterns and relationships discovered in the data. What’s more, insights can eliminate unnecessary fire drills caused by reliance on binary metrics. Modern systems are built to fail and recover automatically. Being notified whenever that happens can cause alert fatigue that drives down productivity. The ability to analyze telemetry in the context of an entire user flow means understanding when a failed component requires intervention and when it doesn’t. Migrating from a mode that relies on interpreting multiple visualizations to leveraging comprehensive insights can eliminate some of the bias inherent in visualization.
As business approaches a default-digital model, it necessarily relies more and more on data. Eliminating bias in that data will be a critical step in ensuring that decisions based on that data will lead to the best outcome possible for customers and the business.
About the Author

Lori MacVittie is a Distinguished Engineer and Chief Evangelist in F5’s Office of the CTO with deep expertise in application delivery, automation strategy, and infrastructure. She is known for turning complexity into clarity whether she’s defining guardrails for AI agents, dissecting brittle multicloud architectures, or probing the limits of scalable systems. She brings more than thirty years of industry experience across application development, IT architecture, and network and systems operations. Before joining F5, she served as an award-winning technology editor. MacVittie holds an M.S. in Computer Science and is a prolific author whose publications span security, cloud, and enterprise architecture. She is also an avid tabletop and video gamer with unapologetically strong opinions about cheese.
More blogs by Lori Mac VittieRelated Blog Posts
Multicloud chaos ends at the Equinix Edge with F5 Distributed Cloud CE
Simplify multicloud security with Equinix and F5 Distributed Cloud CE. Centralize your perimeter, reduce costs, and enhance performance with edge-driven WAAP.

At the Intersection of Operational Data and Generative AI
Help your organization understand the impact of generative AI (GenAI) on its operational data practices, and learn how to better align GenAI technology adoption timelines with existing budgets, practices, and cultures.
Using AI for IT Automation Security
Learn how artificial intelligence and machine learning aid in mitigating cybersecurity threats to your IT automation processes.
Most Exciting Tech Trend in 2022: IT/OT Convergence
The line between operation and digital systems continues to blur as homes and businesses increase their reliance on connected devices, accelerating the convergence of IT and OT. While this trend of integration brings excitement, it also presents its own challenges and concerns to be considered.
Adaptive Applications are Data-Driven
There's a big difference between knowing something's wrong and knowing what to do about it. Only after monitoring the right elements can we discern the health of a user experience, deriving from the analysis of those measurements the relationships and patterns that can be inferred. Ultimately, the automation that will give rise to truly adaptive applications is based on measurements and our understanding of them.
Inserting App Services into Shifting App Architectures
Application architectures have evolved several times since the early days of computing, and it is no longer optimal to rely solely on a single, known data path to insert application services. Furthermore, because many of the emerging data paths are not as suitable for a proxy-based platform, we must look to the other potential points of insertion possible to scale and secure modern applications.