
At Shape we come across many sketchy pieces of JavaScript. We find scripts that are maliciously injected into pages, they might be sent by a customer for advice, or our security teams might find a resource on the web that seems to specifically reference some aspects of our service. As part of our everyday routine, we dive into the scripts head first to understand what they’re doing and how they work. They are usually minified, often obfuscated, and always require multiple levels of modification before they are really ready for deep analysis.
Until recently, the easiest way to do this analysis was either with locally cached setups that enable manual editing or by using proxies to rewrite content on the fly. The local solution is the most convenient, but websites do not always translate perfectly to other environments and it often leads people down a rabbit hole of troubleshooting just to get productive. Proxies are extremely flexible, but are usually cumbersome and not very portable – everyone has their own custom setup for their environment and some people are more familiar with one proxy vs another. I’ve started to use Chrome and its devtools protocol in order to hook into requests and responses as they are happening and modify them on the fly. This is portable to any platform that has Chrome, bypasses a whole slew of issues, and integrates well with common JavaScript tooling. In this post, I’ll go over how to intercept and modify JavaScript on the fly using Chrome’s devtools protocol.
We’ll use node but a lot of the content is portable to your language of choice provided you have the devtools hooks easily accessible.
First off, if you’ve never explored scripting Chrome, Eric Bidelman wrote up an excellent Getting Started Guide for Headless Chrome. The tips there apply to both Headless and GUI Chrome (with one quirk I’ll address in the next section).
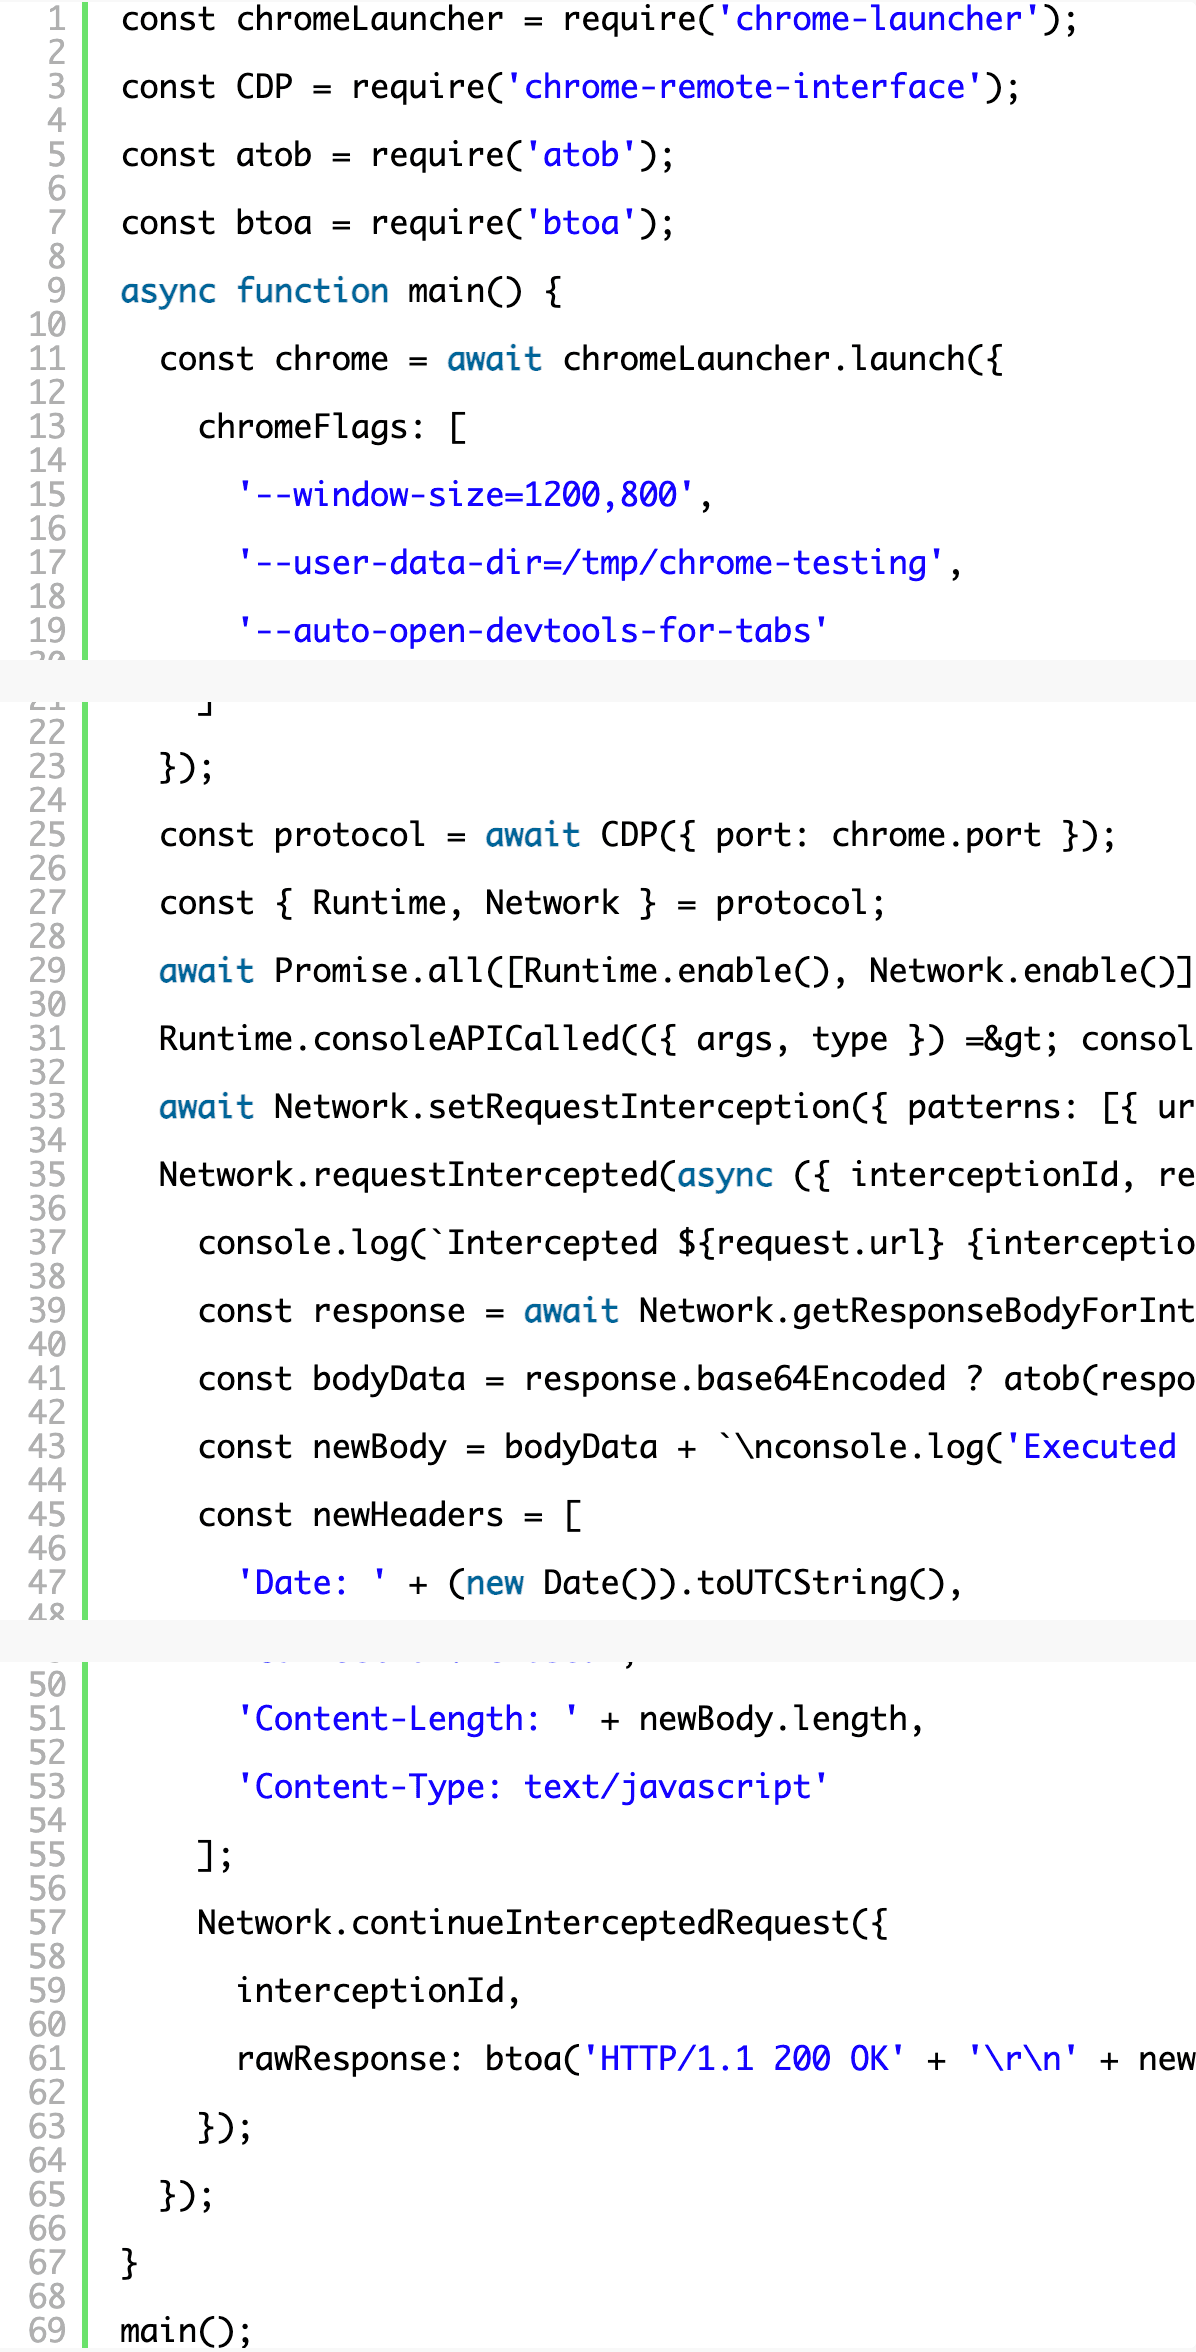
Launching Chrome
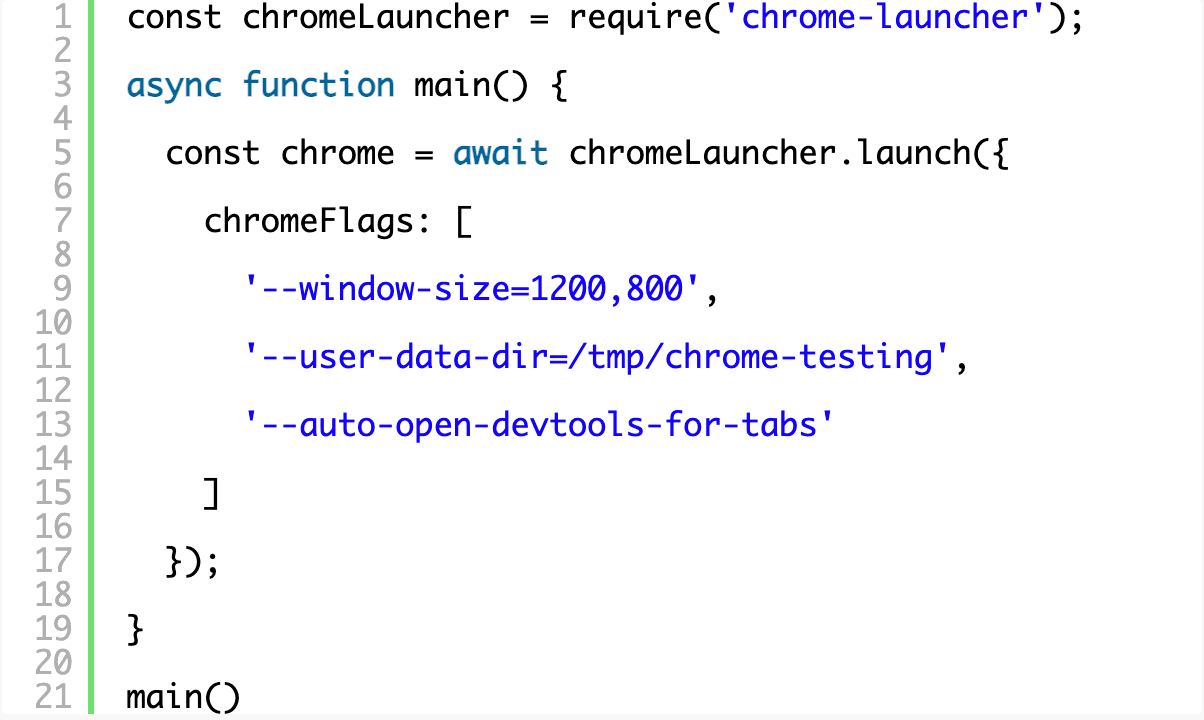
We’ll use the chrome-launcher library from npm to make this easy.
chrome-launcher does precisely what you think it would do and you can pass the same command line switches you’re used to from the terminal unchanged (a great list is maintained here). We’ll pass the following options:
–window-size=1200,800
- Automatically set the window size to something reasonable.
–auto-open-devtools-for-tabs
- Automatically open up the devtools because we use them frequently.
–user-data-dir=/tmp/chrome-testing
- Set a constant user data directory. (Ideally we wouldn’t need this but non-headless mode on Mac OSX doesn’t seem to allow you to intercept requests without this flag. If you know of a better way, please let me know via Twitter!)
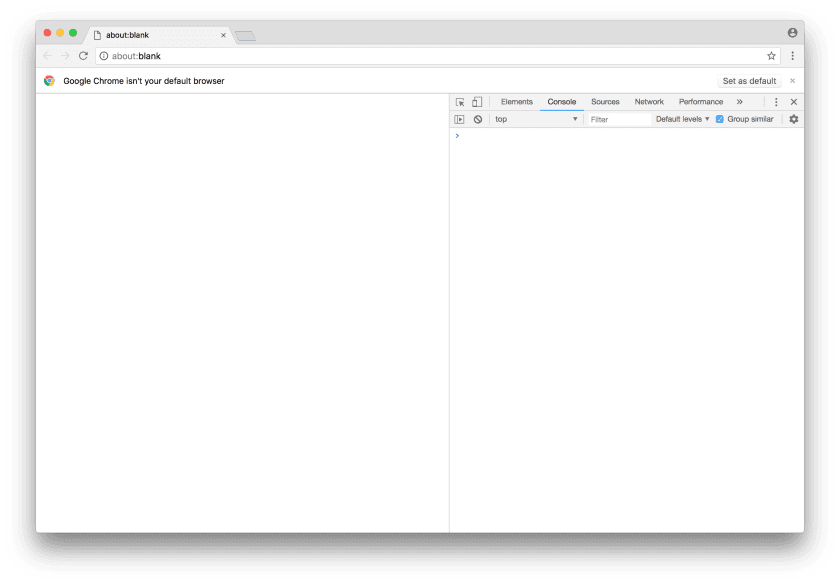
Try running your script to make sure you’re able to open Chrome. You should see something like this:
Using the Chrome Devtools Protocol
This is also referred to as the “Chrome debugger protocol,” and both terms seem to be used interchangeably in Google’s docs. First, install the package chrome-remote-interface via npm which gives us convenient methods to interact with the devtools protocol. Make sure to have the protocol docs handy if you want to dive in more deeply.
To use the CDP, you need to connect to the debugger port and, because we’re using the chrome-launcher library, this is conveniently accessible via chrome.port.
Many of the domains in the protocol need to be enabled first, and we’re going to start with the Runtime domain so that we can hook into the console API and deliver any console calls in the browser to the command line.
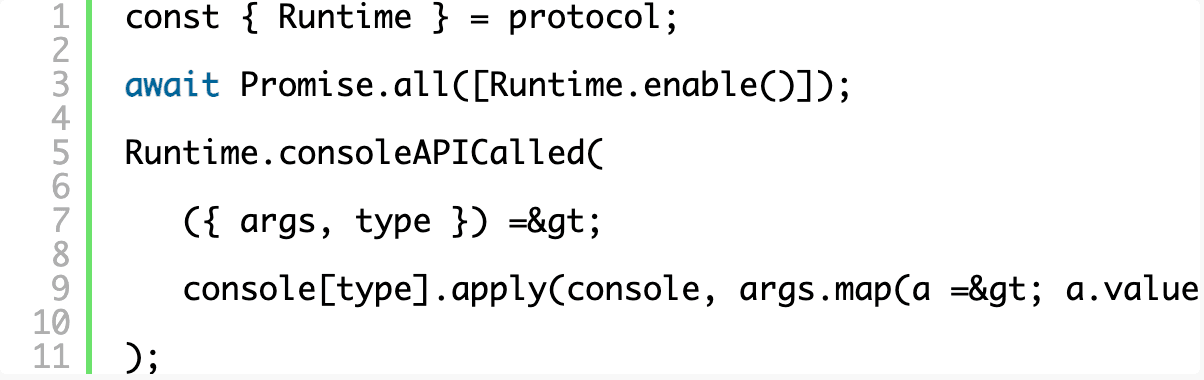
Now when you run your script, you get a fully functional Chrome window that also outputs all of its console messages to your terminal. That’s awesome on its own, especially for testing purposes!
Intercepting requests
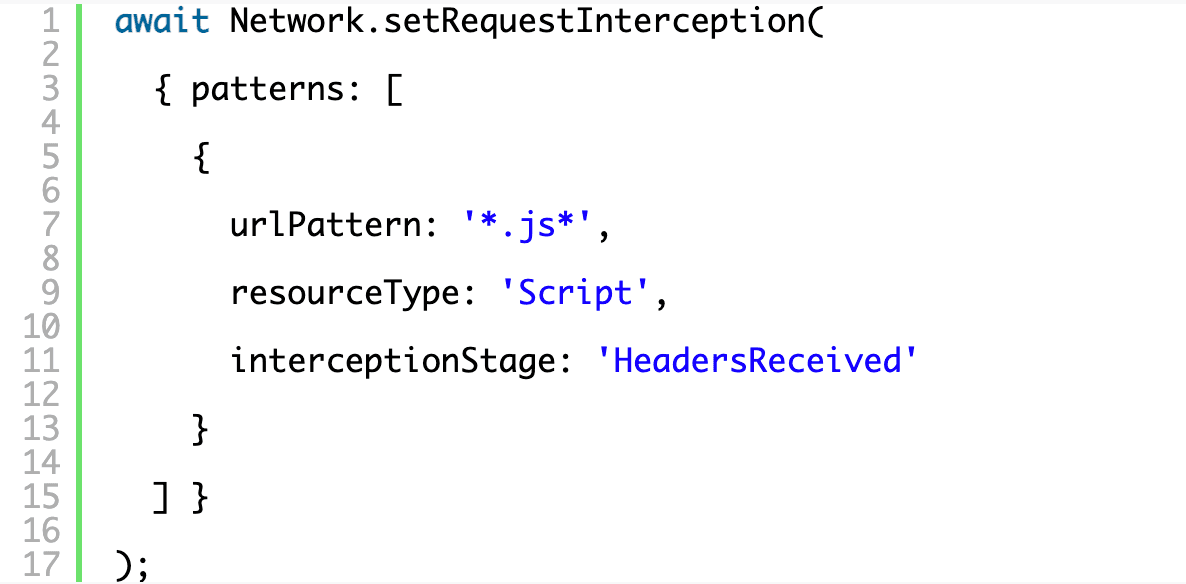
First, we’ll need to register what we want to intercept by submitting a list of RequestPatterns to setRequestInterception. You can intercept at either the “Request” stage or the “HeadersReceived” stage and, to actually modify a response, we’ll need to wait for “HeadersReceived”. The resource type maps to the types that you’d commonly see on the network pane of the devtools.
Don’t forget to enable the Network domain as you did with Runtime, above, by adding Network.enable() to the same array.
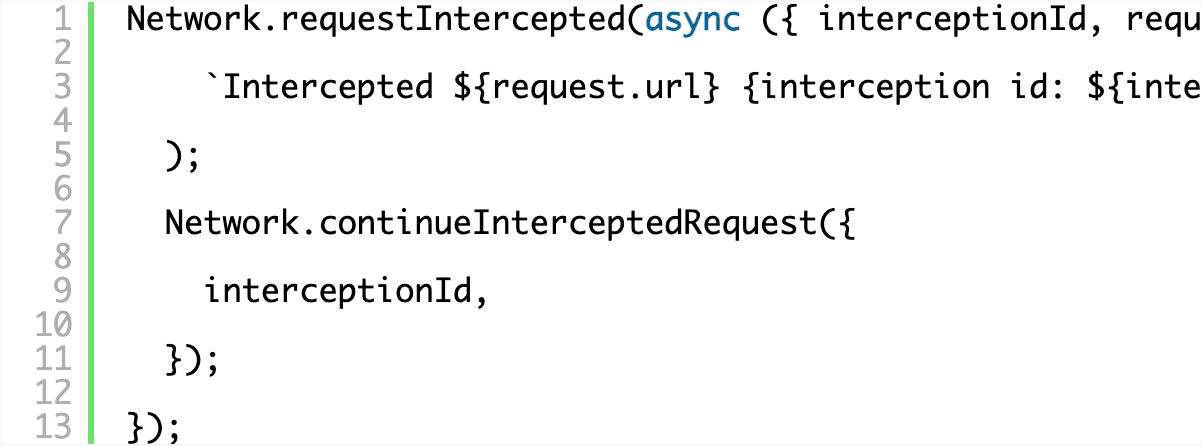
Registering the event handler is relatively straightforward and each intercepted request comes with an interceptionId that can be used to query information about the request or eventually issue a continuation. Here we’re just stepping in and logging every request we intercept to the terminal.
Modifying requests
To modify requests we’ll need to install some helper libraries that will encode and decode base64 strings. There are loads of libraries available; feel free to pick your own. We’ll use atob and btoa.
The API to deal with responses is a little awkward. To handle responses, you need to include all your response logic on the request interception (as opposed to simply intercepting a response, for example) and then you have to query for the body by the interception ID. This is because the body might not be available at the time your handler is called and this allows you to explicitly wait for just what you’re looking for. The body can also come base64 encoded so you’ll want to check and decode it before blindly passing it along.

At this point you’re free to go wild on the JavaScript. Your code puts you in the middle of a response allowing you to both access the complete JavaScript that was requested and send back your modified response. Awesome! We’ll just tweak the JS by appending a console.log at the end of it so that our terminal will get a message when our modified code is executed in the browser.
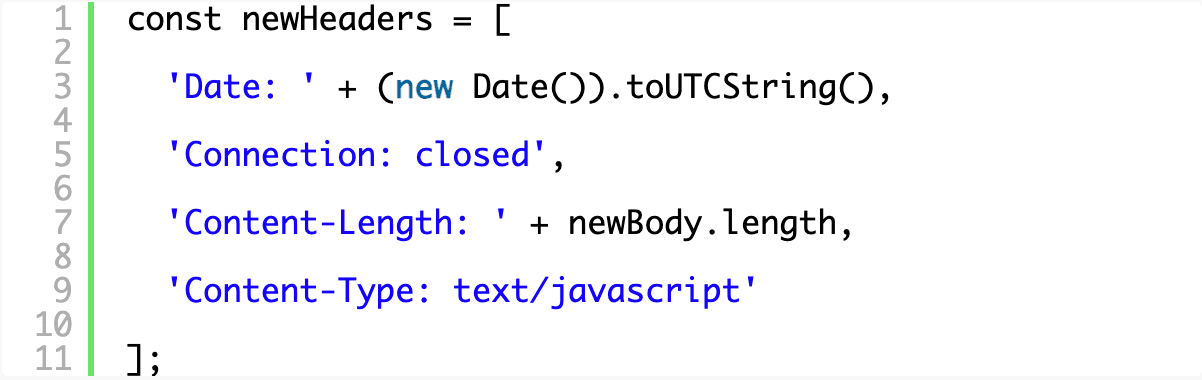
We can’t simply pass along a modified body alone because the content might conflict with the headers that were sent with the original resource. Since you’re actively testing and tweaking, you’ll probably want to start with the basics before worrying too much about any other header information you need to convey. You can access the response headers via responseHeaders passed to the event handler if necessary, but for now we’ll just craft our own minimal set in an array for easy manipulation and editing later.
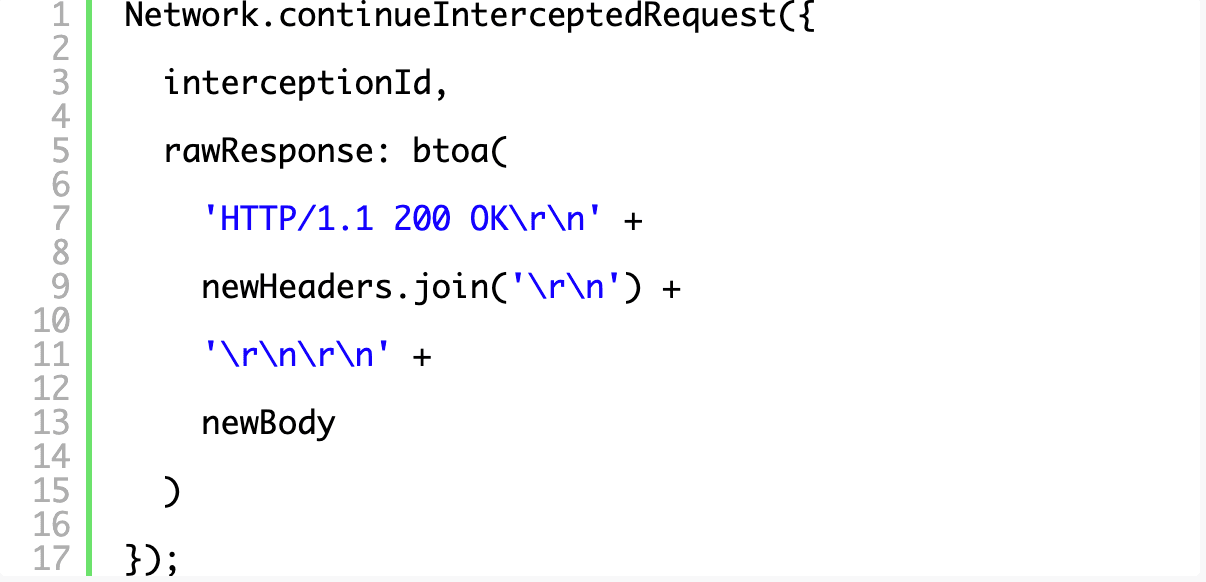
Sending the new response down requires crafting a full, base64 encoded HTTP response (including the HTTP status line) and sending it through a rawResponse property in the object passed to continueInterceptedRequest.
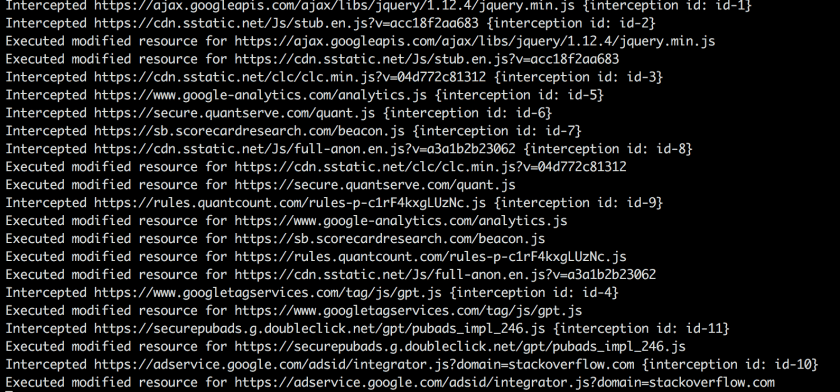
Now, when you execute your script and navigate around the internet, you’ll see something like the following in your terminal as your script intercepts JavaScript and also as your modified JavaScript executes in the browser and the console.log()s bubble up through the hook we made at the start of the tutorial.
The complete working code for the basic example is here:
Where to go from here
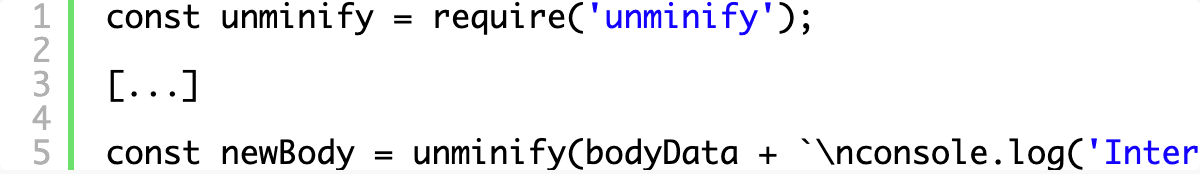
You can start by pretty printing the source code, which is always a useful way to start reverse engineering something. Yes, of course, you can do this in most modern browsers but you’ll want to control each step of modification yourself in order to keep things consistent across browsers and browser versions and to be able to connect the dots as you analyze the source. When I’m digging into foreign, obfuscated code I like to rename variables and functions as I start to understand their purpose. Modifying JavaScript safely is no trivial exercise and that’s a blog post on its own, but for now you could use something like unminify to undo common minification and obfuscation techniques.
You can install unminify via npm and wrap your new JavaScript body with a call to unminify in order to see it in action:
We’ll dive more into the transformations in the next post. If you have any questions, comments, or other neat tricks, please reach out to me via Twitter!
About the Author
Related Blog Posts

Secure-by-design storage for agentic AI: Why runtime visibility plus traffic control matters
Learn how F5 is collaborating with NVIDIA to help protect agentic AI with secure-by-design AI infrastructure, runtime visibility, and traffic control.

F5 joins the Dell AI Ecosystem Program to help enterprises operationalize AI
F5 joins the Dell AI Ecosystem Program to help enterprises deploy production AI with greater performance, security, and control.

Why sub-optimal application delivery architecture costs more than you think
Discover the hidden performance, security, and operational costs of sub‑optimal application delivery—and how modern architectures address them.

Architecting for AI: Secure, scalable, multicloud
Operationalize AI-era multicloud with F5 and Equinix. Explore scalable solutions for secure data flows, uniform policies, and governance across dynamic cloud environments.

AppViewX + F5: Automating and orchestrating app delivery
As an F5 ADSP Select partner, AppViewX works with F5 to deliver a centralized orchestration solution to manage app services across distributed environments.

F5 NGINX Gateway Fabric is a certified solution for Red Hat OpenShift
F5 collaborates with Red Hat to deliver a solution that combines the high-performance app delivery of F5 NGINX with Red Hat OpenShift’s enterprise Kubernetes capabilities.