
This specific blog describes how Volterra helps users operate their applications and infrastructure like a fleet. We will explain how our control-plane based approach eases operations of a large fleet of app clusters and compare it with other multi-cluster management-plane approaches like Google Anthos, Azure Arc, Rancher, etc.
By now, you might be wondering if we are just doing a marketing spin and calling our multi-cluster management as fleet operations! Multi-cluster management and fleet operations approaches address different use cases and are fundamentally different in their architectures. A multi-cluster approach is designed to address the scenarios when there are relatively few clusters and the user wants to manage these infrastructure clusters using a consistent operational model. Whereas, fleet approach is designed to address the scenarios when there are a large scale of clusters (eg. such as K8s clusters in robots, automotive, industrial gateways, tens of public-cloud regions, etc) and the user wants to deploy the same application and network/security on these large scale of clusters. The next two sections describe and compare multi-cluster and fleet operations approach in greater detail.
Multi-Cluster Approach
A Multi-cluster management approach is designed to address use-cases when there are relatively few clusters under the operations of a single team. Examples of such scenarios include 10s of clusters across a few availability zones to reduce the blast radius. Similarly, users might choose to have multiple clusters across a few regions to address regulatory needs.
The following two examples highlight how multi-cluster solutions work (at a high level):
Configuration
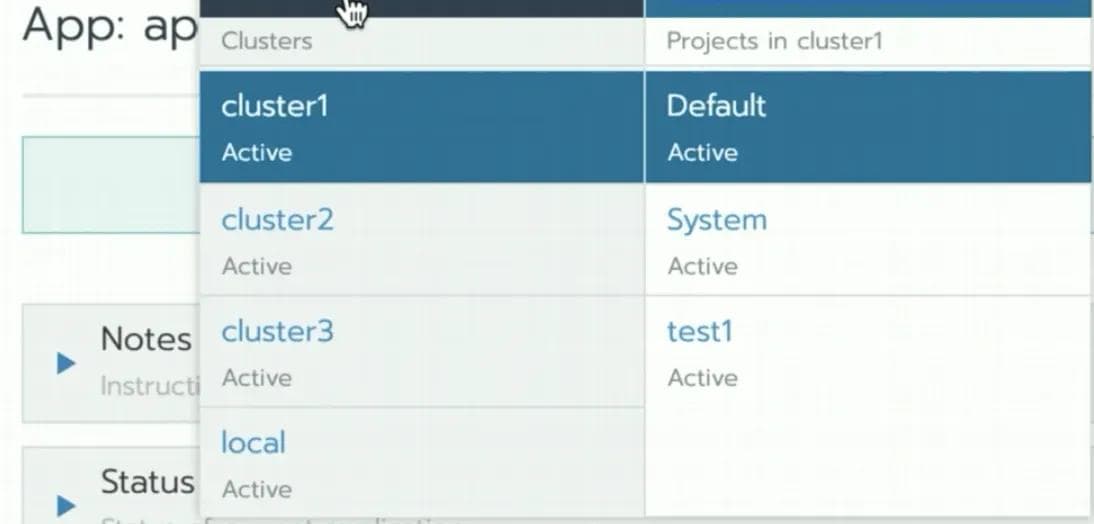
Let’s take an example of an application deployment using a multi-cluster approach from Rancher as shown in Figure 1. In a multi-cluster approach, the customer selects the target sites for application deployment one-by-one. This approach of selecting target sites one-by-one works when you have a few clusters. However, this approach isn’t designed for say, a thousand clusters.

Observability
Figure 2 shows how observability works in a multi-cluster approach using Rancher as an example. In a multi-cluster approach, the customer has to double click on each cluster one-by-one to see the status of pods deployed, CPU and memory resource utilization. This approach of observing target sites one-by-one is apt for a small number of clusters but not for managing large numbers of clusters.
Cluster 1:
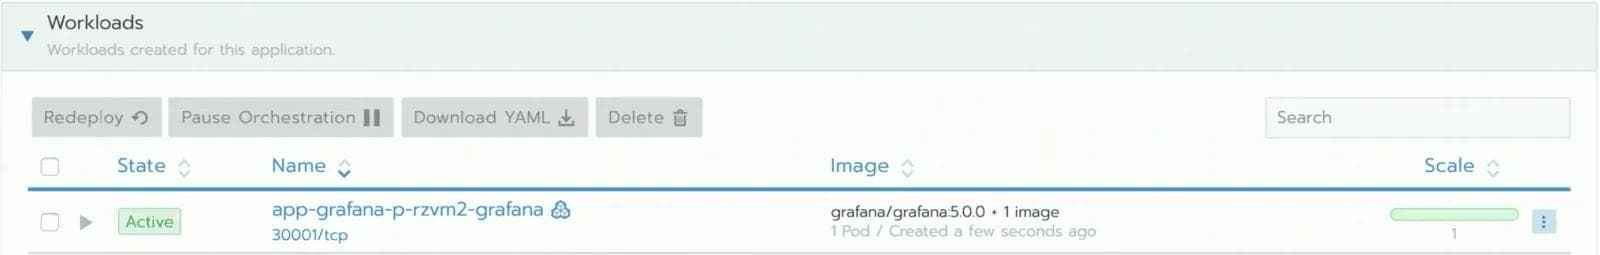
Cluster 2:

An obvious approach to solving the problem described in the first example would be to write some form of automation that would repeat tasks for each of the clusters. For example, whenever a new cluster is added, the script could do the following operation to deploy a new application (checkoutservice for example)
export KUBECONFIG=~/Documents/kubeconfig/ce01-ashburn-aws-staging
kubectl apply -f checkoutservice.yaml
However, automation will have to be built for each operation — deployment, upgrade, policy, resource reservation, etc. This automation will have to not only perform the individual operation across many clusters but also need to take care of handling failure conditions. Also, when there are complex scenarios — eg. beta testing on a subset of clusters, rolling upgrades across all the clusters — the automation will become more and more complex. We realized this early in the process and built a distributed control plane that delivers all of this functionality — using a fleet operations approach described next.
Volterra’s Fleet Operations Approach
Fleet Operations means that customer declaratively defines his/her intent once for the fleet, and the system takes over the responsibility of ensuring the impacted sites are aligned with the defined intent. Examples of intent include application software version, infrastructure software version (e.g., operating system version), network policy, security policy, and resource reservation.
Once the intent takes effect, the system enables users to view the status and health of the fleet. What this means is that users get an aggregated view of the health of the infrastructure and applications across all sites in the fleet in a single pane of glass, reducing operational complexity for the customer’s operations team. Users don’t have to click into each site or cluster one by one to determine health and write automation tooling to aggregate the information.
Volterra’s fleet operations approach consists of three main components — Segmentation, Configuration, and Observability that we will discuss in the following sections.
Fleet Segmentation
Users often have a mix of sites in the fleet such as dev, test, production compute sites. Different workloads need to be deployed to a specific segment of sites due to organization policies such as dev workloads only go on dev sites. We allow users to flexibly tag sites with a label that is made up of two parts, key and value. Examples include:
- Label-Key=region. Label-value = US-West, JP-North, JP-south
- model-year=(2015, 2016, 2017, 2018)
- function=(spray, weld)
Once the sites are tagged, users can define a “virtual site” using label key-value conditions. In a multi-cloud scenario, users can tag their sites as dev, pre-prod, prod for example. The following Figure 3 shows an example of a robotics use case using the label-key values described earlier.

Here is a configuration snippet on Volterra where the user can use blend/go-sdk syntax to create a virtual site. In this particular example, the individual sites were tagged with label key=ves.io/country and label value of ves-io-jpn

Users are used to an operational model of defining segments of their fleet a-priori and then tagging their sites at the time of provisioning to be included in the fleet; virtual sites ties in perfectly with the users’ existing operational model. When a new site gets provisioned with the appropriate tag, it is automatically included in the virtual site defined earlier without requiring additional manual steps. Furthermore, Volterra discovers pre-provisioned information such as hardware manufacturer or public-cloud type to pre-populate system-tags. Users can optionally choose to use these auto-discovered tags to define their virtual sites.
Fleet Configuration
Fleet configuration capabilities can best be described through the following three examples:
- Configuration of a Network/Security Policy -- Let’s take an example of a customer rolling out a new service that requires the ability for each cluster to communicate with a specific URL, e.g., github.com. Typically users employ white-listing, meaning clusters are allowed to reach specific destinations only. Therefore rolling out this new service would require users to go to each cluster and modify the network policy to add github.com to the whitelist. Furthermore, the customer would like to test this out on a few test sites before rolling it out to all sites. To achieve this intent on Volterra, the customer begins by defining a “test” virtual site on Volterra SaaS console that selects a segment of the fleet. The user then defines a network policy such as the whitelisted list of URLs (github.com in this example) and applies it to the “test” virtual site. Volterra’s distributed control plane sends the network policy to the local control plane on each site selected by the virtual site (as defined above). The local control plane on each site applies the network policy and collects statistics of rules hit per site. Once the customer is satisfied that the service is working as expected, the customer can then apply the network policy to the “prod” virtual site which selects the remaining sites in the fleet. Here is a configuration snippet using Json and using the UI on Volterra’s system.


- Upgrade of Infrastructure Software -- Fleet configuration capability enables a user to upgrade the infrastructure software, e.g., operating system version across the entire fleet (or segment of the fleet). First, the user defines the intent of upgrading the operating system from version 1 to version 2. Next, the user defines a deployment strategy across the fleet, such as a rolling update, blue/green among others. A rolling update means that the operating system of every site in the fleet (or segment of the fleet) is upgraded sequentially. A blue/green deployment strategy means the user wishes to test the upgrade on a set of “blue” sites (e.g., dev sites) and compare the health with “green” sites (e.g., prod sites) that aren’t upgraded. In either case, Volterra’s distributed control plane sends the version 2 software to the local control plane on each site selected by the virtual site and as defined in the deployment strategy The local control plane on each site upgrades the operating system in an A/B fashion meaning, it creates a new partition, deploys version 2 in new partition and enables customer to measure health. If version 2 installation is not successful, the system automatically rolls back to version 1 in the original partition. Here are some screenshots of how the user can perform an upgrade of the infrastructure software using the Volterra SaaS portal. The user can see the current infrastructure software version and the latest software version available for all sites as shown in the next figure. The user can easily upgrade the specific sites or all sites as dictated by the operational model.

- Fleet-wide deployment of Applications -- Volterra provides an object called Virtual Kubernetes (vK8s) that enables users to manage applications across their fleet using Kubernetes APIs. The user deploys their applications using standard Kubernetes methods (i.e., Kubeconfig file and Kubernetes APIs) with deployment manifest file and indicates the segment of sites (or entire fleet) where the application needs to be deployed. Volterra’s Virtual Kubernetes (vK8s) then takes over the responsibility of deploying the application to every site in (or segment of) the fleet. If there are any failures during application deployment such as connectivity or infrastructure failures, Volterra Virtual Kubernetes keeps on retrying deployment following the Kubernetes paradigm of an eventually consistent model. The next screenshot shows an example of the user deploying an application called “kuard” (see Kubernetes-up-and-running-demo-app) on a virtual site called “jpn-all-sites” which is selecting 140 sites of the fleet. To add a new deployment, the user has to simply add a new deployment, by clicking on “Add Deployment” and specifying the deployment location in terms of the virtual site.

If a new site is added to the fleet with the appropriate label, the new sites is automatically added to the virtual site (jpn-all-sites in this example) and the fleet configuration (i.e, Kuard deployment in this example) is automatically applied to the newly added site, reducing the burden on operation teams and eliminating human errors.
Fleet Observability
Virtual sites and Virtual Kubernetes (vK8s) are not only used for configuration but also used to aggregate the health across distributed sites in the fleet. This is a really powerful tool compared to other solutions where users would have to write tooling to get status from every site one by one and aggregate the information. The system automatically aggregates the health status across all sites, in a single pane of glass, reducing operational complexity for the customer’s operations team. Health status collected includes many aspects — like application deployment status, site health, and application health, etc.
Users can get a quick overview of the health of all of their sites on a map as shown in the next screenshot. The color denotes if the health score is greater than 75 (green), between 40–75 (orange) and red if it is less than 40. The health score is an aggregated score comprised of connectivity, reliability, security, and performance (i.e., resource consumption).

Users can also see an aggregated view of the connectivity across all their sites along with the site health. The connectivity health of each link connecting the sites to the Volterra backbone is also shown as visualized in Figure 10. The user can click on poorly performing links based on the health status to reveal detailed statistics on requests and errors and troubleshoot any connectivity issues as shown in Figure 11.


Next, the user can view aggregated information across all sites via CPU and memory load distribution across the sites. This information is useful to IT or site administrators to identify which sites are being heavily utilized and in danger of running out of resources. Site administrators can set up alerts to be notified when the resource consumption exceeds thresholds. In this screenshot, the users can see that half of the sites are consuming greater than 75% of the available memory. They don’t have to click on individual sites nor do they have to write additional tooling to get this information.

Continuous verification capabilities on the fleet object provide the status of POD deployments — how many PODs were deployed or are in-progress or have failed. Once deployed, users can also view the health status of the Pods — whether they are running, waiting for an image, out of memory, etc.

In addition, users can see an aggregated view of the efficacy of the security policy and get hits across all their sites as seen in the next screenshot.

Summary
To learn more about how Volterra’s fleet operations approach was used to manage a fleet of 3000 clusters, please watch Volterra’s presentation at a Kubernetes conference and read this blog by Jakub Pavlik
In the next blog, titled “Time to Effect”, I will explain how Volterra’s distributed control plane and backbone helps propagates and ensures consistency of configuration across globally distributed sites in a very short amount of time. Stay Tuned!
About the Author
Related Blog Posts

A new path to technical excellence for F5 partners
Introducing F5 Partner Foundations, a structured learning curriculum to build F5 partner engineer expertise with a clear pathway to specialization.

Secure-by-design storage for agentic AI: Why runtime visibility plus traffic control matters
Learn how F5 is collaborating with NVIDIA to help protect agentic AI with secure-by-design AI infrastructure, runtime visibility, and traffic control.
Why sub-optimal application delivery architecture costs more than you think
Discover the hidden performance, security, and operational costs of sub‑optimal application delivery—and how modern architectures address them.

Architecting for AI: Secure, scalable, multicloud
Operationalize AI-era multicloud with F5 and Equinix. Explore scalable solutions for secure data flows, uniform policies, and governance across dynamic cloud environments.
AppViewX + F5: Automating and orchestrating app delivery
As an F5 ADSP Select partner, AppViewX works with F5 to deliver a centralized orchestration solution to manage app services across distributed environments.

F5 NGINX Gateway Fabric is a certified solution for Red Hat OpenShift
F5 collaborates with Red Hat to deliver a solution that combines the high-performance app delivery of F5 NGINX with Red Hat OpenShift’s enterprise Kubernetes capabilities.