This tutorial is one of four that put into practice concepts from Microservices March 2022: Kubernetes Networking:
- Reduce Kubernetes Latency with Autoscaling (this post)
- Protect Kubernetes APIs with Rate Limiting
- Protect Kubernetes Apps from SQL Injection
- Improve Uptime and Resilience with a Canary Deployment
Want detailed guidance on using NGINX for even more Kubernetes networking use cases? Download our free eBook, Managing Kubernetes Traffic with NGINX: A Practical Guide.
Your organization built an app in Kubernetes and now it’s getting popular! You went from just a few visitors to hundreds (and sometimes thousands) per day. But there’s a problem…the increased traffic is hitting a bottleneck, causing latency and timeouts for your customers. If you can’t improve the experience, people will stop using the app.
You – the brave Kubernetes engineer – have a solution. You deploy an Ingress controller to route the traffic and set up an autoscaling policy so that the number of Ingress controller pods instantly expands and contracts to match traffic fluctuations. Now, your Ingress controller pods seamlessly handle traffic surges – “Goodbye, latency!” – and scale down to conserve resources when traffic decreases – “Hello, cost savings!” Well done, you.
Lab and Tutorial Overview
This blog accompanies the lab for Unit 1 of Microservices March 2022 – Architecting Kubernetes Clusters for High‑Traffic Websites, demonstrating how to use NGINX Ingress Controller to expose an app and then autoscale the Ingress controller pods in response to high traffic.
To run the tutorial, you need a machine with:
- 2 CPUs or more
- 2 GB of free memory
- 20 GB of free disk space
- Internet connection
- Container or virtual machine manager, such as Docker, Hyperkit, Hyper‑V, KVM, Parallels, Podman, VirtualBox, or VMware Fusion/Workstation
- minikube installed
- Helm installed
- A configuration that allows you to launch a browser window. If that isn’t possible, you need to figure out how to get to the relevant services via a browser.
To get the most out of the lab and tutorial, we recommend that before beginning you:
- Watch the recording of the livestreamed conceptual overview
- Review the background blogs
- Watch the 20-minute video summary of the lab:  
This tutorial uses these technologies:
- NGINX Ingress Controller (based on NGINX Open Source)
- Helm
- KEDA
- Locust
- minikube
- Podinfo
- Prometheus
The instructions for each challenge include the complete text of the YAML files used to configure the apps. You can also copy the text from our GitHub repo. A link to GitHub is provided along with the text of each YAML file.
This tutorial includes four challenges:
- Configure a Simple App on a Kubernetes Cluster
- Use NGINX Ingress Controller to Route Traffic to the App
- Generate and Monitor Traffic
- Autoscale NGINX Ingress Controller
Challenge 1: Configure a Simple App on a Kubernetes Cluster
In this challenge, you create a minikube cluster and install Podinfo as a sample app.
Create a Minikube Cluster
Create a minikube cluster. After a few seconds, a message confirms the deployment was successful.
$ minikube start 🏄 Done! kubectl is now configured to use "minikube" cluster and "default" namespace by default Install the Podinfo App
Podinfo is a “web application made with Go that showcases best practices of running microservices in Kubernetes”. We’re using it as a sample app because of its small footprint.
- Using the text editor of your choice, create a YAML file called 1-deployment.yaml with the following contents (or copy from GitHub). It defines a Deployment with a single replica and a Service.
apiVersion: apps/v1 kind: Deployment
metadata:
  name: podinfo
spec:
  selector:
    matchLabels:
      app: podinfo
  template:
    metadata:
      labels:
        app: podinfo
    spec:
      containers:
      - name: podinfo
        image: stefanprodan/podinfo
        ports:
        - containerPort: 9898
---
apiVersion: v1
kind: Service
metadata:
  name: podinfo
spec:
  ports:
    - port: 80
      targetPort: 9898
      nodePort: 30001
  selector:
    app: podinfo
type: LoadBalancer - Deploy the app:
$ kubectl apply -f 1-deployment.yaml deployment.apps/podinfo created
service/podinfo created- Confirm that the Podinfo pod deployed, as indicated by the value
Runningin theSTATUScolumn.
$ kubectl get podsNAME                       READY   STATUS   RESTARTS   AGE
podinfo-5d76864686-rd2s5 1/1 Running 0 3m38s- Open Podinfo in a browser. The greetings from podinfo page indicates Podinfo is running.
$ minikube service podinfo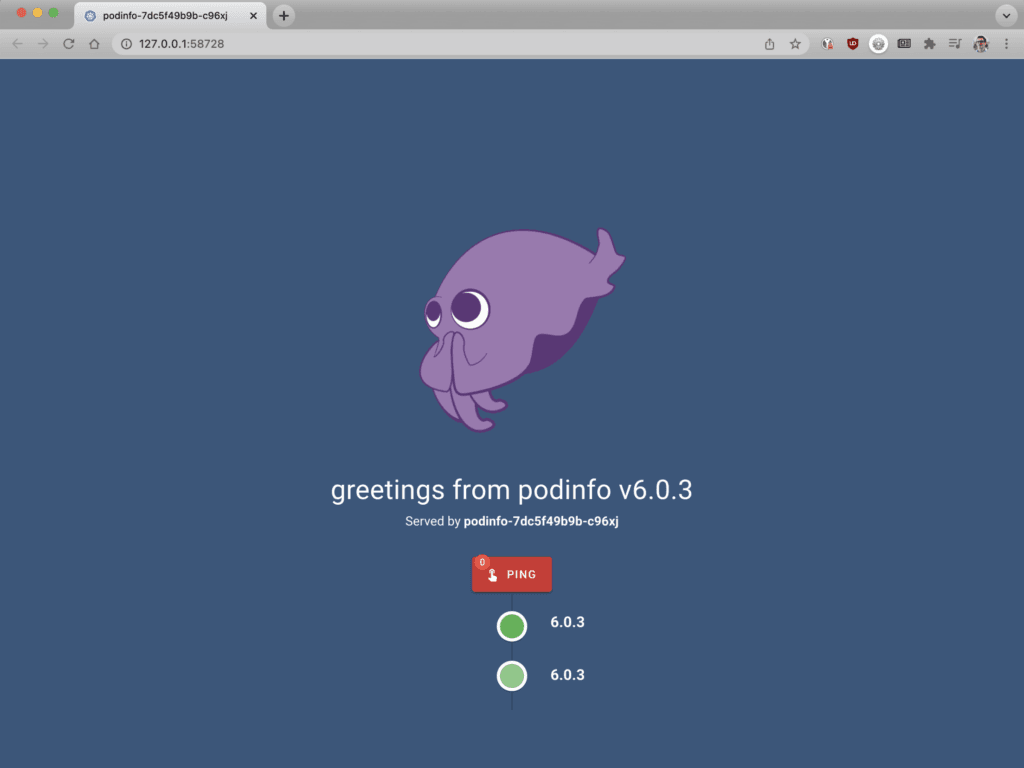
Challenge 2: Use NGINX Ingress Controller to Route Traffic to the App
In this challenge, you deploy NGINX Ingress Controller and configure it to route traffic to the Podinfo app.
Deploy NGINX Ingress Controller
The fastest way to install NGINX Ingress Controller is with Helm.
- Add the NGINX repository to Helm:
$ helm repo add nginx-stable https://helm.nginx.com/stable - Download and install the NGINX Open Source‑based NGINX Ingress Controller, which is maintained by F5 NGINX. The final line of output confirms successful installation.
$ helm install main nginx-stable/nginx-ingress \ --set controller.watchIngressWithoutClass=true \ --set controller.service.type=NodePort \ --set controller.service.httpPort.nodePort=30005
NAME: main
LAST DEPLOYED: Tue Mar 15 09:49:17 2022
NAMESPACE: default
STATUS: deployed
REVISION: 1
TEST SUITE: None
NOTES: The NGINX Ingress Controller has been installed.- Confirm that the NGINX Ingress Controller pod deployed, as indicated by the value
Runningin theSTATUScolumn (for legibility, the output is spread across two lines).
$ kubectl get podsNAME                                   READY   STATUS    ...
main-nginx-ingress-779b74bb8b-mtdkr    1/1     Running   ...
podinfo-5d76864686-fjncl               1/1     Running   ...

       ... RESTARTS   AGE
       ... 0          18s
       ... 0        2m36s
Route Traffic to Your App
- Using the text editor of your choice, create a YAML file called 2-ingress.yaml with the following contents (or copy from GitHub). It defines the Ingress manifest required to route traffic to Podinfo.
apiVersion: networking.k8s.io/v1 kind: Ingress
metadata:
  name: podinfo
spec:
  ingressClassName: nginx
  rules:
    - host: "example.com"
      http:
        paths:
          - backend:
              service:
                name: podinfo
                port:
                  number: 80
            path: /
pathType: Prefix - Deploy the Ingress resource:
$ kubectl apply -f 2-ingress.yaml ingress.networking.k8s.io/podinfo created Challenge 3: Generate and Monitor Traffic
In this challenge, you observe the performance of NGINX Ingress Controller under different traffic loads. As preparatory steps, you list the metrics available from NGINX Ingress Controller, deploy Prometheus, and install Locust. You then use Locust to simulate a traffic surge and track the effect on performance in Prometheus.
As you already discovered, an Ingress controller is a regular Kubernetes pod that bundles a reverse proxy (in our case, NGINX) with some code for integration with Kubernetes. If your app receives a lot of traffic, you probably need to scale up the number of NGINX Ingress Controller pod replicas to avoid the latency caused when NGINX Ingress Controller is overwhelmed.
List the Available Metrics
To know when and how much to scale, you need accurate information about NGINX Ingress Controller performance. In this tutorial, the NGINX metric used to determine when to scale is the number of active connections (nginx_connections_active). Here you verify that your NGINX Ingress Controller tracks that metric.
NGINX Ingress Controller exposes multiple metrics: 8 metrics with the NGINX Open Source‑based model we’re suing in this tutorial and 80+ metrics with the NGINX Plus-based model.
- Obtain the IP address of the NGINX Ingress Controller pod so that you can query its list of metrics. The address appears in the
IPfield and here it is172.17.0.4. (For legibility, theRESTARTSandAGEcolumns are omitted and the output is spread across two lines.)
$ kubectl get pods -o wide NAME                                  READY   STATUS    ...
main-nginx-ingress-779b74bb8b-6hdwx   1/1     Running   ...
podinfo-5d76864686-nl8ws              1/1     Running   ...

    ... IP           NODE       NOMINATED NODE  READINESS GATES
    ... 172.17.0.4   minikube   <none>          <none>
... 172.17.0.3 minikube <none> <none>- Create a temporary BusyBox pod with a shell on a host inside the Kubernetes cluster:
$ kubectl run -ti --rm=true busybox --image=busyboxIf you don't see a command prompt, try pressing enter.
/ # - List the metrics generated by your NGINX Ingress Controller, and verify it includes
nginx_connections_active. For<IP_address>substitute the value from Step 1.
/# wget -qO- <IP_address>:9113/metrics- Exit the shell to return to the Kubernetes server.
/# exit Deploy Prometheus
Now that you know your NGINX Ingress Controller tracks the nginx_connections_active metric, you need a tool to collect (“scrape”) the metrics – this tutorial uses Prometheus.
As for NGINX Ingress Controller, Helm is the fastest way to install Prometheus.
- Add the Prometheus repository to Helm:
$ helm repo add prometheus-community https://prometheus-community.github.io/helm-charts- Download and install Prometheus:
$ helm install prometheus prometheus-community/prometheus \ --set server.service.type=NodePort --set server.service.nodePort=30010- Verify installation, which usually takes up to 60 seconds to complete. In the following sample output, the verification command ran just a few seconds after the
helminstallcommand and so we see installation in progress, withContainerCreatingreported in theSTATUSfield for some Prometheus pods. Installation is complete when all pods have statusRunning. (The output is spread across two lines for legibility.)
$ kubectl get podsNAME                                           READY  ...
main-nginx-ingress-779b74bb8b-mtdkr            1/1    ...
podinfo-5d76864686-fjncl                       1/1    ...
prometheus-alertmanager-d6d94cf4b-85ww5        0/2    ...
prometheus-kube-state-metrics-7cd8f95cb-86hhs  0/1    ...
prometheus-node-exporter-gqxfz                 1/1    ...
prometheus-pushgateway-56745d8d8b-qnwcb        0/1    ...
prometheus-server-b78c9449f-kwhzp              0/2    ...

      ... STATUS             RESTARTS  AGE
      ... Running            0         3m23s
      ... Running            0         5m41s
      ... ContainerCreating  0         7s
      ... Running            0         7s
      ... Running            0         7s
      ... ContainerCreating  0         7s
... ContainerCreating 0 7s- Open Prometheus. In a minikube environment, run the following command, which opens the Prometheus dashboard in your default browser.
$ minikube service prometheus-server- A page like the following confirms that the server is working.
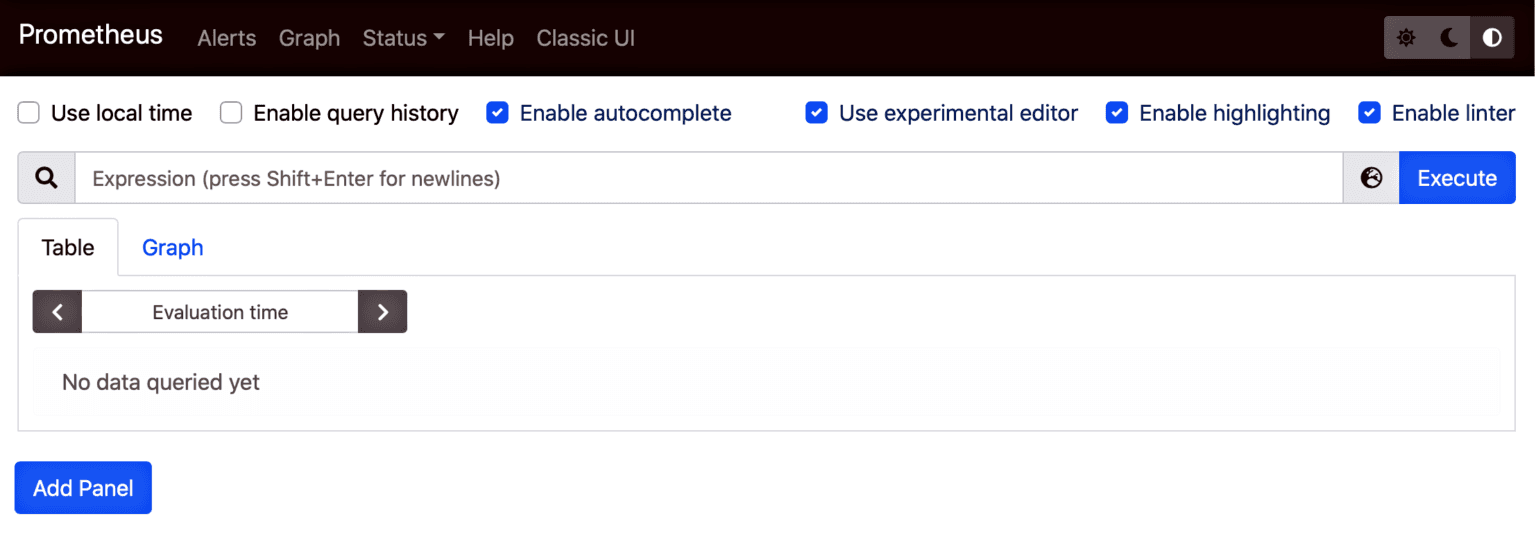
- Type
nginx_ingress_nginx_connections_activein the search bar to see the current value of the active connections metric. You see one active connection, which makes sense because you’ve deployed one NGINX Ingress Controller pod.
Install Locust
In the next section, you’ll use Locust, an open source load‑testing tool, to simulate a traffic surge so you can watch NGINX Ingress Controller’s performance in Prometheus. Here you deploy Locust.
- Using the text editor of your choice, create a YAML file called 3-locust.yaml with the following contents (or copy from GitHub). The Deployment and Service objects define the Locust pod. The ConfigMap object defines a script called locustfile.py which generates requests to be sent to the pod, complete with the correct headers.
apiVersion: v1
kind: ConfigMap
metadata:
  name: locust-script
data:
  locustfile.py: |-
    from locust import HttpUser, task, between

    class QuickstartUser(HttpUser):
        wait_time = between(0.7, 1.3)

        @task
        def hello_world(self):
            self.client.get("/", headers={"Host": "example.com"})
---
apiVersion: apps/v1
kind: Deployment
metadata:
  name: locust
spec:
  selector:
    matchLabels:
      app: locust
  template:
    metadata:
      labels:
        app: locust
    spec:
      containers:
        - name: locust
          image: locustio/locust
          ports:
            - containerPort: 8089
          volumeMounts:
            - mountPath: /home/locust
              name: locust-script
      volumes:
        - name: locust-script
          configMap:
            name: locust-script
---
apiVersion: v1
kind: Service
metadata:
  name: locust
spec:
  ports:
    - port: 8089
      targetPort: 8089
      nodePort: 30015
  selector:
    app: locust
type: LoadBalancer - Deploy Locust:
$ kubectl apply -f 3-locust.yaml configmap/locust-script created
deployment.apps/locust created
service/locust created
Simulate a Traffic Surge and Observe the Effect on Performance
- Open Locust in a browser.
$ minikube service locust-
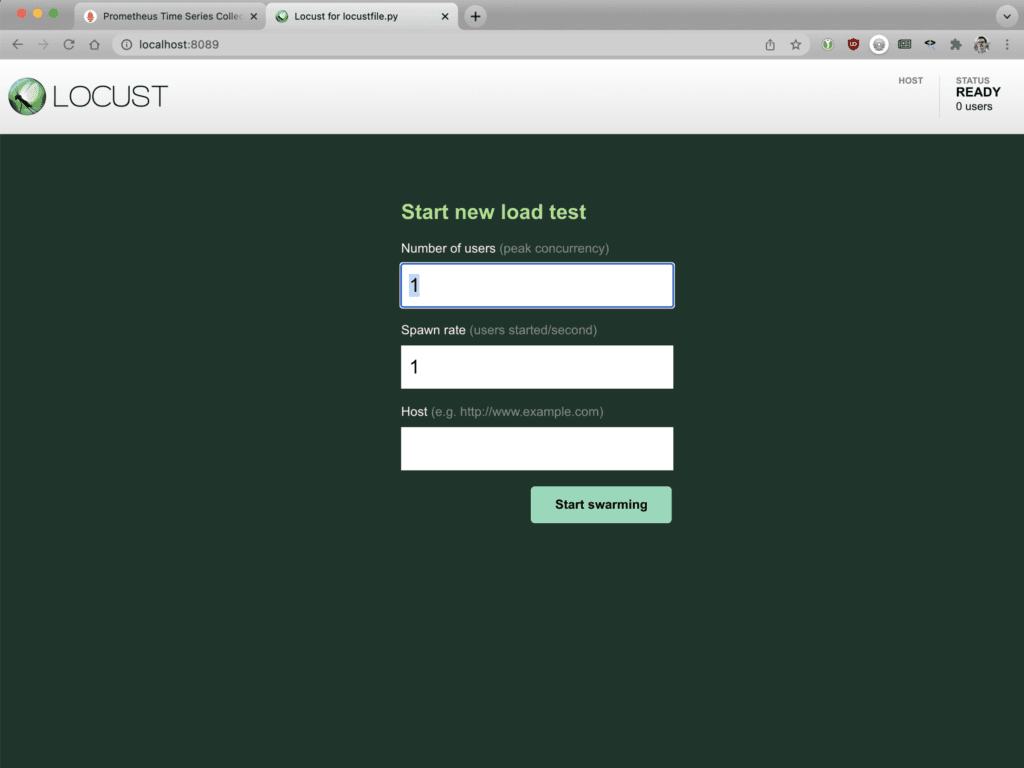
- Enter the following values in the fields:
- Number of users – 1000
- Spawn rate – 10
- Host – http://main-nginx-ingress
- Click the Start swarming button to send traffic to the Podinfo app.
- Return to the Prometheus dashboard to see how NGINX Ingress Controller responds. You may have to perform a new query for
nginx_ingress_nginx_connections_activeto see any change. As shown in the following screen output, the single NGINX Ingress Controller pod struggles to process the increased traffic without latency as a large number of connections are established. The Prometheus graph reveals that about 100 active connections per NGINX Ingress Controller pod is the tipping point for a spike in latency. You can use this information to determine when you need to scale up the number of NGINX Ingress Controller pods to avoid increased latency.
Challenge 4: Autoscale NGINX Ingress Controller
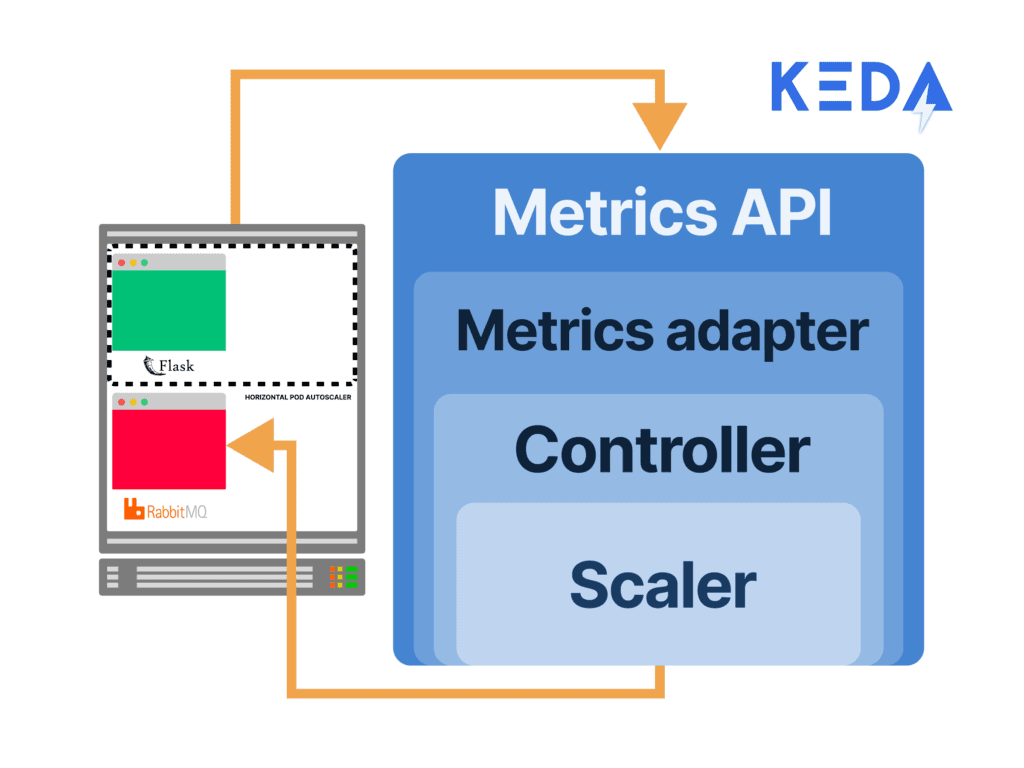
In the final challenge, you build a configuration that autoscales resources as the traffic volume increases. The tutorial uses KEDA for autoscaling, so first you install it and create a policy that defines when and how scaling occurs. As in Challenge 3, you then use Locust to simulate a traffic surge and Prometheus to observe NGINX Ingress Controller performance when autoscaling is enabled.
Install KEDA
KEDA, a Kubernetes event-driven autoscaler, integrates a metrics server (the component that stores and transforms metrics for Kubernetes) and can consume metrics directly from Prometheus (as well as other tools). It creates a Horizontal Pod Autoscaler (HPA) with those metrics, bridges the metrics collected by Prometheus, and feeds them to Kubernetes.
As with NGINX Ingress Controller and Prometheus, the tutorial uses Helm to install KEDA.
- Add KEDA to the Helm repository:
$ helm repo add kedacore https://kedacore.github.io/charts
"kedacore" has been added to your repositories - Install KEDA:
$ helm install keda kedacore/keda NAME: keda
NAMESPACE: default
STATUS: deployed
REVISION: 1
TEST SUITE: None- Verify that KEDA is running as two pods. (For legibility, some values in the
NAMEcolumn are shortened. Also, theRESTARTScolumn is omitted; the value is0for all pods.)
$ kubectl get pods NAME                                    READY  STATUS     AGE
keda-operator-8644dcdb79-492x5 1/1 Running 59s keda-operator-metrics-apiserver-66d... 1/1 Running 59s
locust-77c699c94d-dvb5n                 1/1    Running  8m59s
main-nginx-ingress-779b74bb8b-v7ggw     1/1    Running    48m
podinfo-5d76864686-c98rb                1/1    Running    50m
prometheus-alertmanager-d6d94cf4b-8...  2/2    Running    37m
prometheus-kube-state-metrics-7cd8f...  1/1    Running    37m
prometheus-node-exporter-j4qf4          1/1    Running    37m
prometheus-pushgateway-56745d8d8b-9n4nl 1/1    Running    37m
prometheus-server-b78c9449f-6ktn9       2/2    Running    37m
Create an Autoscaling Policy
Now use the KEDA ScaledObject custom resource definition (CRD) to define the parameters that dictate how NGINX Ingress Controller scales. The following configuration:
- Triggers autoscaling based on the value of the
nginx_connections_activemetric collected by Prometheus - Deploys a new pod when existing pods hit 100 active connections each
- Autoscales NGINX Ingress Controller pods from a single pod up to 20 pods
Perform the following steps:
- Using the text editor of your choice, create a YAML file called 4-scaled-object.yaml with the following contents (or copy from GitHub). It defines a KEDA
ScaledObject.
apiVersion: keda.sh/v1alpha1 kind: ScaledObject
metadata:
 name: nginx-scale
spec:
 scaleTargetRef:
   kind: Deployment
   name: main-nginx-ingress
minReplicaCount: 1
maxReplicaCount: 20
cooldownPeriod: 30
pollingInterval: 1
triggers:
- type: prometheus
  metadata:
    serverAddress: http://prometheus-server
    metricName: nginx_connections_active_keda
    query: |
      sum(avg_over_time(nginx_ingress_nginx_connections_active{app="main-nginx-ingress"}[1m]))
threshold: "100" - Deploy the
ScaledObject:
$ kubectl apply -f 4-scaled-object.yaml scaledobject.keda.sh/nginx-scale created Simulate a Traffic Surge and Observe the Effect of Autoscaling on Performance
To really test the effectiveness of autoscaling, you double the number of connections compared to Challenge 3.
- Return to the Locust server in your browser. Enter the following values in the fields and click the Start swarming button:
- Number of users – 2000
- Spawn rate – 10
- Host – http://main-nginx-ingress
- Return to the Prometheus and Locust dashboards. The pink box under the Prometheus graph depicts the number of NGINX Ingress Controller pods scaling up and down.
- Switch back to your terminal and manually inspect the KEDA HPA. The
REPLICASfield in the output shows the current number of deployed pod replicas. (The output is spread across two lines for legibility.)
$ kubectl get hpa
NAME                  REFERENCE                      ...
keda-hpa-nginx-scale  Deployment/main-nginx-ingress  ...

    ... TARGETS           MINPODS   MAXPODS   REPLICAS   AGE
    ... 101500m/100 (avg) 1         20        10         2m45s
Next Steps
There’s a potential limitation when you base autoscaling only on the number of active connections. If (even with scaling) NGINX Ingress Controller gets so busy that it has to drop connections, the autoscaler sees fewer active connections, interprets that as meaning requests have declined, and reduces the number of replicas. That can make performance worse, but leveraging a combination of metrics can ensure it doesn’t happen. For example, nginxplus_connections_dropped (available with the NGINX Ingress Controller based on NGINX Plus) keeps track of those dropped client connections.
To try NGINX Ingress Controller with NGINX Plus and NGINX App Protect, start your free 30-day trial today or contact us to discuss your use cases.
To try NGINX Ingress Controller with NGINX Open Source, you can obtain the release source code, or download a prebuilt container from DockerHub.
About the Author
Related Blog Posts

Automating Certificate Management in a Kubernetes Environment
Simplify cert management by providing unique, automatically renewed and updated certificates to your endpoints.

Secure Your API Gateway with NGINX App Protect WAF
As monoliths move to microservices, applications are developed faster than ever. Speed is necessary to stay competitive and APIs sit at the front of these rapid modernization efforts. But the popularity of APIs for application modernization has significant implications for app security.
How Do I Choose? API Gateway vs. Ingress Controller vs. Service Mesh
When you need an API gateway in Kubernetes, how do you choose among API gateway vs. Ingress controller vs. service mesh? We guide you through the decision, with sample scenarios for north-south and east-west API traffic, plus use cases where an API gateway is the right tool.
Deploying NGINX as an API Gateway, Part 2: Protecting Backend Services
In the second post in our API gateway series, Liam shows you how to batten down the hatches on your API services. You can use rate limiting, access restrictions, request size limits, and request body validation to frustrate illegitimate or overly burdensome requests.
New Joomla Exploit CVE-2015-8562
Read about the new zero day exploit in Joomla and see the NGINX configuration for how to apply a fix in NGINX or NGINX Plus.
Why Do I See “Welcome to nginx!” on My Favorite Website?
The ‘Welcome to NGINX!’ page is presented when NGINX web server software is installed on a computer but has not finished configuring