At Volterra, the SRE team’s job is to operate a global SaaS-based edge platform. We have to solve various challenges in managing a large number of application clusters in various states (i.e. online, offline, admin-down, etc.) and we do this by leveraging the Kubernetes ecosystem and tooling with a declarative pull-based model using GitOps.
In this blog, we will describe:
Using GitOps to effectively manage and monitor a large fleet of Infrastructure (physical or cloud hosts) and K8s clusters
- The tooling that we built to solve problems around CI/CD
- Object orchestration and configuration management
- Observability across the fleet of Infra and K8s clusters
We will dive deeper with lessons learned at scale (3000 edge sites), which was also covered in my recent talk at Cloud Native Rejekts in San Diego.
TL;DR (Summary)
- We could not find a simple and out-of-the-box solution that could be used to deploy and operate thousands (and potentially millions) of application and infrastructure clusters across public cloud, on-premises or nomadic locations
- This solution needed to provide the lifecycle management for hosts (physical or cloud), Kubernetes control plane, application workloads, and the on-going configuration of various services. In addition, the solution needed to meet our SRE design requirements — declarative definition, immutable lifecycle, gitops, and no direct access to clusters.
- After evaluating various open source projects — e.g. Kubespray+Ansible (for Kubernetes deployment), or Helm/Spinnaker (for workload management) — we came to a conclusion that none of these solutions could meet our above requirements without adding a significant software bloat at each edge site. As a result, we decided to build our own Golang-based software daemon that performed lifecycle management of the host (physical or cloud), Kubernetes control plane and application workloads.
- As we scaled the system to 3000 clusters and beyond (within a single tenant), all our assumptions about our public cloud providers, scalability of our software daemons, operations tooling, and observability infrastructure broke down systematically. Each of these required re-architecture of some of our software components to overcome these challenges.
Definition of the Edge
- Customer Edge (CE) — These are customer locations in the cloud (like AWS, Azure, GCP, or private cloud), on-premises locations (like factory floor, oil/gas facility, etc), or nomadic location (like automotive, robotics, etc). CE is managed by the Volterra SRE team but can also be deployed by customers on-demand in locations of their choice.
- Regional Edges (RE) — These are Volterra points of presence (PoP) in colocation facilities in major metro markets that are interconnected with our own highly meshed private backbone. These regional edge sites are also used to securely interconnect customer edge (CE) locations and/or expose application services to the public Internet. RE sites are fully managed and owned by the Volterra infrastructure operations (Infra SRE) team.
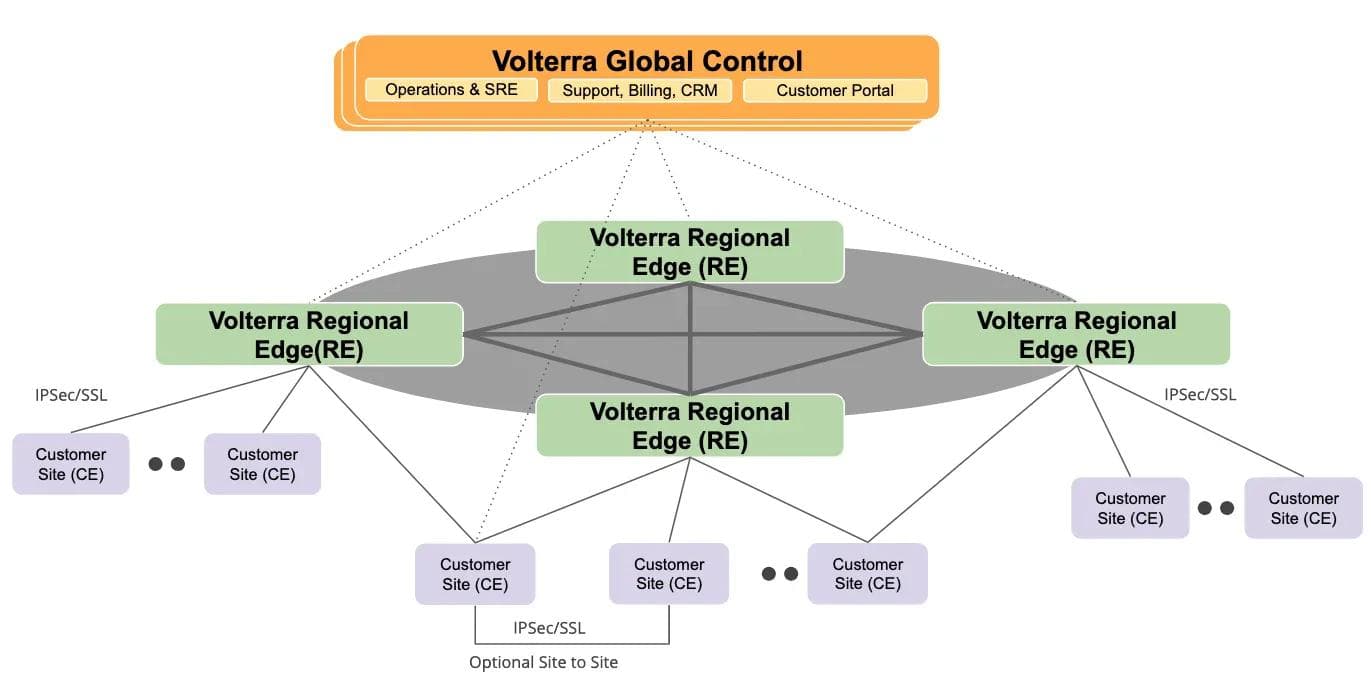
The architecture diagram (Figure 1) above shows logical connectivity between our REs and CEs, where each CE establishes redundant (IPSec or SSL VPN) connections to the closest RE.
Requirements for Edge Management
When we started designing our platform about 2 years back, our product team had asked us to solve for the following challenges:
- System Scalability — our customers needed us to support thousands (eventually millions) of customer edge sites and this is very different from running a handful of Kubernetes clusters in cloud regions. For example, one of our customers has ~17k convenience stores and another operates >20k charging stations. This scale meant that we had to build our tooling very differently than handling a few clusters.
- Zero-Touch Deployment — since anybody should be able to deploy a new site without much understanding of the hardware, software, or Kubernetes. The edge site needed to behave like a blackbox that turns on, calls home and gets online.
- Fleet Management — simplified management of thousands of sites and workloads without the need to treat them individually. Any site may go offline or become unavailable at the time of a requested change or upgrade. As a result, sites have to fetch updates when they come online.
- Fault Tolerance — edge sites have to be operational even after failure of any component. Everything must be managed remotely and provide features like factory reset or site rebuild in case of failure. We had to assume that there is no physical access at the site.
Design Principles (No Kubectl! No Ansible! No Packages!)
Considering our requirements and challenges of operating a highly distributed system, we decided to set several principles what we needed our SRE team to follow in order to reduce downstream issues:
- Declarative Definition — the entire system has to be described declaratively, as this allows us to create an easy abstraction model and perform validation against the model.
- Immutable Lifecycle Management — in the past, we were working on large private cloud installations using mutable LCM tools such as Ansible, Salt or Puppet. This time, we wanted to keep the base OS very simple and try to ship everything as a container without package management or the need for configuration management tools.
- GitOps — provides a standard operating model for managing Kubernetes clusters. It also helps us to get approvals, audits and workflows of changes out of the box without building an extra workflow management system. Therefore we decided that everything must go over git.
- No kubectl — This was one of the most important principles as nobody is allowed direct access to application clusters. As a result, we removed the ability to run kubectl inside of individual edge clusters or use scripts running from central places including centralized CD systems. Centralized CD systems with a push method are good for tens of clusters, but certainly not suitable for thousands without a guarantee of 100% network availability.
- No hype technology (or tools) — our past experience has shown that many of the popular open source tools do not live up to their hype. While we evaluated several community projects for delivering infrastructure, K8s and application workloads (such as Helm, Spinnaker and Terraform), we ended up using only Terraform for virtual infrastructure part and developed custom code that we will describe in the following parts of this blog.
Site Lifecycle Management
As part of the edge site lifecycle management, we had to solve how to provision the host OS, do basic configurations (e.g. user management, certificate authority, hugepages, etc.), bring up K8s, deploy workloads, and manage ongoing configuration changes.
One of the options we considered but eventually rejected was to use KubeSpray+Ansible (to manage OS and deploy K8s) and Helm/Spinnaker (to deploy workloads). The reason we rejected this was that it would have required us to manage 2–3 open source tools and then do significant modifications to meet our requirements, which continued to grow as we added more features like auto-scaling of edge clusters, support for secure TPM modules, differential upgrades, etc.
Since our goal was to keep it simple and minimize the number of components running directly in the OS (outside of Kubernetes), we decided to write a lightweight Golang daemon called Volterra Platform Manager (VPM). This is the only systemd Docker container in the OS and it acts as a Swiss Army knife that performs many functions:
Host Lifecycle
VPM is responsible for managing the lifecycle of the host operating system including installation, upgrades, patches, configuration, etc. There are many aspects that need to be configured (e.g. hugepages allocation, /etc/hosts, etc)
- OS upgrade management — unfortunately, the edge is not only about Kubernetes and we have to manage version of the kernel and OS in general. Our edge is based on CoreOS (or CentOS depending on customer need) with an active and passive partition. Updates are always downloaded to the passive partition when an upgrade is scheduled. A reboot is the last step of the update, where the active and passive partitions are swapped. The only sensitive part is reboot strategy (for a multi-node cluster) because all nodes cannot be rebooted at the same time. We implemented our own etcd reboot lock (in VPM) where nodes in a cluster are rebooted one by one.
- User access management to OS — our need is to restrict users and their access to ssh and the console remotely. VPM does all those operations such as ssh CA rotations.
- Since we developed our own L3-L7 datapath, that requires us to configure 2M or 1G hugepages in the host OS based on the type of hardware (or cloud VM)
Kubernetes Lifecycle
Management to provide lifecycle for Kubernetes manifest. Instead of using Helm, we decided to use the K8s client-go library, which we integrated into VPM and used several features from this library:
- Optimistic vs Pessimistic Deployment — this feature allows us to categorize applications where we need to wait until they are healthy. It simply watches for annotation in K8s manifest ves.io/deploy: optimistic.Optimistic = create resource and don’t wait for status. It is very similar to kubernetes apply command where you do not know if the actual pods starts successfully. Pessimistic = wait for state of Kubernetes resource. For instance, deployment waits until all pods are ready. This is similar to new kubectl wait command.
- Pre-Update actions like pre-pull — sometimes it is not possible to rely on K8s rolling updates, especially when the network data plane is shipped. The reason is that the old pod is destroyed and then the new pod is being pulled. However in the case of data plane, you lose network connectivity. Therefore the new container image cannot be pulled and the pod will never start. Metadata annotation ves.io/prepull with a list of images triggers pulling action before K8s manifest is applied.
- Retries and Rollbacks in case of applied failures. This is a very common situation when a K8s API server has some intermittent outages.
Ongoing Configuration
In addition to configurations related to K8s manifests, we also need to configure various Volterra services via their APIs. One example is IPsec/SSL VPN configs — VPM receives configuration from our global control plane and programs them in individual nodes.
Factory Reset
This feature allows us to reset a box remotely into original state and do the whole installation and registration process again. It is a very critical feature for recovering a site needing console/physical access.
Even though K8s lifecycle management may appear to be a big discussion topic for many folks, for our team it is probably just 40–50% of the overall work volume.
Zero-Touch Provisioning
Zero-touch provisioning of the edge site in any location (cloud, on-premises or nomadic edge) is critical functionality, as we cannot expect to have access to individual sites nor do we want to staff that many Kubernetes experts to install and manage individual sites. It just does not scale to thousands.
The following diagram (Figure 2) shows how VPM is involved in the process of registering a new site:
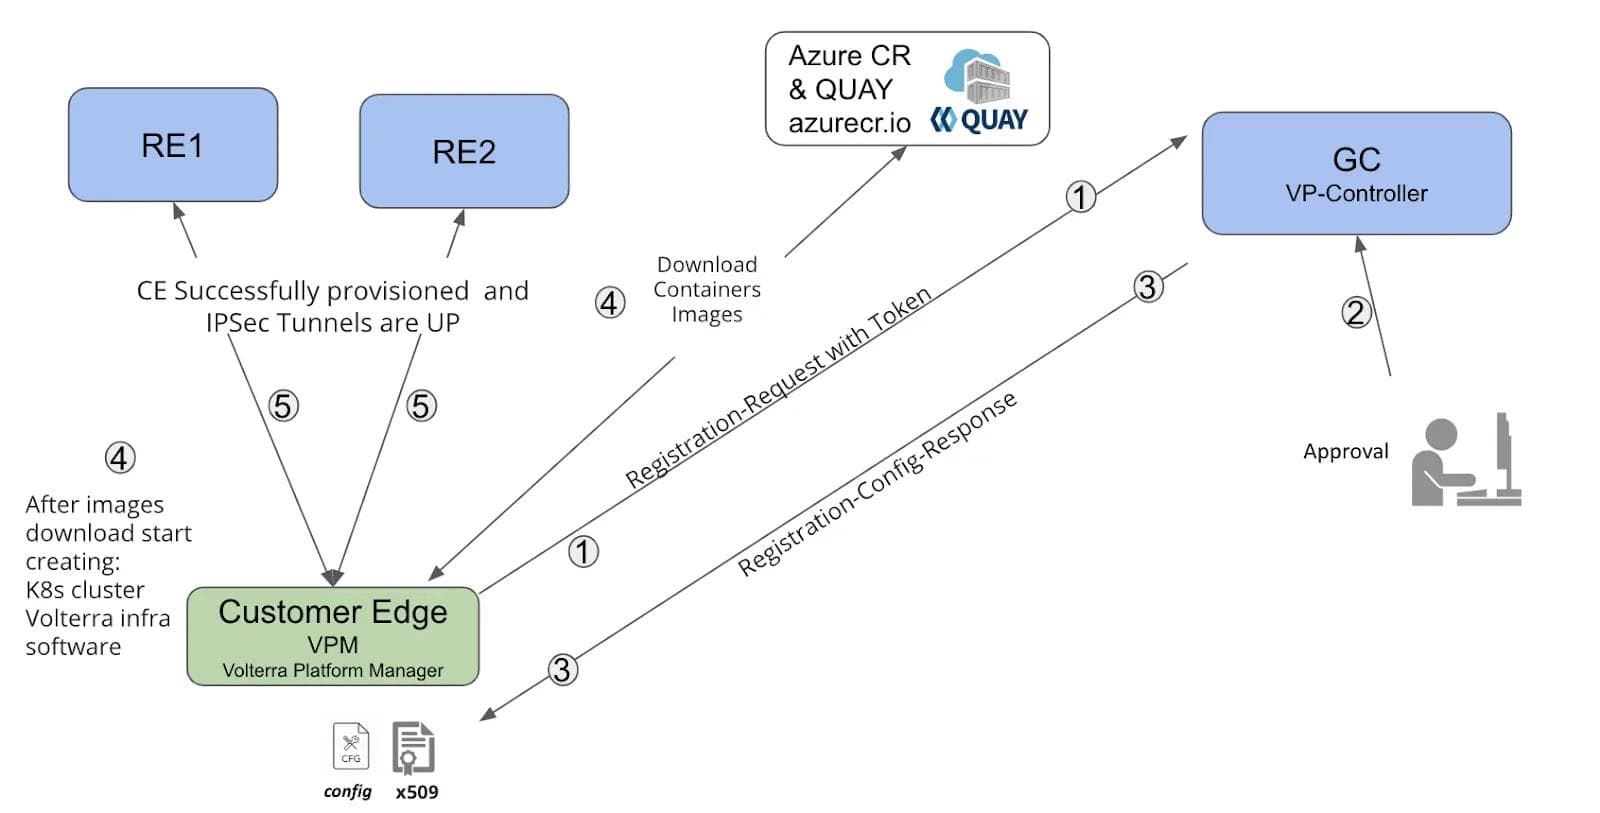
- Once powered on, the VPM running on the CE (represented by the green box), will present a registration token to our global control plane (GC) to create new registration. The registration token provided as part of cloud-init of the cloud VM, and may be a key entered by a human during the boot process, or programmed in the TPM for edge hardware.
- GC receives the request with token, which allows it to create new registration under a tenant (encoded in the token). The customer operator can immediately see new edge site on the map and approve it with the ability to enter name and other configuration parameters.
- VP-Controller within GC generates configuration (e.g. decide who is K8s master, minion, etc.) and certificates for etcd, K8s and VPM.
- VPM starts bootstrapping the site including downloading docker images, configuring hugepages, installing K8s cluster, and start Volterra control plane services.
- VPM configures redundant tunnels (IPSec/SSL VPN) to the nearest two Regional Edge sites that will be used for data traffic and interconnectivity across sites and public network.
As you can see, the whole process is fully automated and the user does not need to know anything about detailed configuration or execute any manual steps. It takes around 5 minutes to get the whole device into online state and ready to serve customer apps and requests.
Infrastructure Software Upgrades
Upgrade is one of the most complicated things that we had to solve. Let’s define what is being upgraded in edge sites:
- Operating System Upgrades — this covers kernel and all system packages. Anyone who has operated a standard Linux OS distribution is aware of the pain to upgrade across minor versions (e.g. going from Ubuntu 16.04.x to 16.04.y) and the much bigger pain to upgrade across major versions (e.g. going from Ubuntu 16.04 to 18.04). In the case of thousands of sites, upgrades have to be deterministic and cannot behave differently across sites. Therefore we picked CoreOS and CentOS Atomic with the ability to follow A/B upgrades with 2 partitions and read-only file system on paths. This gives us the ability to immediately revert by switching boot order partitions and keep the OS consistent without maintaining OS packages. However, we can no longer upgrade individual components in the system, for example openssh server by just installing a new package. Changes to individual components have to be released as a new immutable OS version.
- Software Upgrades — this covers VPM, etcd, Kubernetes and Volterra control services running as K8s workloads. As I mentioned already, our goal is to have everything inside of K8s running as systemd container. Luckily, we were able to convert everything as K8s workloads except 3 services: VPM, etcd and kubelet.
There are two known methods that could be used to deliver updates to edge sites:
- Push-based — a push method is usually done by a centralized CD (continuous delivery) tool such as Spinnaker, Jenkins or Ansible-based CM. In this case, a central tool would need to have access to the target site or cluster and it has to be available to perform the action.
- Pull-based — a pull-based method fetches upgrade information independently without any centralized delivery mechanism. It scales better and also removes the need to store credentials of all sites in a single place.
Our goal for upgrade was to maximize simplicity and reliability — similar to standard cell phone upgrades. In addition, there are other considerations that the upgrade strategy had to satisfy — the upgrade context may only be with the operator of the site, or the device may be offline or unavailable for some time because of connectivity issues, etc. These requirements could be more easily satisfied with the pull method and thus we decided to adopt it to meet our needs.
GitOps
In addition, we chose GitOps as it made it easier to provide a standard operating model for managing Kubernetes clusters, workflows and audit changes to our SRE team.
In order to solve the scaling problems of thousands of sites, we came up with the architecture for SRE shown in Figure 3:
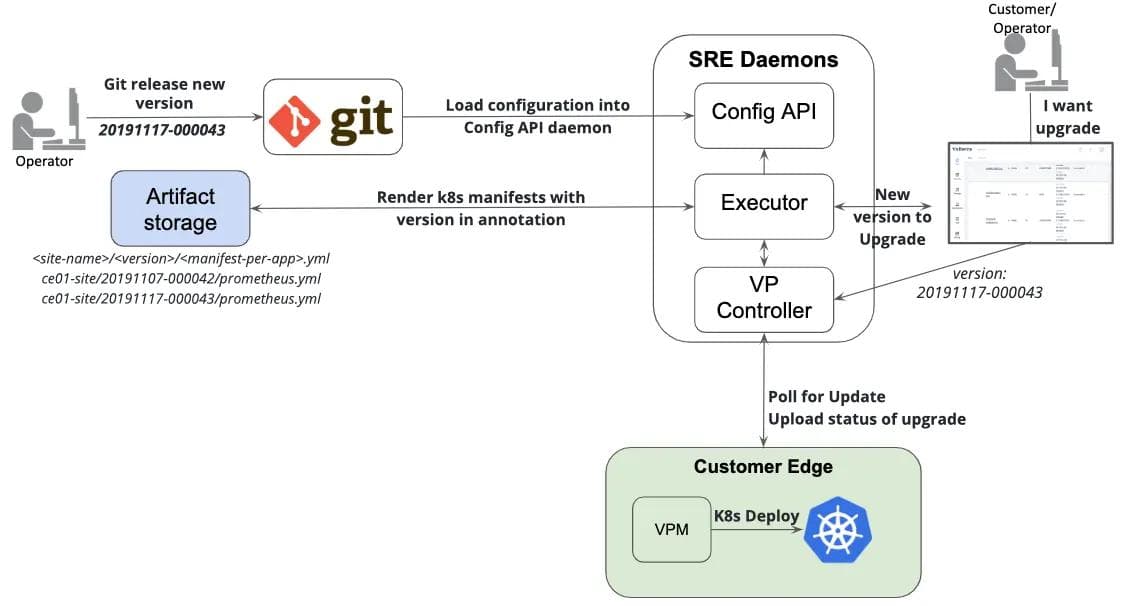
First, I want to emphasize that we don’t use Git for just storing state or manifests. The reason is that our platform has to not only handle K8s manifests but also ongoing API configurations, K8s versions, etc. In our case, K8s manifests are about 60% of the entire declarative configuration. For this reason we had to come up with our own DSL abstraction on top of it, which is stored in git. Also, since git does not provide an API or any parameter merging capabilities, we had to develop additional Golang daemons for SRE: Config API, Executor and VP Controller.
Let’s go through the workflow of releasing a new software version at the customer edge using our SaaS platform:
- Operator decides to release a new version and opens a merge request (MR) against git model
- Once this MR is approved and merged, CI triggers the action to load a git model configuration into our SRE Config-API daemon. This daemon has several APIs for parameters merging, internal DNS configuration, etc.
- Config-API is watched by the Executor daemon; immediately after git changes are loaded, it starts rendering final K8s manifests with version in annotation. These manifests are then uploaded to Artifact storage (S3 like) under path ce01-site//.yml
- Once the new version is rendered and uploaded to artifact storage, Executor produces a new status with an available version to the customer API; this is very similar to the new version available in cell phones
- The customer (or operator) may schedule an update for his site to the latest version and this information is passed to VP-Controller. VP-Controller is the daemon responsible for site management, including provisioning, decommissioning or migration to a different location. This was already partially explained in zero-touch provisioning and is responsible for updating edge sites via the mTLS API
- The last step in the diagram happens on the edge site — once the IPSec/SSL VPN connection is up, VP-Controller notifies the VPM at the edge to download updates with new version; however, if connectivity is broken or having intermittent issues, VPM polls for an update every 5 minutes
- New K8s manifests and configurations are fetched and deployed into K8s. Using the feature of pessimistic deployment described in the previous section, VPM waits until all pods are ready
- As the last step, VPM sends status of the upgrade back to VP Controller and it gets pushed as status to the customer API.
You can watch a demo of entire workflow here:
Lessons Learned from 3000 Edge Sites Testing
In previous sections, we described how our tooling is used to deploy and manage the lifecycle of edge sites. To validate our design, we decided to build a large-scale environment with three thousand customer edge sites (as shown in Figure 4)
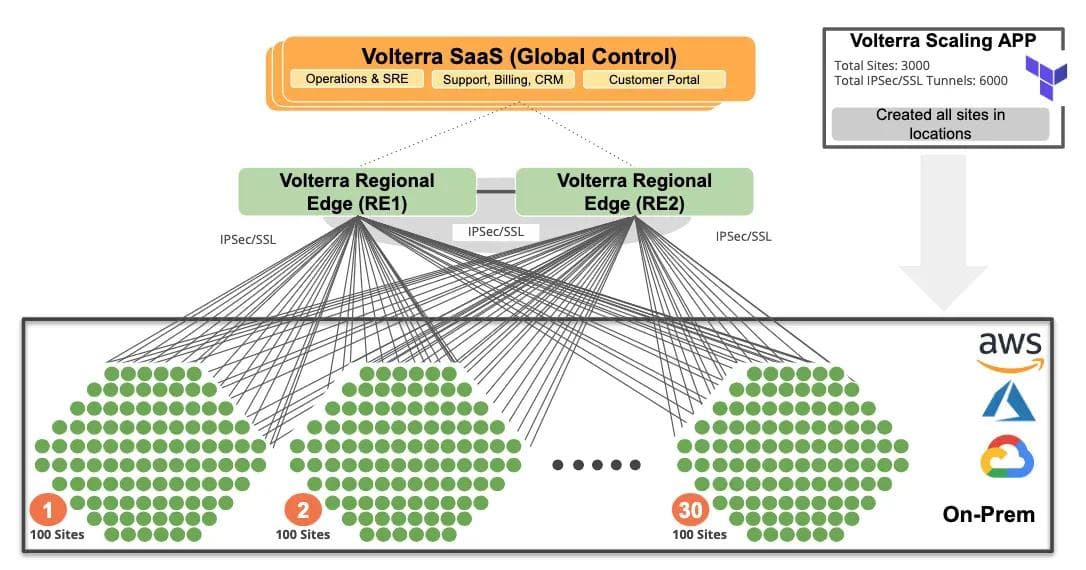
We used Terraform to provision 3000 VMs across AWS, Azure, Google and our own on-premises bare metal cloud to simulate scale. All those VMs were independent CEs (customer edge sites) that established redundant tunnels to our regional edge sites (aka PoPs).
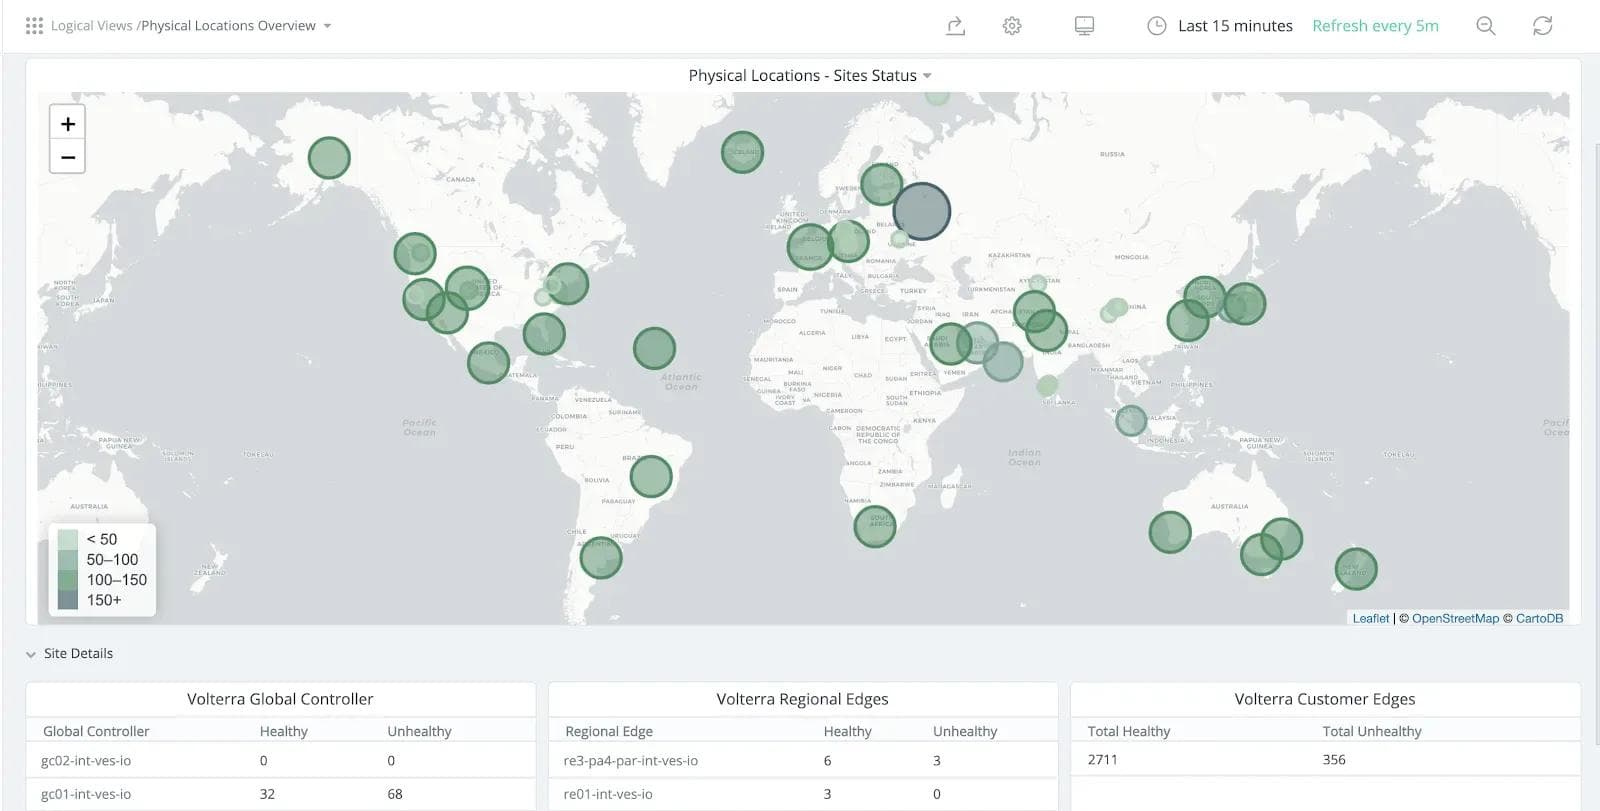
The screenshot below is from our SRE dashboard and shows edge numbers in locations represented by size of circle. At the time of taking screenshot we had around 2711 healthy and 356 unhealthy edge sites.
Key Findings: Operations
As part of scaling, we did find a few issues on the configuration and operational side that required us to make modifications to our software daemons. In addition, we ran into many issues with a cloud provider that led to opening of multiple support tickets — for example, API response latency, inability to obtain more than 500 VMs in a single region, etc.
- Optimize VP-Controller — initially, we processed registration serially and each took about two minutes as we needed to mint various certificates for etcd, kubernetes and VPM. We optimized this time by pregenerated keys using higher entropy, and parallelization with a larger number of workers. This allowed us to process registration for 100 sites in less than 20 seconds. We were able to serve all 3000 edge sites by consuming just around one vCPU and 2GB of RAM on our VP-Controller.
- Optimize Docker Image Delivery — when we started scaling, we realized that the amount of data transmitted for edge sites is huge. Each edge downloaded around 600MB (multiplied by 3000), thus there was 1.8TB of total data transmitted. Also, we were rebuilding edge sites several times during our testing so that number would actually be much larger. As a result, we had to optimize the size of our Docker images and build cloud and iso-images with pre-pulled Docker images to reduce download. While we are still using a public cloud container registry service, we are actively working on a design to distribute our container registry through REs (PoPs) and perform incremental (binary-diff) upgrades.
- Optimize Global Control Database Operations — all our Volterra control services are based on the Golang service framework that uses ETCD as a database. Every site is represented as a configuration object. Each site configuration object has a few StatusObjects such as software-upgrade, hardware-info or ipsec-status. These StatusObjects are produced by various platform components and they are all referenced in a global config API. When we reached 3000 sites, we had to do certain optimizations in our object schema. For example, limit the number of StatusObjects types accepted by the global config API or we decided to move them to a dedicated ETCD instance to reduce the risk of overloading the config object DB. This allows us to provide better availability and response time for configuration database and also allows us to rebuild the status DB in case of failures. Another example of optimization was to stop doing unnecessary site object list operations across all tenants or introduce secondary indexes to reduce the load on the database.
Key Findings: Observability
Observability across a distributed system posed a much greater set of challenges as we scaled the system.
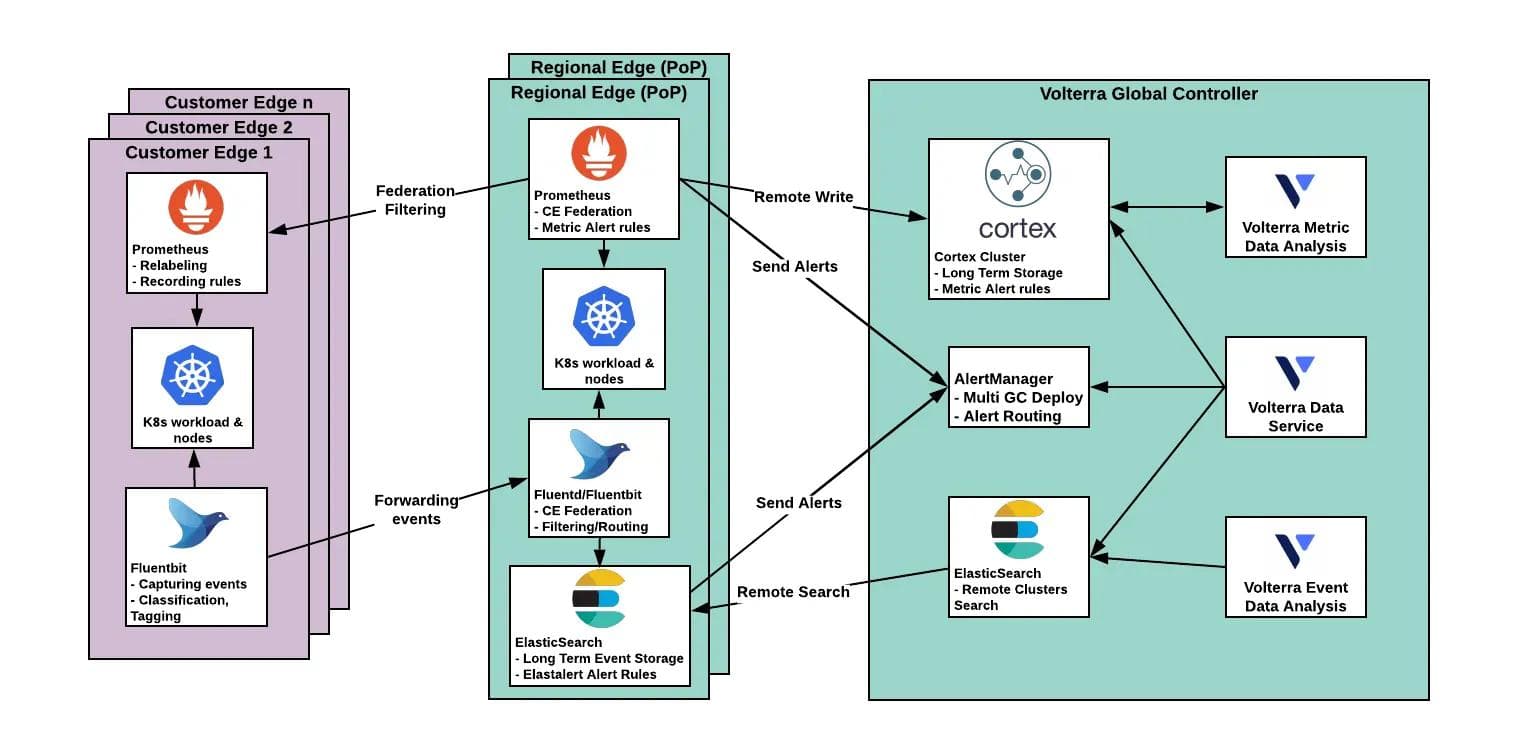
Initially, for metrics we started with Prometheus federation — central Prometheus in global control federating Promethei in regional edges (REs), which scrapes its service metrics and federates metrics from their connected CEs. The top-level Prometheus evaluated alerts and served as a metric source for further analysis. We hit the limits of this approach fast (around 1000 CEs) and tried to minimize the impact of the growing number of CEs. We started to generate pre-calculated series for histograms and other high-cardinality metrics. This saved us for a day or two and then we had to employ whitelists for metrics. At the end, we were able to reduce the number of time series metrics from around 60,000 to 2000 for each CE site.
Eventually, after continued scaling beyond 3000 CE sites and running for many days in production, it was clear that this was not scalable and we had to rethink our monitoring infra. We decided to drop top-level Prometheus (in global control) and split the Prometheus in each RE into two separate instances. One being responsible for scraping local service metrics and the second for federating CE metrics. Both generate alerts and push metrics to central storage in Cortex. Cortex is used for analytical and visualization source and not part of the core monitoring alerting flow. We tested several centralized metrics solutions, namely Thanos and M3db, and found Cortex to best suited our needs.
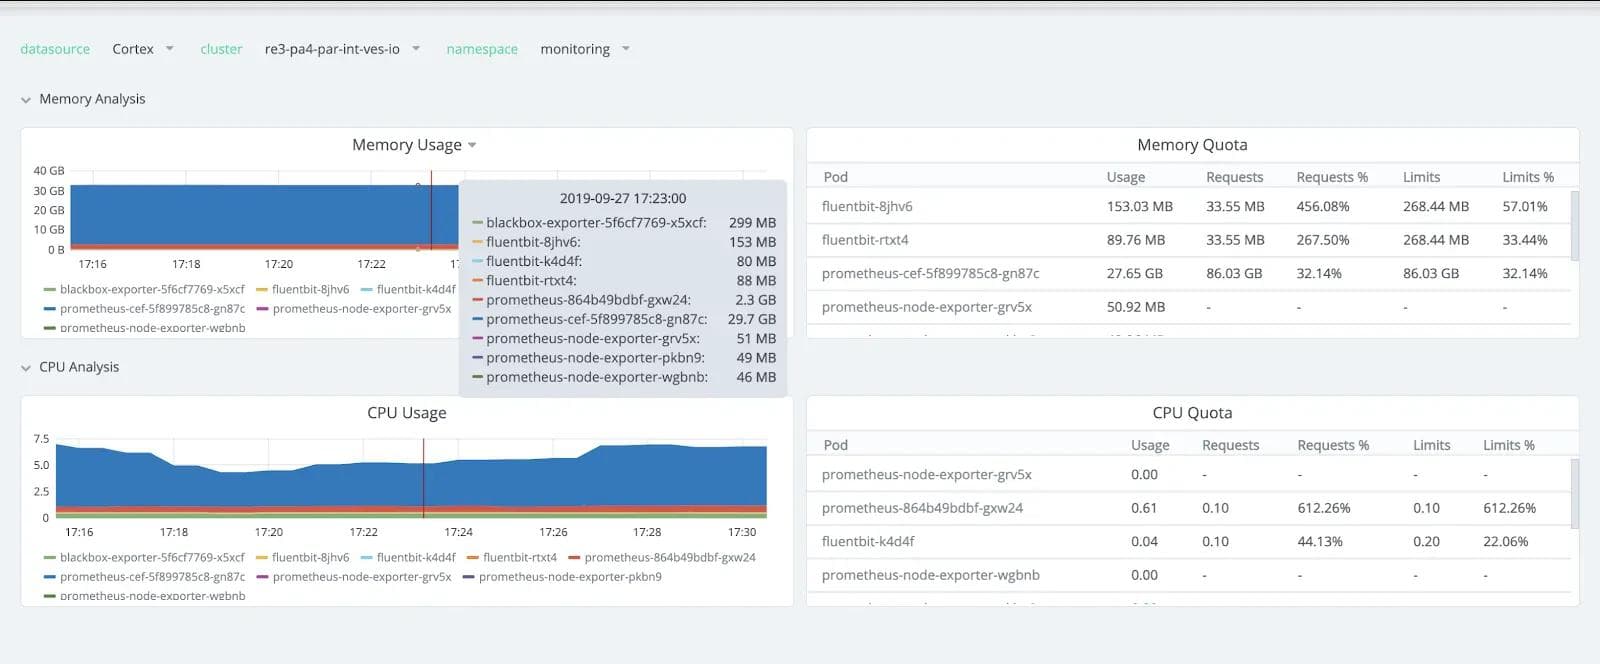
The following screenshot (Figure 7) shows the memory consumption from scraping prometheus-cef at time of 3000 endpoints. The interesting thing is the 29.7GB RAM consumed, which is not actually so much given the scale of the system. It can be further optimized by splitting scraping into multiple of them or moving the remote write to Cortex directly into the edge itself.
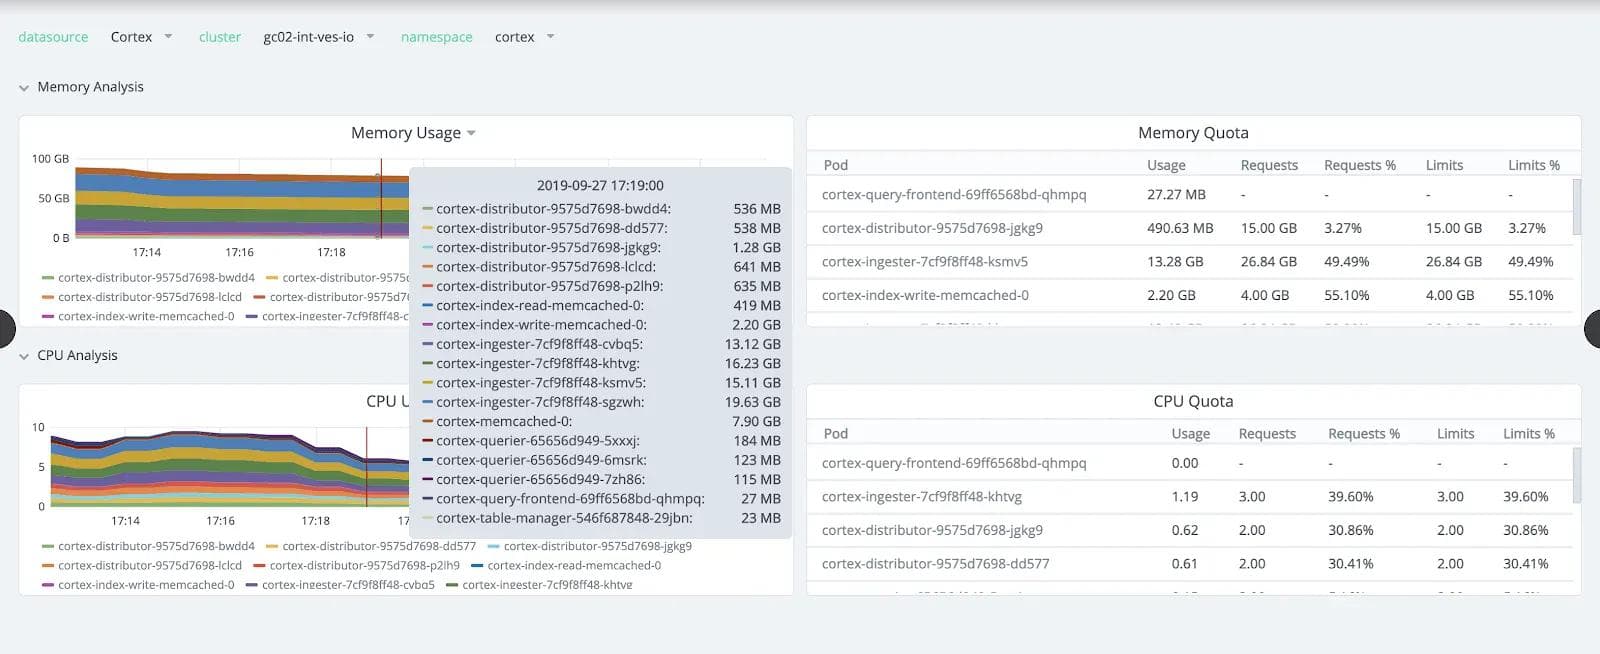
The next screenshot (Figure 8) shows how much memory and CPU resources we needed for Cortex ingestors (max 19GB RAM) and distributors at this scale. The biggest advantage of Cortex is horizontal scaling, which allows us to add more replicas compared to Prometheus where scaling has to happen vertically.
For logging infrastructure in CEs and REs, we use Fluentbit services per node which collects the service and system log events and forwards it to Fluentd in the connected RE. Fluentd forwards the data to the ElasticSearch present in the RE. The data from ElasticSearch is evaluated by Elastalert and rules are set to create Alertmanager alerts. We are using our custom integration from Elastalert to Alertmananger to produce alerts with the same labels as Prometheus produces.
The key points in our monitoring journey:
- Using new Prometheus federation filters to drop unused metrics, labels- Initially we had around 50,000 time series per CE with an average of 15 labels - We optimized it to 2000 per CE on average Simple while-lists for metric names and black-lists for label names
- Move from global Prometheus federation to Cortex cluster- Centralized Prometheus scraped all REs’ and CEs’ Prometheus - At 1000 CE, it became unsustainable to manage the quantity of metrics - Currently we have Prometheus at each RE (federating to connected CEs’ Promethei) with RW to Cortex
- Elasticsearch clusters and logs- Decentralized logging architecture - Fluentbit as collector on each node forwards logs into Fluentd (aggregator) in RE - ElasticSearch is deployed in every RE using remote cluster search to query logs from a single Kibana instance
Summary
I hope this blog gives you an insight into what all has to be considered to manage thousands of edge sites and clusters deployed across the globe. Even though we have been able to meet and validate most of our initial design requirements, lots of improvements are still in front of us…
About the Author
Related Blog Posts
Why sub-optimal application delivery architecture costs more than you think
Discover the hidden performance, security, and operational costs of sub‑optimal application delivery—and how modern architectures address them.

Keyfactor + F5: Integrating digital trust in the F5 platform
By integrating digital trust solutions into F5 ADSP, Keyfactor and F5 redefine how organizations protect and deliver digital services at enterprise scale.

Architecting for AI: Secure, scalable, multicloud
Operationalize AI-era multicloud with F5 and Equinix. Explore scalable solutions for secure data flows, uniform policies, and governance across dynamic cloud environments.
Nutanix and F5 expand successful partnership to Kubernetes
Nutanix and F5 have a shared vision of simplifying IT management. The two are joining forces for a Kubernetes service that is backed by F5 NGINX Plus.

AppViewX + F5: Automating and orchestrating app delivery
As an F5 ADSP Select partner, AppViewX works with F5 to deliver a centralized orchestration solution to manage app services across distributed environments.
F5 NGINX Gateway Fabric is a certified solution for Red Hat OpenShift
F5 collaborates with Red Hat to deliver a solution that combines the high-performance app delivery of F5 NGINX with Red Hat OpenShift’s enterprise Kubernetes capabilities.