
[Editor – This post has been updated with information about the revised reports introduced in rtapi version 0.2.0.]
APIs lie at the very heart of modern applications and evolving digital architectures, with API calls representing 83% of all web traffic, according to the Akamai State of the Internet Security Report. In today’s landscape, where it’s so easy for consumers to switch to a digital competitor, it is of the utmost importance for them to have a positive experience with your site or app. Speed is highly valued, and is ultimately driven by responsive, healthy, and adaptable APIs. If you get this right – your API is faster than your competitor’s – developers will choose you.
According to the IDC report APIs — The Determining Agents Between Success or Failure of Digital Business, over 90% of organizations expect a latency of less than 50 milliseconds (ms), while almost 60% expect latency of 20ms or less. (Latency is defined as the amount of time it takes for your API infrastructure to respond to an API call – from the moment a request arrives at the API gateway to when the first byte of a response is returned to the client.)
We’ve used this data, together with some end-to-end analysis of the API lifecycle, to define a real‑time API as one with latency of 30ms or less. Further, the 30ms latency threshold must be maintained all the way up to the 99th percentile of processed requests (meaning that on average only 1 request in 100 takes longer than 30ms). For details, see our blog about performance benchmarking of API management solutions.
It’s a major challenge for most businesses to process API calls in as near to real time as possible, especially when using architecturally complex API gateways as the entry points to their API endpoints. So, how do your APIs measure up? Are they already fast enough to be considered real time, or do they need to improve? Does your product feel a bit sluggish, but you can’t quite place why that is? Maybe you don’t know for sure what your API latency looks like?
Enter rtapi – a real‑time API latency benchmarking tool created by NGINX that tests the responsiveness of your API gateways and endpoints, and generates reports that you can easily distribute and socialize among your peers. Two report formats are available: a PDF with a summary graph and an ASCII-formatted table of detailed metrics.
Running rtapi
- Download the
rtapibinary from GitHub, using one of two methods:- If you have Golang installed, run this command:
$ go get github.com/nginxinc/rtapi- If you don’t have Golang installed, navigate to github.com/nginxinc/rtapi/releases, download the binary for your platform, and make it executable.
- Specify one or more API endpoints (targets) that you wish to query, in JSON or YAML format as in the following examples. We recommend saving the JSON or YAML in a file called endpoints.json or endpoints.yml. (For JSON you can also include the data on the
rtapicommand line in the next step, as the parameter to the--dataflag.) The only required parameters for each endpoint aretarget.urlandtarget.method. If you don’t specifytarget.bodyandtarget.header, they remain empty. If you don’t specify a parameter in thequery_parametersobject,rtapiuses the (default) value for it shown in the following examples. Sample JSON Input
[
  {
    "target": {
      "url": "https://www.example.com",
      "method": "POST",
      "body": "{\"id\":\"0\"}",
      "header": {
        "Content-Type": [
          "application/json"
        ]
      }
    },
    "query_parameters": {
      "threads": 2,
      "max_threads": 2,
      "connections": 10,
      "duration": "10s",
      "request_rate": 500
    }
  }
]- Sample YAML Input
- target:    url: https://example.com/api/id
    method: POST
    body: '{"id":"0"}'
    header:
      Content-Type:
        - application/json
  query_parameters:
    threads: 2
    max_threads: 2
    connections: 12
    duration: 10s
request_rate: 500- Run the following command, where
--filenames the file containing the JSON/YAML‑formatted list of API endpoints and--outputnames the PDF report to be generated byrtapi. (As noted in Step 2, you can provide JSON input on the command line: for--fileendpoints.jsonsubstitute--datafollowed by the JSON string.)
$ rtapi --file endpoints.json --output report.pdf- To display the ASCII‑formatted table of metrics in the terminal, include the
--printflag, instead of (or in addition to) the--outputflag.
$ rtapi --file endpoints.json --printInterpreting the PDF Report
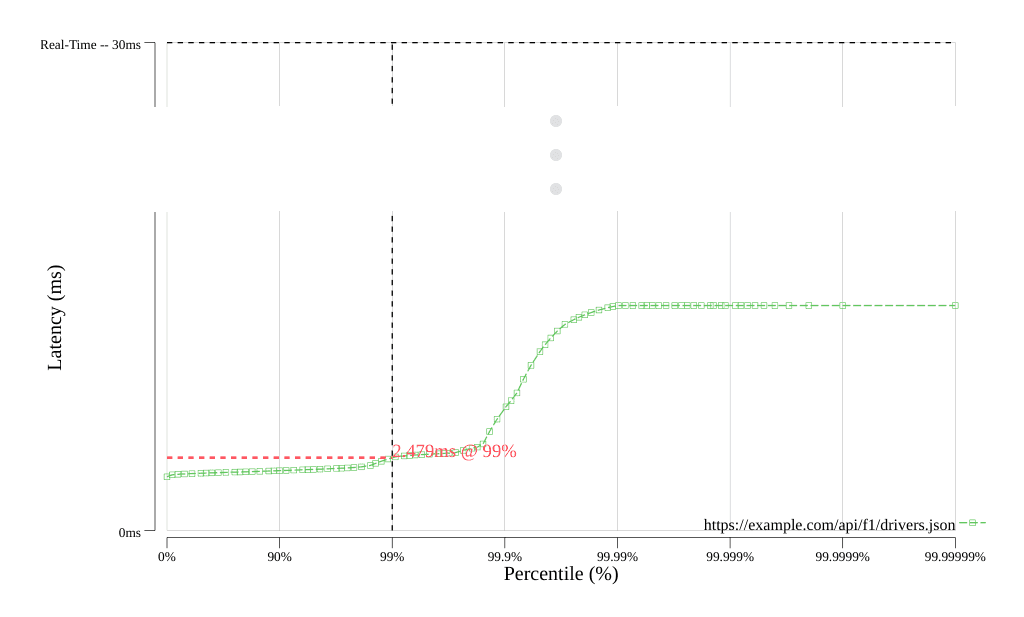
The PDF report generated by rtapi contains an HDR histogram of response latency like the following (from an NGINX Plus API gateway configured using the NGINX Controller API Management Module). The Y axis shows latency in milliseconds, and the X axis shows the proportion of calls processed in less than a given latency, expressed as a percentile. (In the following example, we’ve compressed the Y axis for the sake of space.)
To highlight the results for your API, the dashed lines that are parallel to the axes intersect to show your API’s measured latency at the 99th percentile (99% on the graph). For your API to be considered real time, the latency at the intersection needs to be less than 30ms.
How Can NGINX Help?
Is your API’s latency below 30ms?
If you’re like many companies we talk with, chances are it’s not. With many API gateway and API management solutions, latency of 100ms is common, and even 500ms is not that unusual.
We can help you improve your API performance – NGINX and NGINX Plus are the fastest API gateway in the industry, and together with NGINX Controller can help you route, authenticate, secure, shape, and cache API calls in less than 30ms. Learn more, talk to an NGINX expert, and discover how NGINX can help you on your journey towards real‑time APIs at nginx.com/real-time-api.
About the Author

Related Blog Posts

Automating Certificate Management in a Kubernetes Environment
Simplify cert management by providing unique, automatically renewed and updated certificates to your endpoints.

Secure Your API Gateway with NGINX App Protect WAF
As monoliths move to microservices, applications are developed faster than ever. Speed is necessary to stay competitive and APIs sit at the front of these rapid modernization efforts. But the popularity of APIs for application modernization has significant implications for app security.
How Do I Choose? API Gateway vs. Ingress Controller vs. Service Mesh
When you need an API gateway in Kubernetes, how do you choose among API gateway vs. Ingress controller vs. service mesh? We guide you through the decision, with sample scenarios for north-south and east-west API traffic, plus use cases where an API gateway is the right tool.
Deploying NGINX as an API Gateway, Part 2: Protecting Backend Services
In the second post in our API gateway series, Liam shows you how to batten down the hatches on your API services. You can use rate limiting, access restrictions, request size limits, and request body validation to frustrate illegitimate or overly burdensome requests.
New Joomla Exploit CVE-2015-8562
Read about the new zero day exploit in Joomla and see the NGINX configuration for how to apply a fix in NGINX or NGINX Plus.
Why Do I See “Welcome to nginx!” on My Favorite Website?
The ‘Welcome to NGINX!’ page is presented when NGINX web server software is installed on a computer but has not finished configuring