For all its benefits, a microservices architecture also introduces new complexities. One is the challenge of tracking requests as they are processed, with data flowing among all the microservices that make up the application. A new methodology called distributed (request) tracing has been invented for this purpose, and OpenTracing is a specification and standard set of APIs intended to guide design and implementation of distributed tracing tools.
In NGINX Plus Release 18 (R18), we added the NGINX OpenTracing module to our dynamic modules repository (it has been available as a third‑party module on GitHub for a couple of years now). A big advantage of the NGINX OpenTracing module is that by instrumenting NGINX and NGINX Plus for distributed tracing you get tracing data for every proxied application, without having to instrument the applications individually.
In this blog we show how to enable distributed tracing of requests for NGINX or NGINX Plus (for brevity we’ll just refer to NGINX Plus from now on). We provide instructions for two distributed tracing services (tracers, in OpenTracing terminology), Jaeger and Zipkin. (For a list of other tracers, see the OpenTracing documentation.) To illustrate the kind of information provided by tracers, we compare request processing before and after NGINX Plus caching is enabled.
A tracer has two basic components:
- An agent which collects tracing data from applications running on the host where it is running. In our case, the “application” is NGINX Plus and the agent is implemented as a plug‑in.
- A server (also called the collector) which accepts tracing data from one or more agents and displays it in a central UI. You can run the server on the NGINX Plus host or another host, as you choose.
Installing a Tracer Server
The first step is to install and configure the server for the tracer of your choice. We’re providing instructions for Jaeger and Zipkin; adapt them as necessary for other tracers.
Installing the Jaeger Server
We recommend the following method for installing the Jaeger server. You can also download Docker images at the URL specified in Step 1.
- Navigate to the Jaeger download page and download the Linux binary (at the time of writing, jaeger-1.12.0-linux-amd64.tar).
- Move the binary to /usr/bin/jaeger (creating the directory first if necessary), and run it.
$ mkdir /usr/bin/jaeger$ mv jaeger-1.12.0-linux-amd64.tar /usr/bin/jaeger $ cd /usr/bin/jaeger $ tar xvzf jaeger-1.12.0-linux-amd64.tar.gz $ sudo rm -rf jaeger-1.12.0-linux-amd64.tar.gz $ cd jaeger-1.12.0-linux-amd64 $ ./jaeger-all-in-one - Verify that you can access the Jaeger UI in your browser, at http://Jaeger-server-IP-address:16686/ (16686 is the default port for the Jaeger server).
Installing the Zipkin Server
- Download and run a Docker image of Zipkin (we’re using port 9411, the default).
$ docker run -d -p 9411:9411 openzipkin/zipkin - Verify that you can access the Zipkin UI in your browser, at http://Zipkin-server-IP-address:9411/.
Installing and Configuring a Tracer Plug‑In
Run these commands on the NGINX Plus host to install the plug‑in for either Jaeger or Zipkin.
Installing the Jaeger Plug‑In
- Install the Jaeger plug‑in. The following
wgetcommand is for x86‑64 Linux systems:Instructions for building the plug‑in from source are available on GitHub.$ cd /usr/local/lib $ wget https://github.com/jaegertracing/jaeger-client-cpp/releases/download/v0.4.2/libjaegertracing_plugin.linux_amd64.so -O /usr/local/lib/libjaegertracing_plugin.so - Create a JSON‑formatted configuration file for the plug‑in, named /etc/jaeger/jaeger-config.json, with the following contents. We’re using the default port for the Jaeger server, 6831:For details about the
{ "service_name": "nginx", "sampler": { "type": "const", "param": 1 }, "reporter": { "localAgentHostPort": "Jaeger-server-IP-address:6831" } }samplerobject, see the Jaeger documentation.
Installing the Zipkin Plug‑In
- Install the Zipkin plug‑in. The following
wgetcommand is for x86‑64 Linux systems:$ cd /usr/local/lib$ wget -O - https://github.com/rnburn/zipkin-cpp-opentracing/releases/download/v0.5.2/linux-amd64-libzipkin_opentracing_plugin.so.gz | gunzip -c > /usr/local/lib/libzipkin_opentracing_plugin.so - Create a JSON‑formatted configuration file for the plug‑in, named /etc/zipkin/zipkin-config.json, with the following contents. We’re using the default port for the Zipkin server, 9411:For details about the configuration objects, see the JSON schema on GitHub.
{  "service_name": "nginx",
  "collector_host": "Zipkin-server-IP-address",
  "collector_port": 9411
}
Configuring NGINX Plus
Perform these instructions on the NGINX Plus host.
- Install the NGINX OpenTracing module according to the instructions in the NGINX Plus Admin Guide.
- Add the following
load_moduledirective in the main (top‑level) context of the main NGINX Plus configuration file (/etc/nginx/nginx.conf):load_module modules/ngx_http_opentracing_module.so; - Add the following directives to the NGINX Plus configuration. If you use the conventional configuration scheme, put the directives in a new file called /etc/nginx/conf.d/opentracing.conf. Also verify that the following
includedirective appears in thehttpcontext in /etc/nginx/nginx.conf:http { include /etc/nginx/conf.d/*.conf; }# Load a vendor tracer#opentracing_load_tracer /usr/local/libjaegertracing_plugin.so # /etc/jaeger/jaeger-config.json; #opentracing_load_tracer /usr/local/lib/libzipkin_opentracing_plugin.so # /etc/zipkin/zipkin-config.json; # Enable tracing for all requests opentracing on; # Set additional tags that capture the value of NGINX Plus variables opentracing_tag bytes_sent $bytes_sent; opentracing_tag http_user_agent $http_user_agent; opentracing_tag request_time $request_time; opentracing_tag upstream_addr $upstream_addr; opentracing_tag upstream_bytes_received $upstream_bytes_received; opentracing_tag upstream_cache_status $upstream_cache_status; opentracing_tag upstream_connect_time $upstream_connect_time; opentracing_tag upstream_header_time $upstream_header_time; opentracing_tag upstream_queue_time $upstream_queue_time; opentracing_tag upstream_response_time $upstream_response_time; #uncomment for debugging # log_format opentracing '$remote_addr - $remote_user [$time_local] "$request" ' # '$status $body_bytes_sent "$http_referer" ' # '"$http_user_agent" "$http_x_forwarded_for" ' # '"$host" sn="$server_name" ' # 'rt=$request_time ' # 'ua="$upstream_addr" us="$upstream_status" ' # 'ut="$upstream_response_time" ul="$upstream_response_length" ' # 'cs=$upstream_cache_status'; #access_log /var/log/nginx/opentracing.log opentracing; server { listen 9001; location / { # The operation name used for OpenTracing Spans defaults to the name of the # 'location' block, but uncomment this directive to customize it. #opentracing_operation_name $uri; # Propagate the active Span context upstream, so that the trace can be # continued by the backend. opentracing_propagate_context; # Make sure that your Ruby app is listening on port 4567 proxy_pass http://127.0.0.1:4567; } }- The
opentracing_load_tracerdirective enables the tracer plug‑in. Uncomment the directive for either Jaeger or Zipkin as appropriate. - The
opentracing_tagdirectives make NGINX Plus variables available as OpenTracing tags that appear in the tracer UI. - To debug OpenTracing activity, uncomment the
log_formatandaccess_logdirectives. If you want to replace the default NGINX access log and log format with this one, uncomment the directives, then change the three instances of “opentracing” to “main“. Another option is to log OpenTracing activity just for the traffic on port 9001 – uncomment thelog_formatandaccess_logdirectives and move them into theserverblock. - The
serverblock sets up OpenTracing for the sample Ruby application described in the next section.
- The
- Validate and reload the NGINX Plus configuration:
$ nginx -t$ nginx -s reload
Setting Up the Sample Ruby App
With the tracer and NGINX Plus configuration in place, we create a sample Ruby app that shows what OpenTracing data looks like. The app lets us measure how much NGINX Plus caching improves response time. When the app receives a request like the following HTTP GET request for /, it waits a random amount of time (between 2 and 5 seconds) before responding.
$ curl http://NGINX-Plus-IP-address:9001/- Install and set up both Ruby and Sinatra (an open source software web application library and domain‑specific language written in Ruby as an alternative to other Ruby web application frameworks).
- Create a file called app.rb with the following contents:
#!/usr/bin/ruby require 'sinatra' get '/*' do out = "<h1>Ruby simple app</h1>" + "\n" #Sleep a random time between 2s and 5s sleeping_time = rand(4)+2 sleep(sleeping_time) puts "slept for: #{sleeping_time}s." out += '<p>some output text</p>' + "\n" return out end - Make app.rb executable and run it:
$ chmod +x app.rb$ ./app.rb
Tracing Response Times Without Caching
We use Jaeger and Zipkin to show how long it takes NGINX Plus to respond to a request when caching is not enabled. For each tracer, we send five requests.
Output from Jaeger Without Caching
Here are the five requests displayed in the Jaeger UI (most recent first):
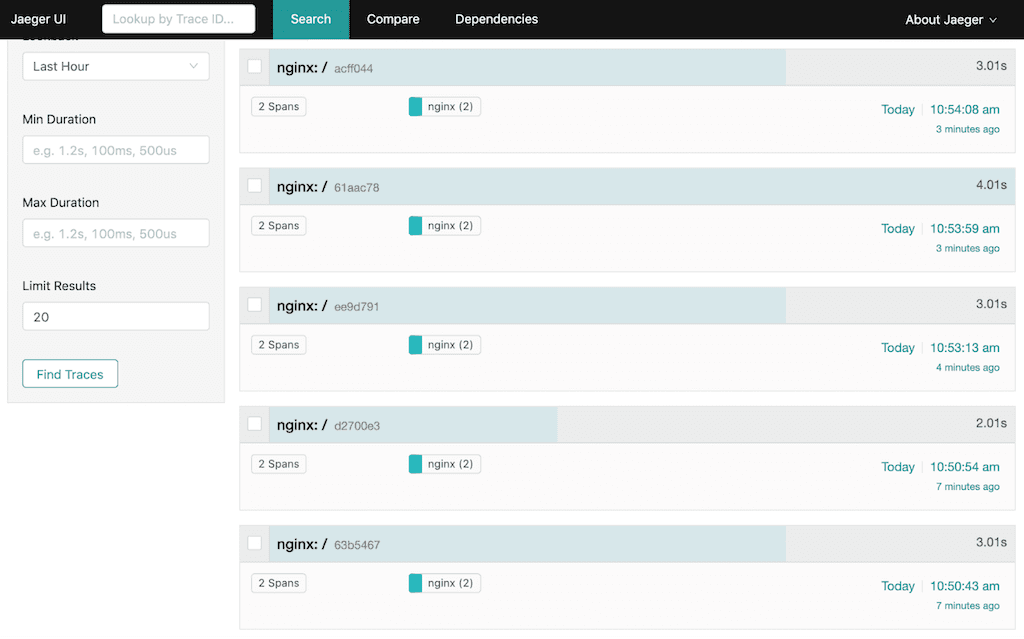
Here’s the same information on the Ruby app console:
- -> /slept for: 3s.
127.0.0.1 - - [07/Jun/2019: 10:50:46 +0000] "GET / HTTP/1.1" 200 49 3.0028
127.0.0.1 - - [07/Jun/2019: 10:50:43 UTC] "GET / HTTP/1.0" 200 49
- -> /
slept for: 2s.
127.0.0.1 - - [07/Jun/2019: 10:50:56 +0000] "GET / HTTP/1.1" 200 49 2.0018
127.0.0.1 - - [07/Jun/2019: 10:50:54 UTC] "GET / HTTP/1.0"1 200 49
- -> /
slept for: 3s.
127.0.0.1 - - [07/Jun/2019: 10:53:16 +0000] "GET / HTTP/1.1" 200 49 3.0029
127.0.0.1 - - [07/Jun/2019: 10:53:13 UTC] "GET / HTTP/1.0" 200 49
- -> /
slept for: 4s.
127.0.0.1 - - [07/Jun/2019: 10:54:03 +0000] "GET / HTTP/1.1" 200 49 4.0030
127.0.0.1 - - [07/Jun/2019: 10:53:59 UTC] "GET / HTTP/1.0" 200 49
- -> /
slept for: 3s.
127.0.0.1 - - [07/Jun/2019: 10:54:11 +0000] "GET / HTTP/1.1" 200 49 3.0012
127.0.0.1 - - [07/Jun/2019: 10:54:08 UTC] "GET / HTTP/1.0" 200 49
In the Jaeger UI we click on the first (most recent) request to view details about it, including the values of the NGINX Plus variables we added as tags:
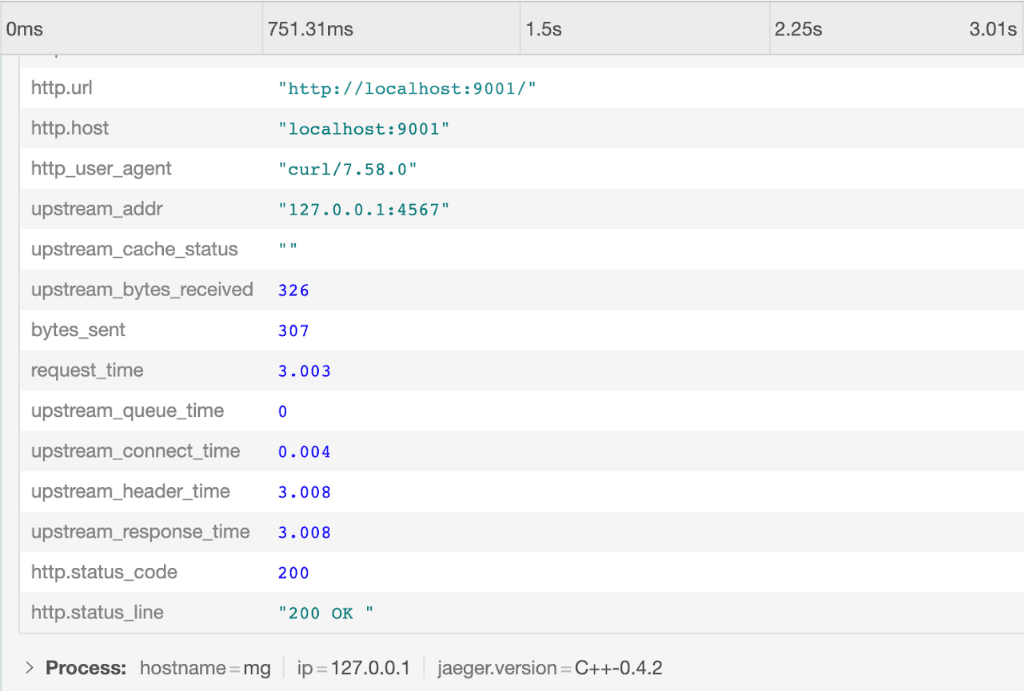
Output from Zipkin Without Caching
Here are another five requests in the Zipkin UI:
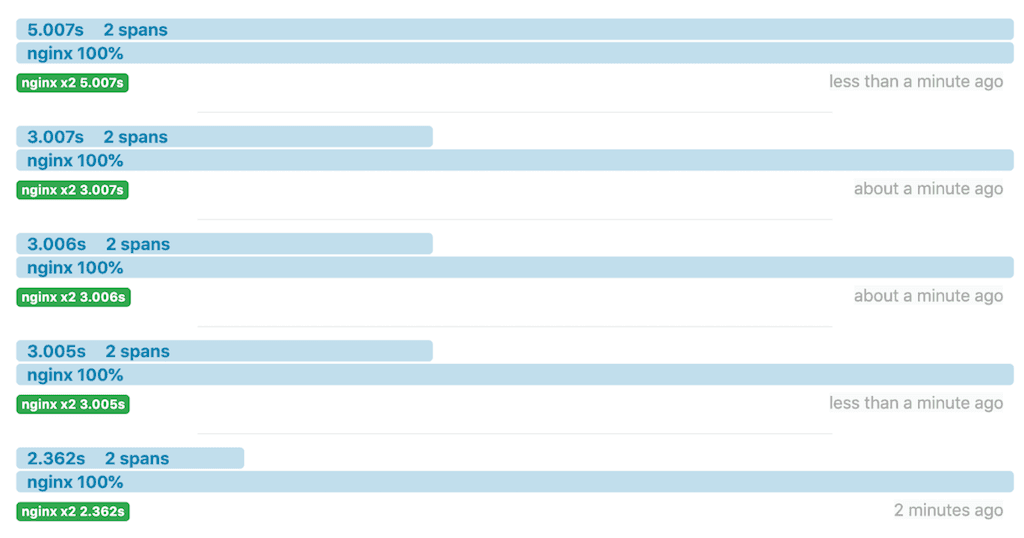
The same information on the Ruby app console:
- -> /slept for: 2s.
127.0.0.1 - - [07/Jun/2019: 10:31:18 +0000] "GET / HTTP/1.1" 200 49 2.0021
127.0.0.1 - - [07/Jun/2019: 10:31:16 UTC] "GET / HTTP/1.0" 200 49
- -> /
slept for: 3s.
127.0.0.1 - - [07/Jun/2019: 10:31:50 +0000] "GET / HTTP/1.1" 200 49 3.0029
127.0.0.1 - - [07/Jun/2019: 10:31:47 UTC] "GET / HTTP/1.0" 200 49
- -> /
slept for: 3s.
127.0.0.1 - - [07/Jun/2019: 10:32:08 +0000] "GET / HTTP/1.1" 200 49 3.0026
127.0.0.1 - - [07/Jun/2019: 10:32:05 UTC] "GET / HTTP/1.0" 200 49
- -> /
slept for: 3s.
127.0.0.1 - - [07/Jun/2019: 10:32:32 +0000] "GET / HTTP/1.1" 200 49 3.0015
127.0.0.1 - - [07/Jun/2019: 10:32:29 UTC] "GET / HTTP/1.0" 200 49
- -> /
slept for: 5s.
127.0.0.1 - - [07/Jun/2019: 10:32:52 +0000] "GET / HTTP/1.1" 200 49 5.0030
127.0.0.1 - - [07/Jun/2019: 10:32:47 UTC] "GET / HTTP/1.0" 200 49
In the Zipkin UI we click on the first request to view details about it, including the values of the NGINX Plus variables we added as tags:
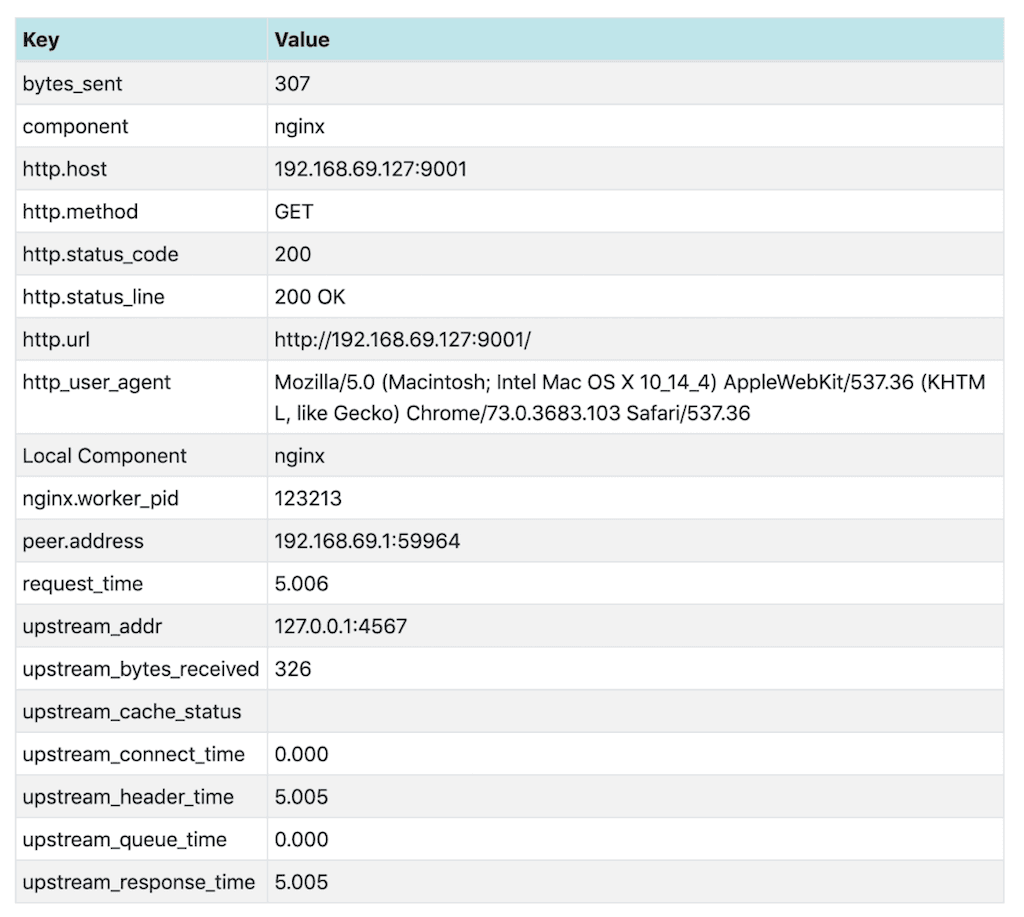
Tracing Response Times with Caching
Configuring NGINX Plus Caching
We enable caching by adding directives in the opentracing.conf file we created in Configuring NGINX Plus.
- In the
httpcontext, add thisproxy_cache_pathdirective:proxy_cache_path /data/nginx/cache keys_zone=one:10m; - In the
serverblock, add the followingproxy_cacheandproxy_cache_validdirectives:proxy_cache one; proxy_cache_valid any 1m; - Validate and reload the configuration:
$ nginx -t$ nginx -s reload
Output from Jaeger with Caching
Here’s the Jaeger UI after two requests.
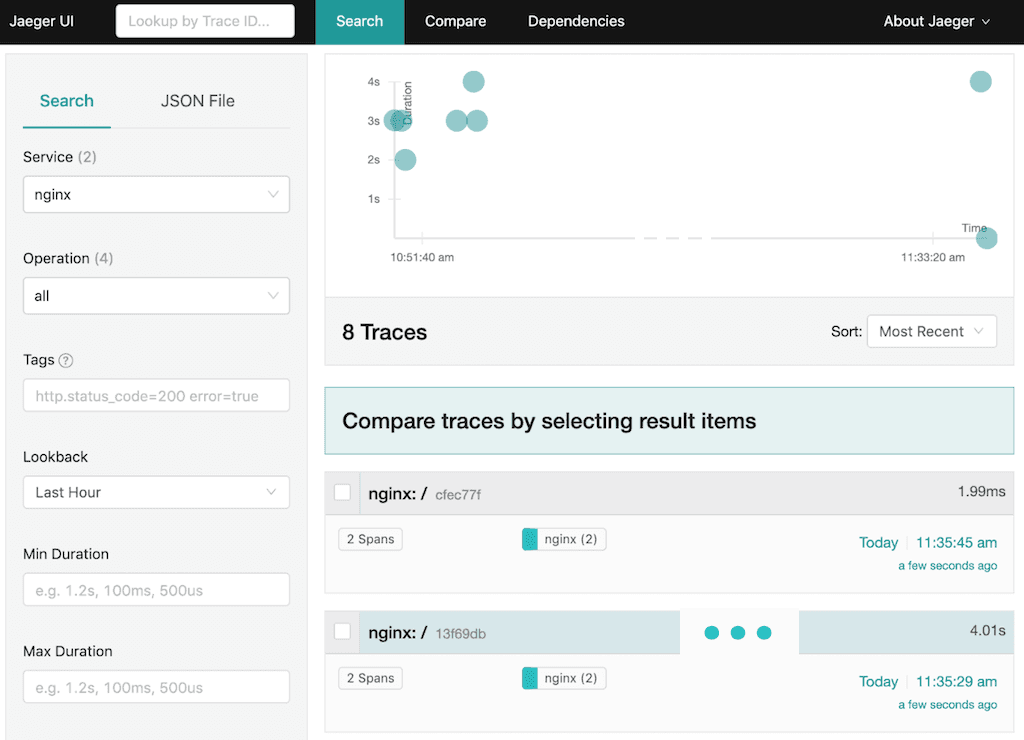
The first response (labeled 13f69db) took 4 seconds. NGINX Plus cached the response, and when the request was repeated about 15 seconds later, the response took less than 2 milliseconds (ms) because it came from the NGINX Plus cache.
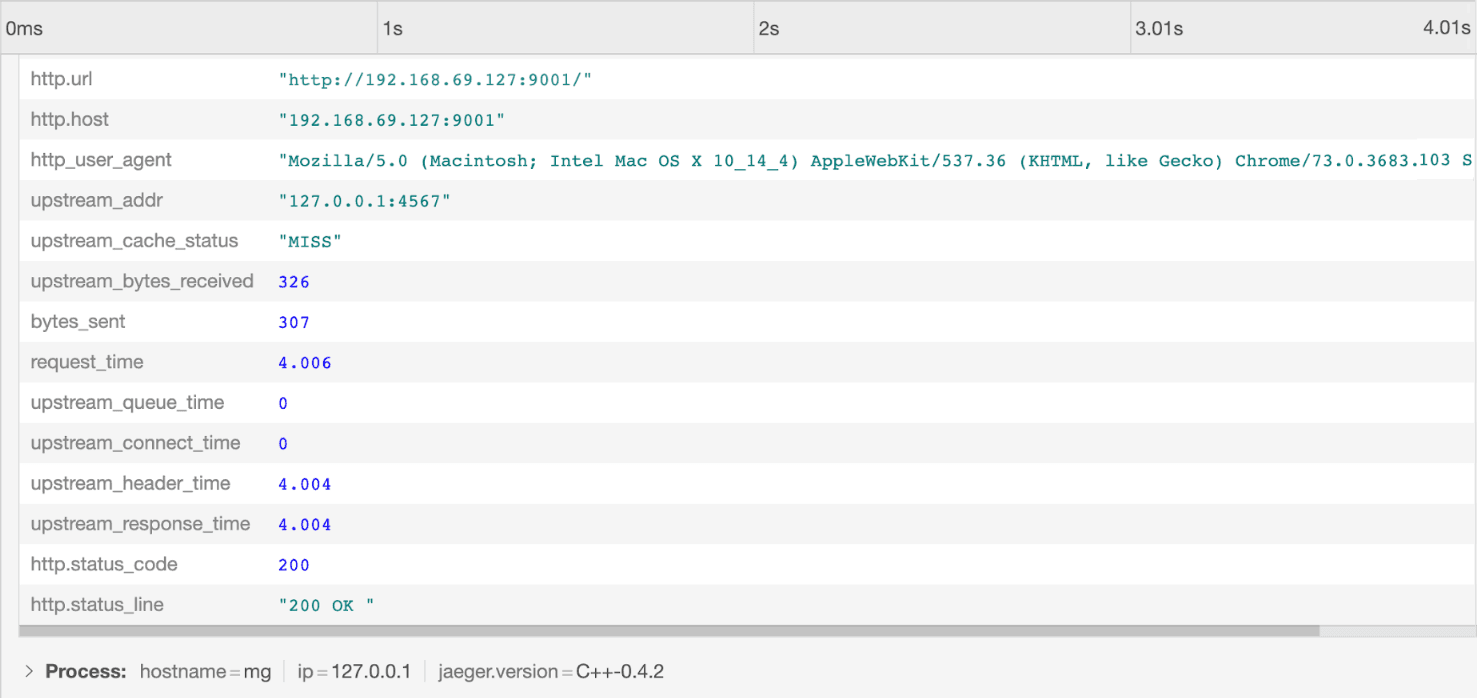
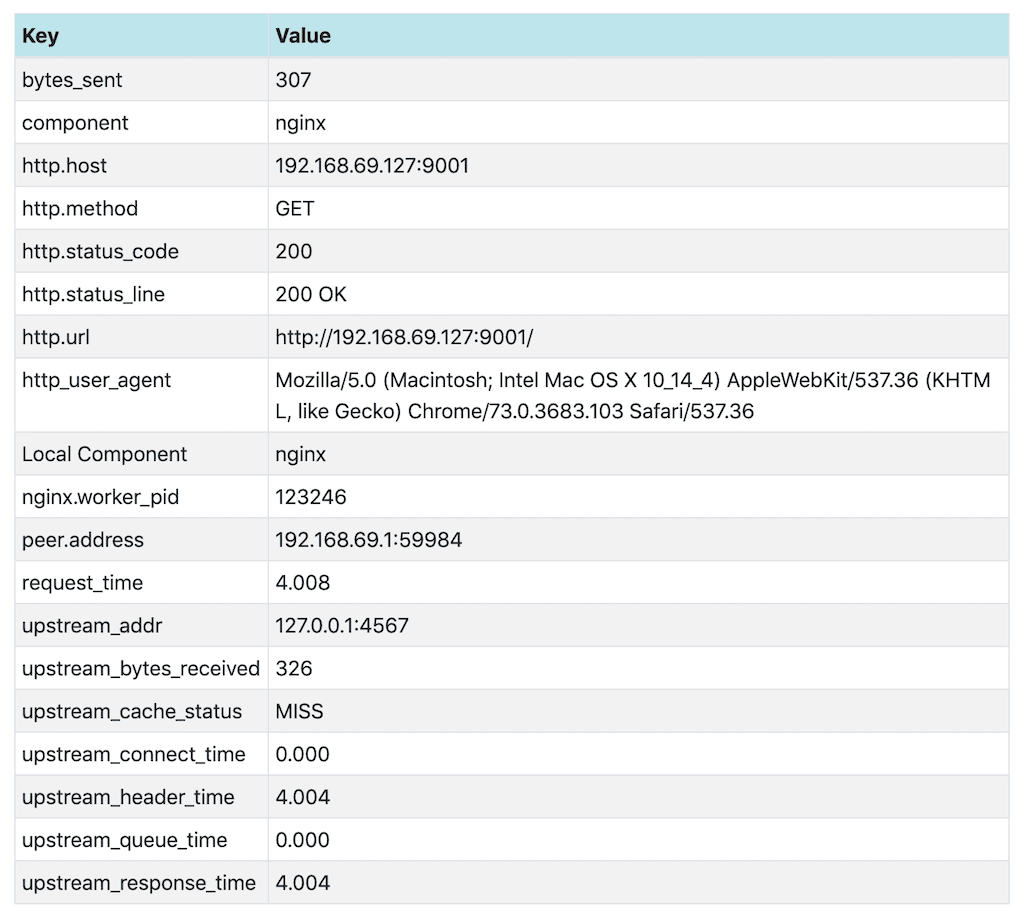
Looking at the two requests in detail explains the difference in response time. For the first request, upstream_cache_status is MISS, meaning the requested data was not in the cache. The Ruby app added a delay of 4 seconds.
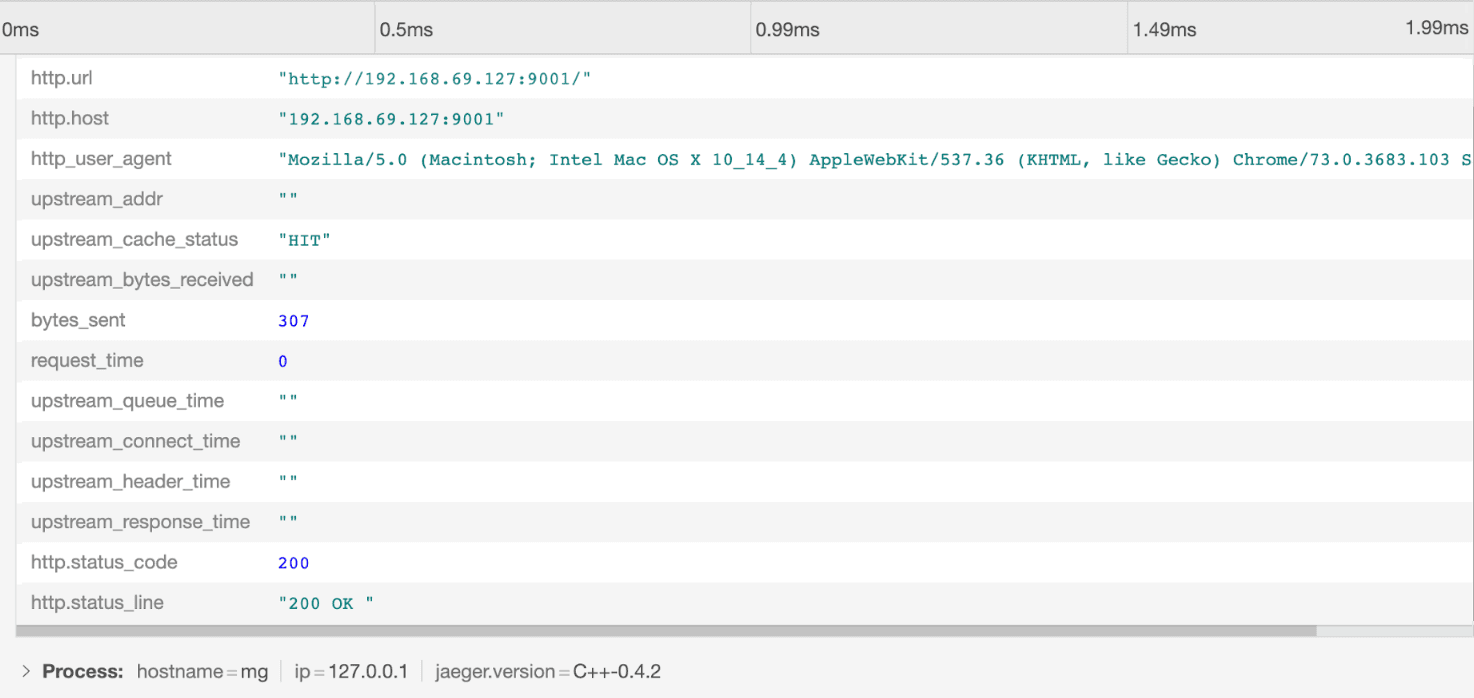
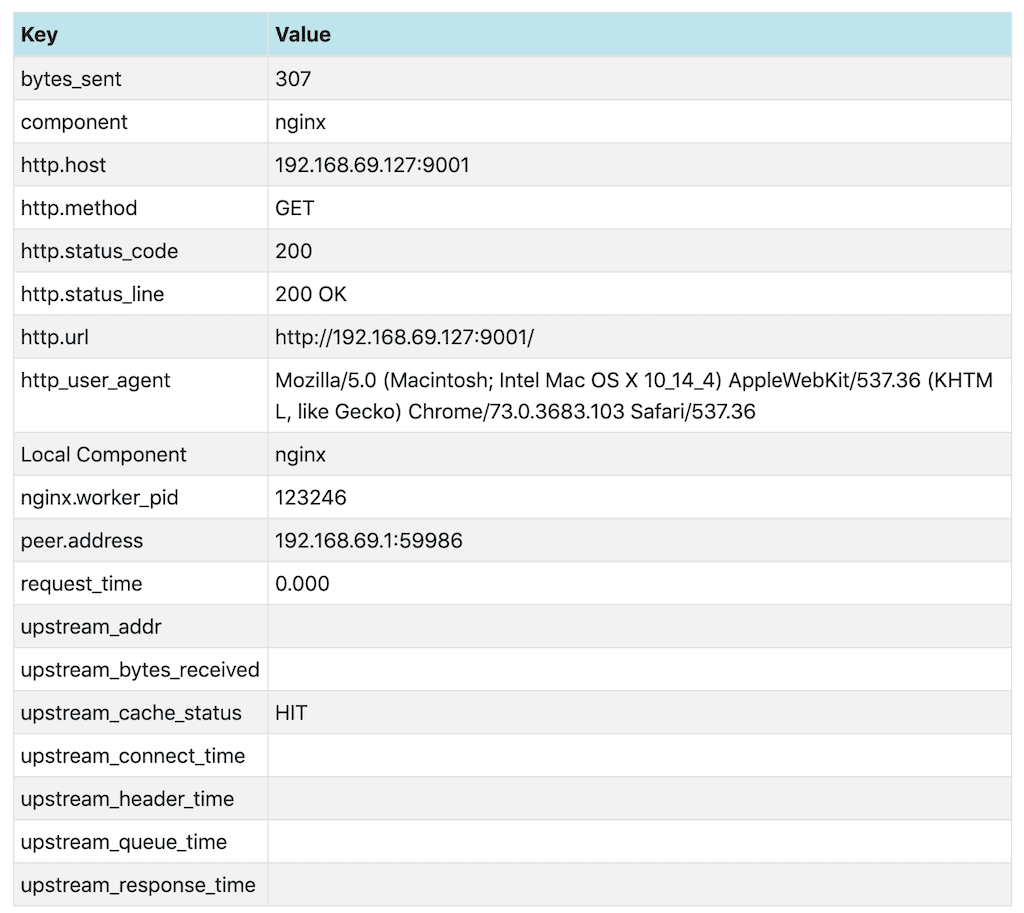
For the second request, upstream_cache_status is HIT. Because the data is coming from the cache, the Ruby app cannot add a delay, and the response time is under 2ms. The empty upstream_* values also indicate that the upstream server was not involved in this response.
Output from Zipkin with Caching
The display in the Zipkin UI for two requests with caching enabled paints a similar picture:
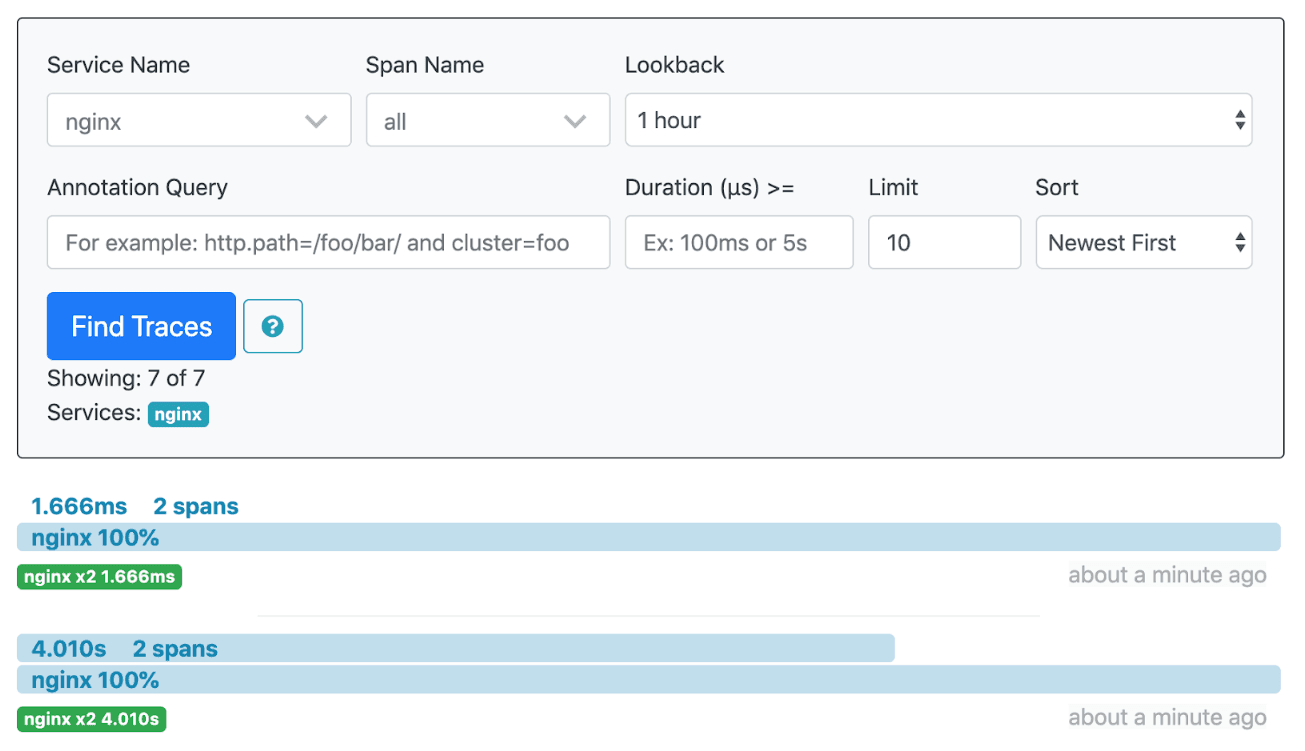
And again looking at the two requests in detail explains the difference in response time. The response is not cached for the first request (upstream_cache_status is MISS) and the Ruby app (coincidentally) adds the same 4-second delay as in the Jaeger example.
The response has been cached before we make the second request, so upstream_cache_status is HIT.
Conclusion
The NGINX OpenTracing module enables tracing of NGINX Plus requests and responses, and provides access to NGINX Plus variables using OpenTracing tags. Different tracers can also be used with this module.
For more details about the NGINX OpenTracing module, visit the NGINX OpenTracing module repo on GitHub.
To try OpenTracing with NGINX Plus, start your free 30-day trial today or contact us to discuss your use cases.
About the Author
Related Blog Posts
Automating Certificate Management in a Kubernetes Environment
Simplify cert management by providing unique, automatically renewed and updated certificates to your endpoints.

Secure Your API Gateway with NGINX App Protect WAF
As monoliths move to microservices, applications are developed faster than ever. Speed is necessary to stay competitive and APIs sit at the front of these rapid modernization efforts. But the popularity of APIs for application modernization has significant implications for app security.
How Do I Choose? API Gateway vs. Ingress Controller vs. Service Mesh
When you need an API gateway in Kubernetes, how do you choose among API gateway vs. Ingress controller vs. service mesh? We guide you through the decision, with sample scenarios for north-south and east-west API traffic, plus use cases where an API gateway is the right tool.
Deploying NGINX as an API Gateway, Part 2: Protecting Backend Services
In the second post in our API gateway series, Liam shows you how to batten down the hatches on your API services. You can use rate limiting, access restrictions, request size limits, and request body validation to frustrate illegitimate or overly burdensome requests.
New Joomla Exploit CVE-2015-8562
Read about the new zero day exploit in Joomla and see the NGINX configuration for how to apply a fix in NGINX or NGINX Plus.
Why Do I See “Welcome to nginx!” on My Favorite Website?
The ‘Welcome to NGINX!’ page is presented when NGINX web server software is installed on a computer but has not finished configuring